Business Decision Making: Data Analysis for Syngenta Report
VerifiedAdded on 2020/07/22
|18
|3459
|98
Report
AI Summary
This report focuses on business decision-making for Syngenta, employing data analysis techniques. It begins with an introduction to analytics and a descriptive analysis of data. The report gathers primary and secondary data, including a survey with 20 respondents, and uses sampling methods like stratified random sampling. Descriptive statistics, including mean, median, mode, and standard deviation, are calculated and interpreted. Graphical representations, such as charts, are used to visualize data and trends. The report also includes a trend line chart for sales, cost, and profit, and project appraisal methods are used to select the best option for the company. Finally, recommendations are provided based on the research findings, along with a network diagram illustrating the sequence of activities.

BUSINESS DECISION
MAKING
MAKING
Paraphrase This Document
Need a fresh take? Get an instant paraphrase of this document with our AI Paraphraser
1 | P a g e
INTRODUCTION
Analytics is one of the field that is growing at rapid pace across the globe. In the current
report data analysis in context of Syngenta is done by using decriptive analysis tool. Results are
interpreted in proper manner. On the basis of results recommendation is done to the firm in the
formal business report. Apart from this, in present research sudy trend analysis is done and
outcomes are analyzed in legitimate way. At end the research study, network diagram is
prepsared and sequence in which activities must be performed is determined. Along with this, by
using project appraisal methods best one is selcted in respect to the company.
TASK 1
1.1 Gathering of varied sort of data for research
Syngenta is the one of the leading manufactuer of the fungcide and pesicides across the
globe. In the current report detail plan will be outlined which will be followed to carried out
research work in legitimate way. In order to do present research study primary and secondary
data will be gathered. According to requirement of the research study it will be determined what
will be proportion of primary and secondary research in overall work. Secondary data will be
gathered from the varied sources like reading items and electronic media (Babajana and Phillips,
2016). By reviewing a literature broad understanding will be developed about current research
topic and about international market. Apart from secondary research primary research will also
be done and under this questionnaire will be distributed among respondents. In the present
research study sample of 20 respondents will be taken that have good understanding of
pesticides. By doing so it will be ensured that research work is carried out in proper manner by
the business firm.
1.2 Sampling method and survery methodology
Sampling methods and survey methodology play an important role in making any
research success or failed. As part of survey methodolgy sample size of 20 respondents will be
taken that are residing nearby to London. Varied approaches that are available to extract sample
units from population are given below. Simple random sampling: Under mentioned method randomly sample units are choosen
from the group of people which is commonly termed as population (Gong and et.al.,
2016). In other words it can be said that without taking any factor as base at own desire
sample units are taken from population.
2 | P a g e
⊘ This is a preview!⊘
Do you want full access?
Subscribe today to unlock all pages.
Trusted by 1+ million students worldwide
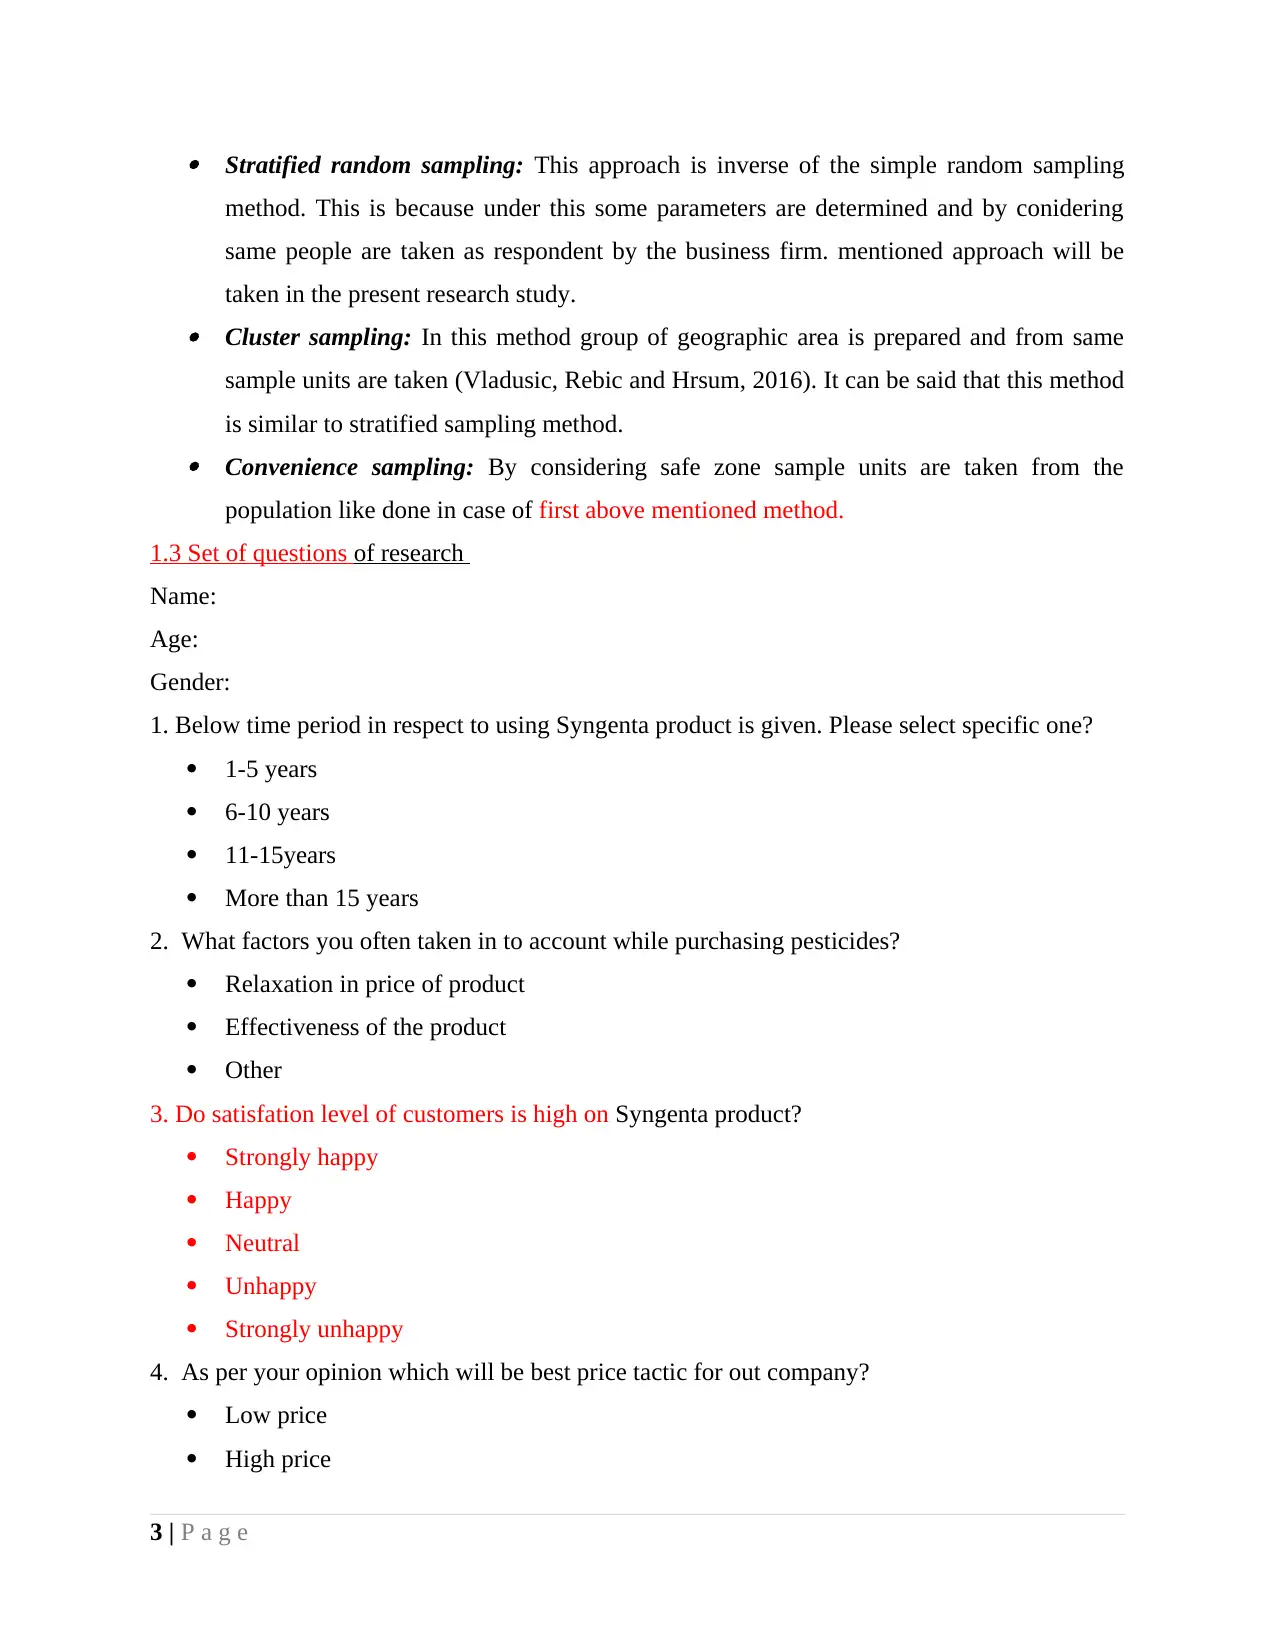
Stratified random sampling: This approach is inverse of the simple random sampling
method. This is because under this some parameters are determined and by conidering
same people are taken as respondent by the business firm. mentioned approach will be
taken in the present research study. Cluster sampling: In this method group of geographic area is prepared and from same
sample units are taken (Vladusic, Rebic and Hrsum, 2016). It can be said that this method
is similar to stratified sampling method. Convenience sampling: By considering safe zone sample units are taken from the
population like done in case of first above mentioned method.
1.3 Set of questions of research
Name:
Age:
Gender:
1. Below time period in respect to using Syngenta product is given. Please select specific one?
1-5 years
6-10 years
11-15years
More than 15 years
2. What factors you often taken in to account while purchasing pesticides?
Relaxation in price of product
Effectiveness of the product
Other
3. Do satisfation level of customers is high on Syngenta product?
Strongly happy
Happy
Neutral
Unhappy
Strongly unhappy
4. As per your opinion which will be best price tactic for out company?
Low price
High price
3 | P a g e
Paraphrase This Document
Need a fresh take? Get an instant paraphrase of this document with our AI Paraphraser
Middle price
5. Is it best time to launch our newly proposed product in the UK market?
Yes
No
6 To which limit Amistar can be prefered by the local people for use in their land?
Very less ()
Medium limit ()
Maximum ()
7 Amistar can face cut throat competition from some of products in UK market?
Yes ( )
No ( )
12 Do you agree with the fact that in case price of pesticide increase demand may decline.
Strongly happy
Happy
Neutral
Unhappy
Strongly unhappy
TASK 2
2.1 Descriptive statistics and its use
Wide variety of statistical methods which can be employed by researchers in the research
study. Some of them are explained below. Mean: This tool is employed by data scientist in their research work to get overall picture
of the variable in terms of average performance of the variable during specific time
period (The Mean, the Median, and the Mode, 2017). By evaluating current value and
average value performance of the firm or any variable is measured. Median: When any researcher wants to split set of values in to two sets median is used. It
is very important to classify data set in to multiple parts because in real world data set of
1000 to 4000 rows is analyzed and in same there are different hidden patterns. It is very
important to identify these trends and this objective is achieved by using median value.
This value segragate data in to multiple parts and then both of them are analyzed
separately amd hidden trends are identified.
4 | P a g e
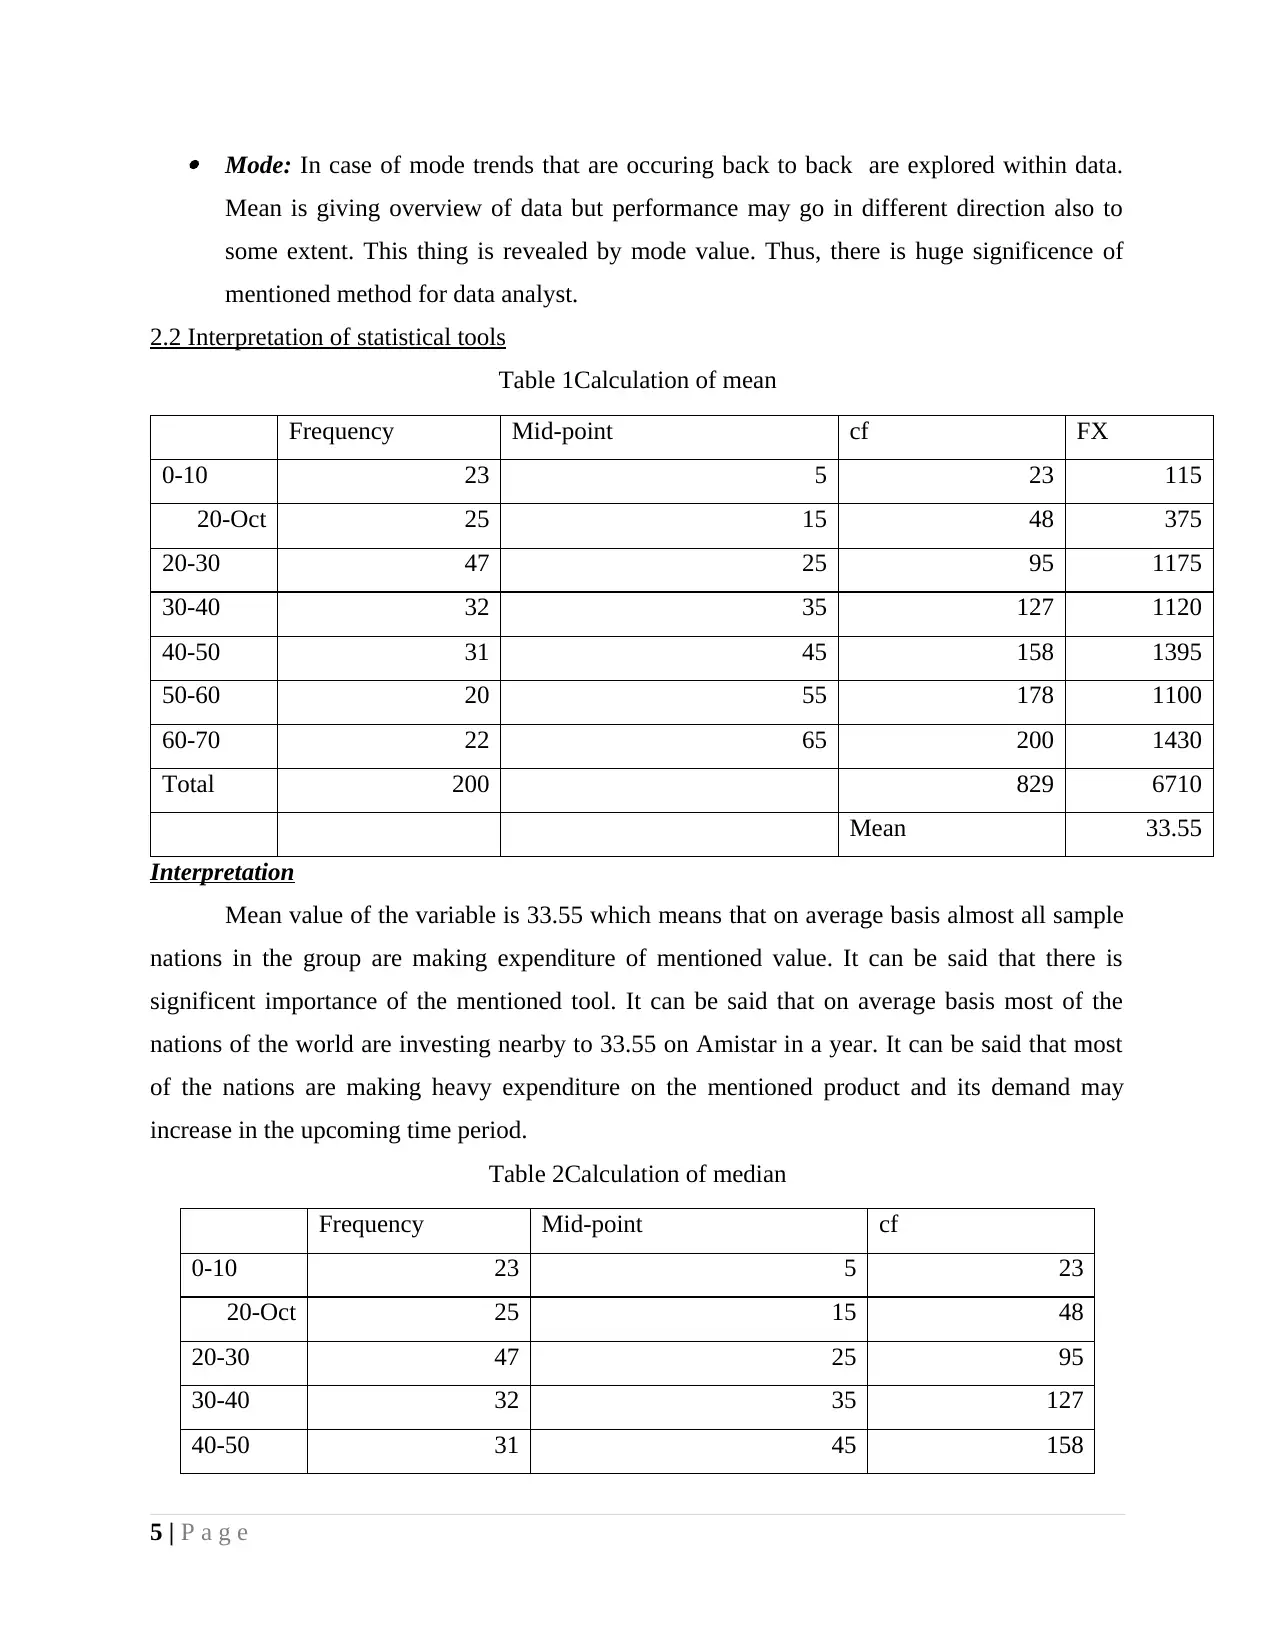
Mode: In case of mode trends that are occuring back to back are explored within data.
Mean is giving overview of data but performance may go in different direction also to
some extent. This thing is revealed by mode value. Thus, there is huge significence of
mentioned method for data analyst.
2.2 Interpretation of statistical tools
Table 1Calculation of mean
Frequency Mid-point cf FX
0-10 23 5 23 115
20-Oct 25 15 48 375
20-30 47 25 95 1175
30-40 32 35 127 1120
40-50 31 45 158 1395
50-60 20 55 178 1100
60-70 22 65 200 1430
Total 200 829 6710
Mean 33.55
Interpretation
Mean value of the variable is 33.55 which means that on average basis almost all sample
nations in the group are making expenditure of mentioned value. It can be said that there is
significent importance of the mentioned tool. It can be said that on average basis most of the
nations of the world are investing nearby to 33.55 on Amistar in a year. It can be said that most
of the nations are making heavy expenditure on the mentioned product and its demand may
increase in the upcoming time period.
Table 2Calculation of median
Frequency Mid-point cf
0-10 23 5 23
20-Oct 25 15 48
20-30 47 25 95
30-40 32 35 127
40-50 31 45 158
5 | P a g e
⊘ This is a preview!⊘
Do you want full access?
Subscribe today to unlock all pages.
Trusted by 1+ million students worldwide
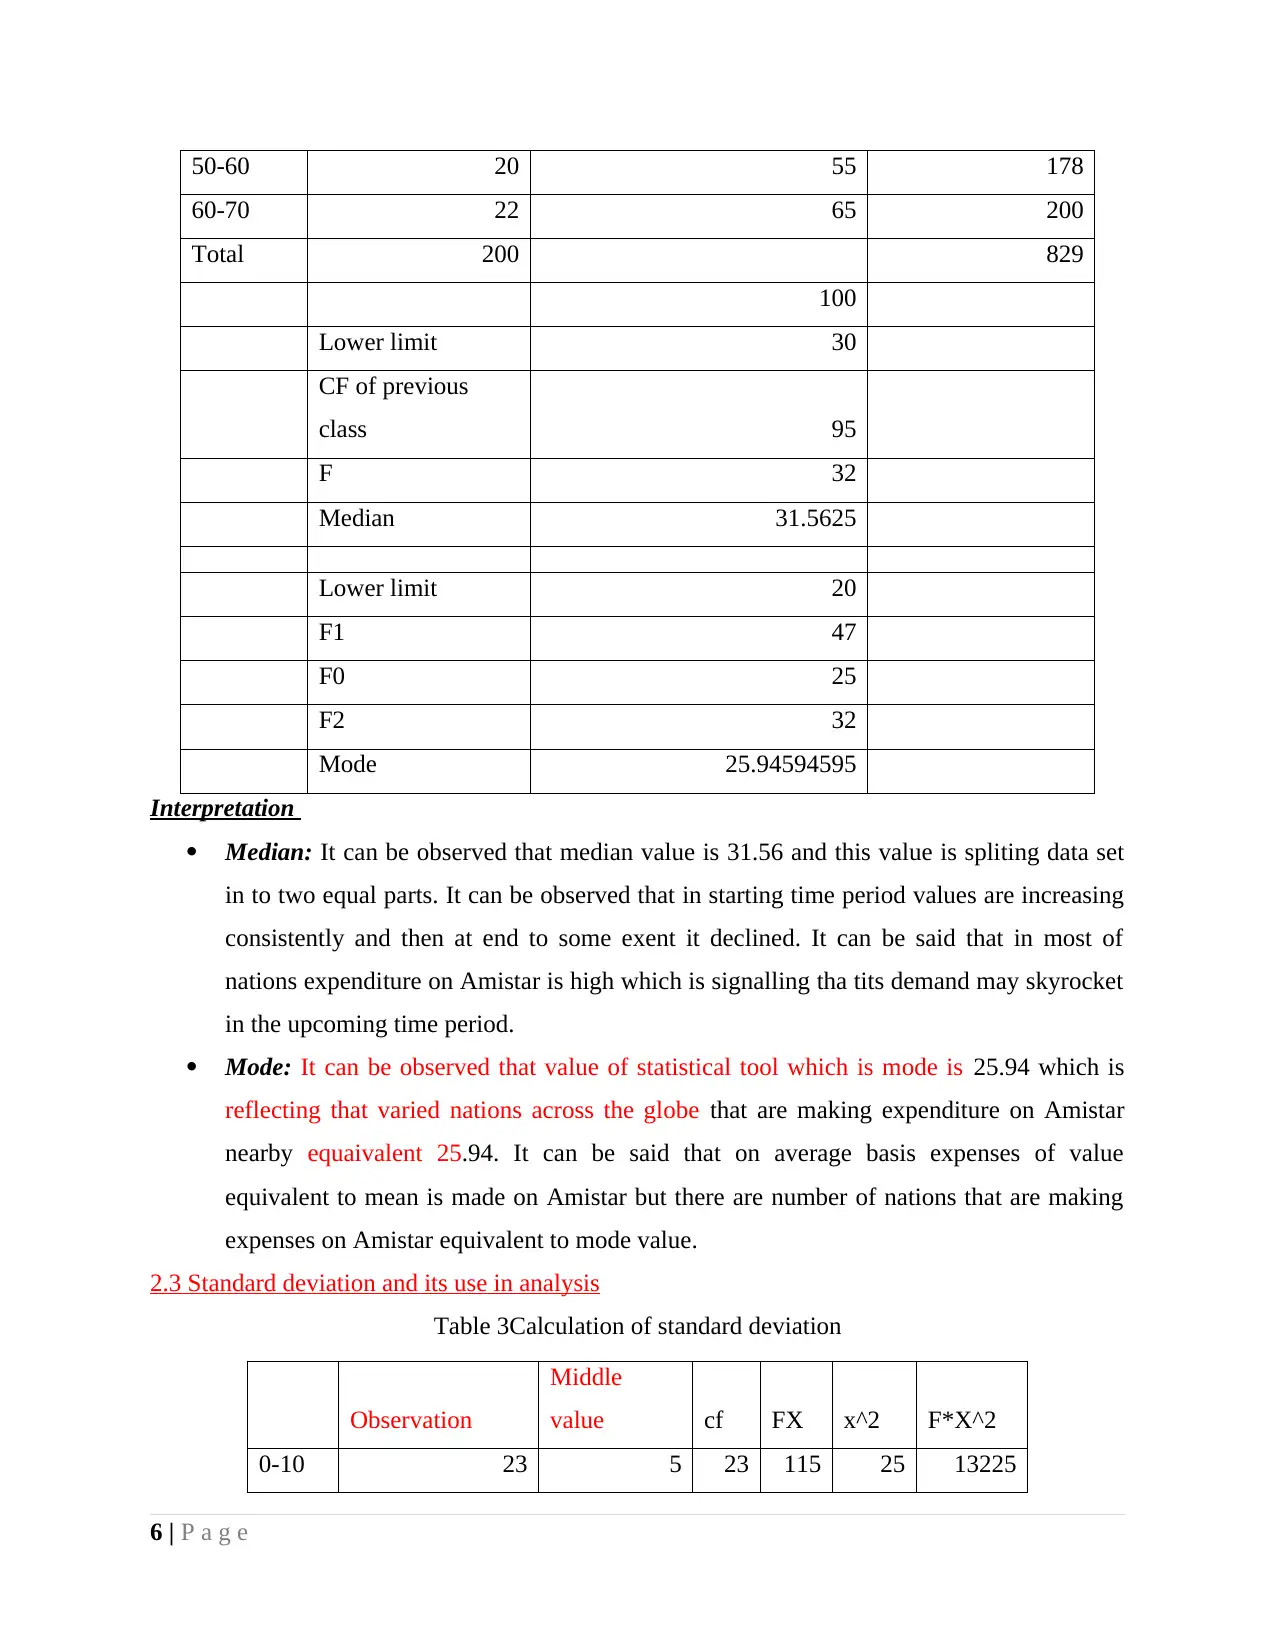
50-60 20 55 178
60-70 22 65 200
Total 200 829
100
Lower limit 30
CF of previous
class 95
F 32
Median 31.5625
Lower limit 20
F1 47
F0 25
F2 32
Mode 25.94594595
Interpretation
Median: It can be observed that median value is 31.56 and this value is spliting data set
in to two equal parts. It can be observed that in starting time period values are increasing
consistently and then at end to some exent it declined. It can be said that in most of
nations expenditure on Amistar is high which is signalling tha tits demand may skyrocket
in the upcoming time period.
Mode: It can be observed that value of statistical tool which is mode is 25.94 which is
reflecting that varied nations across the globe that are making expenditure on Amistar
nearby equaivalent 25.94. It can be said that on average basis expenses of value
equivalent to mean is made on Amistar but there are number of nations that are making
expenses on Amistar equivalent to mode value.
2.3 Standard deviation and its use in analysis
Table 3Calculation of standard deviation
Observation
Middle
value cf FX x^2 F*X^2
0-10 23 5 23 115 25 13225
6 | P a g e
Paraphrase This Document
Need a fresh take? Get an instant paraphrase of this document with our AI Paraphraser
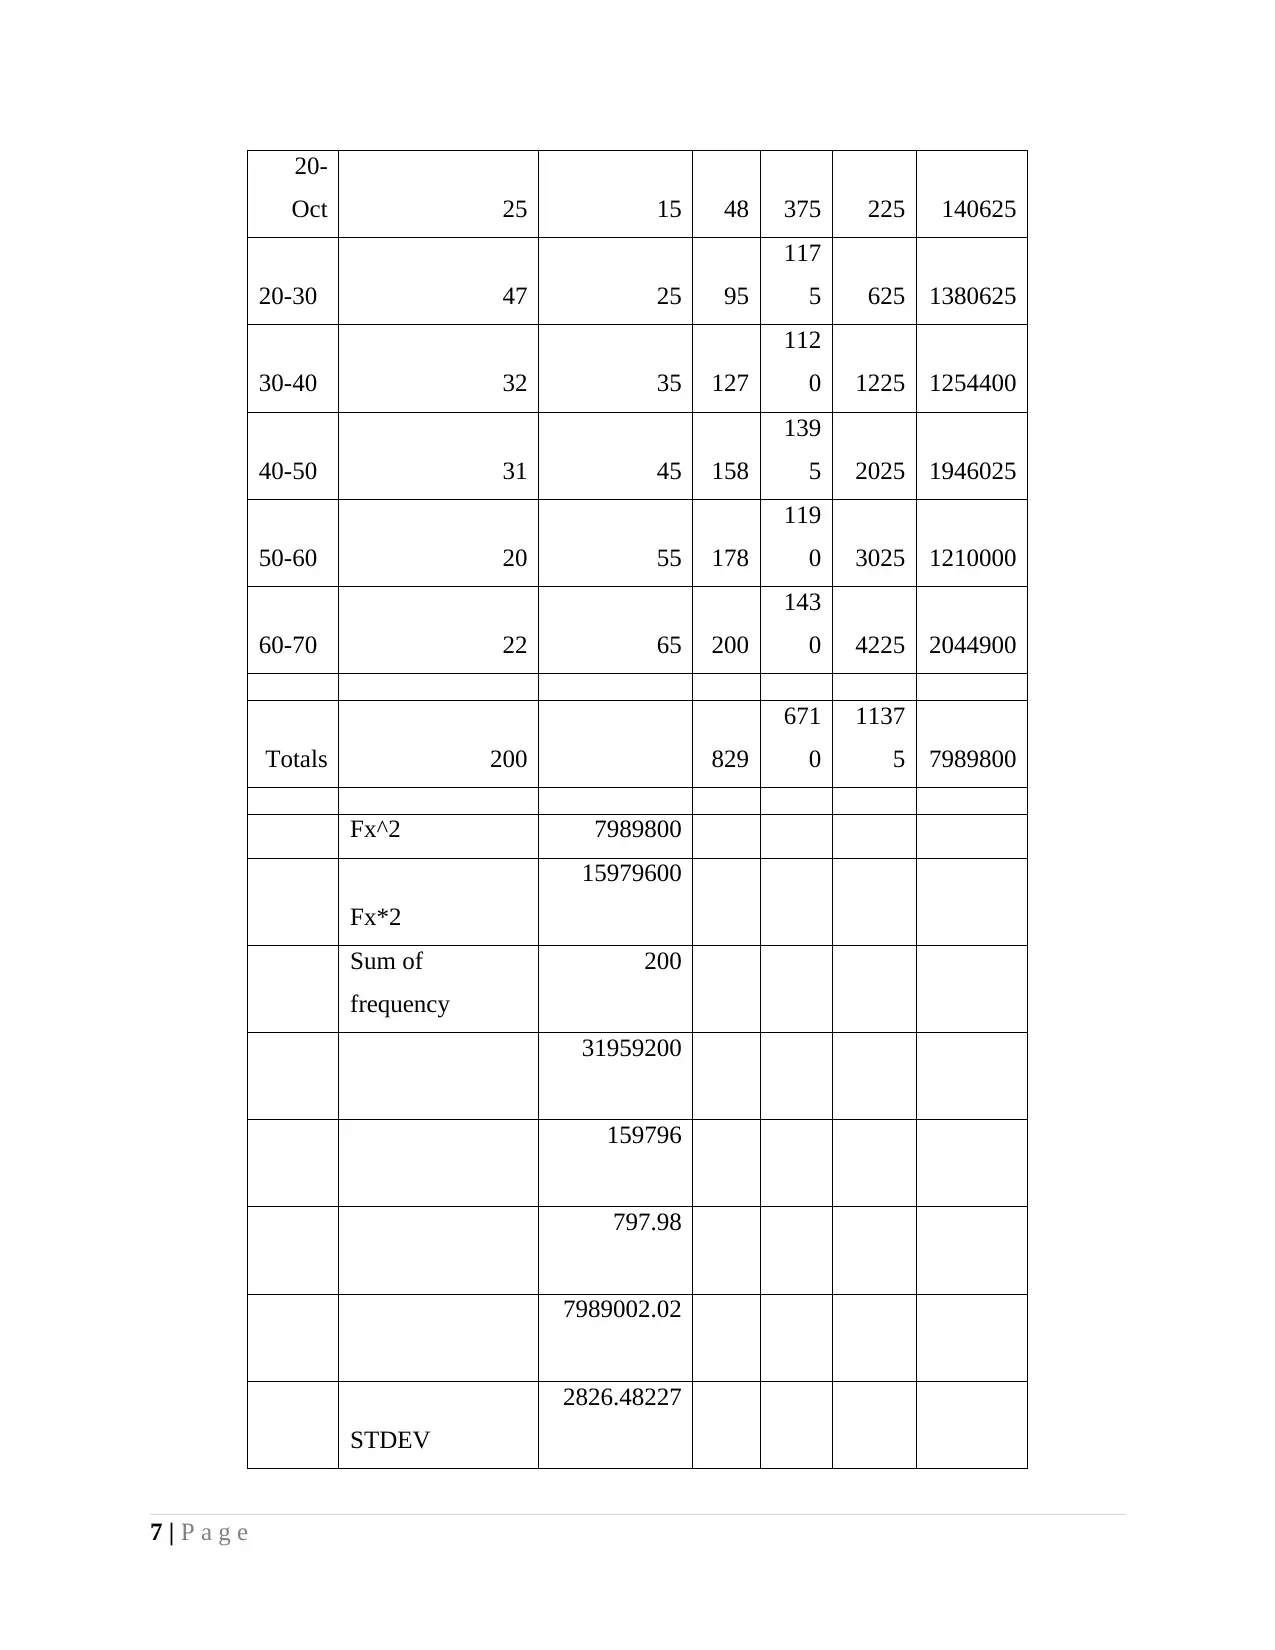
20-
Oct 25 15 48 375 225 140625
20-30 47 25 95
117
5 625 1380625
30-40 32 35 127
112
0 1225 1254400
40-50 31 45 158
139
5 2025 1946025
50-60 20 55 178
119
0 3025 1210000
60-70 22 65 200
143
0 4225 2044900
Totals 200 829
671
0
1137
5 7989800
Fx^2 7989800
Fx*2
15979600
Sum of
frequency
200
31959200
159796
797.98
7989002.02
STDEV
2826.48227
7 | P a g e
Interpretation
Standard deviation is method that employed for taking decisions by the busines firms
(Standard deviation, 2017). Standard deviation reflects the degree of movement that happened in
the mean value of the variable from the mean value. Means that through mean we come to know
about overall performance but it become also very impoertant to identify extent to which values
are moving up and down in comparison to mean value. It can be observed that standard deviation
is 2826 which is high and indicating that to large extent values are flcutuating in comparison to
mean value. On this basis it can be said that all nations are making expenditure on amistar at
different rates. Thus, those nations which are making heavy expenses can be selected as
destination for launch of new product in the market.
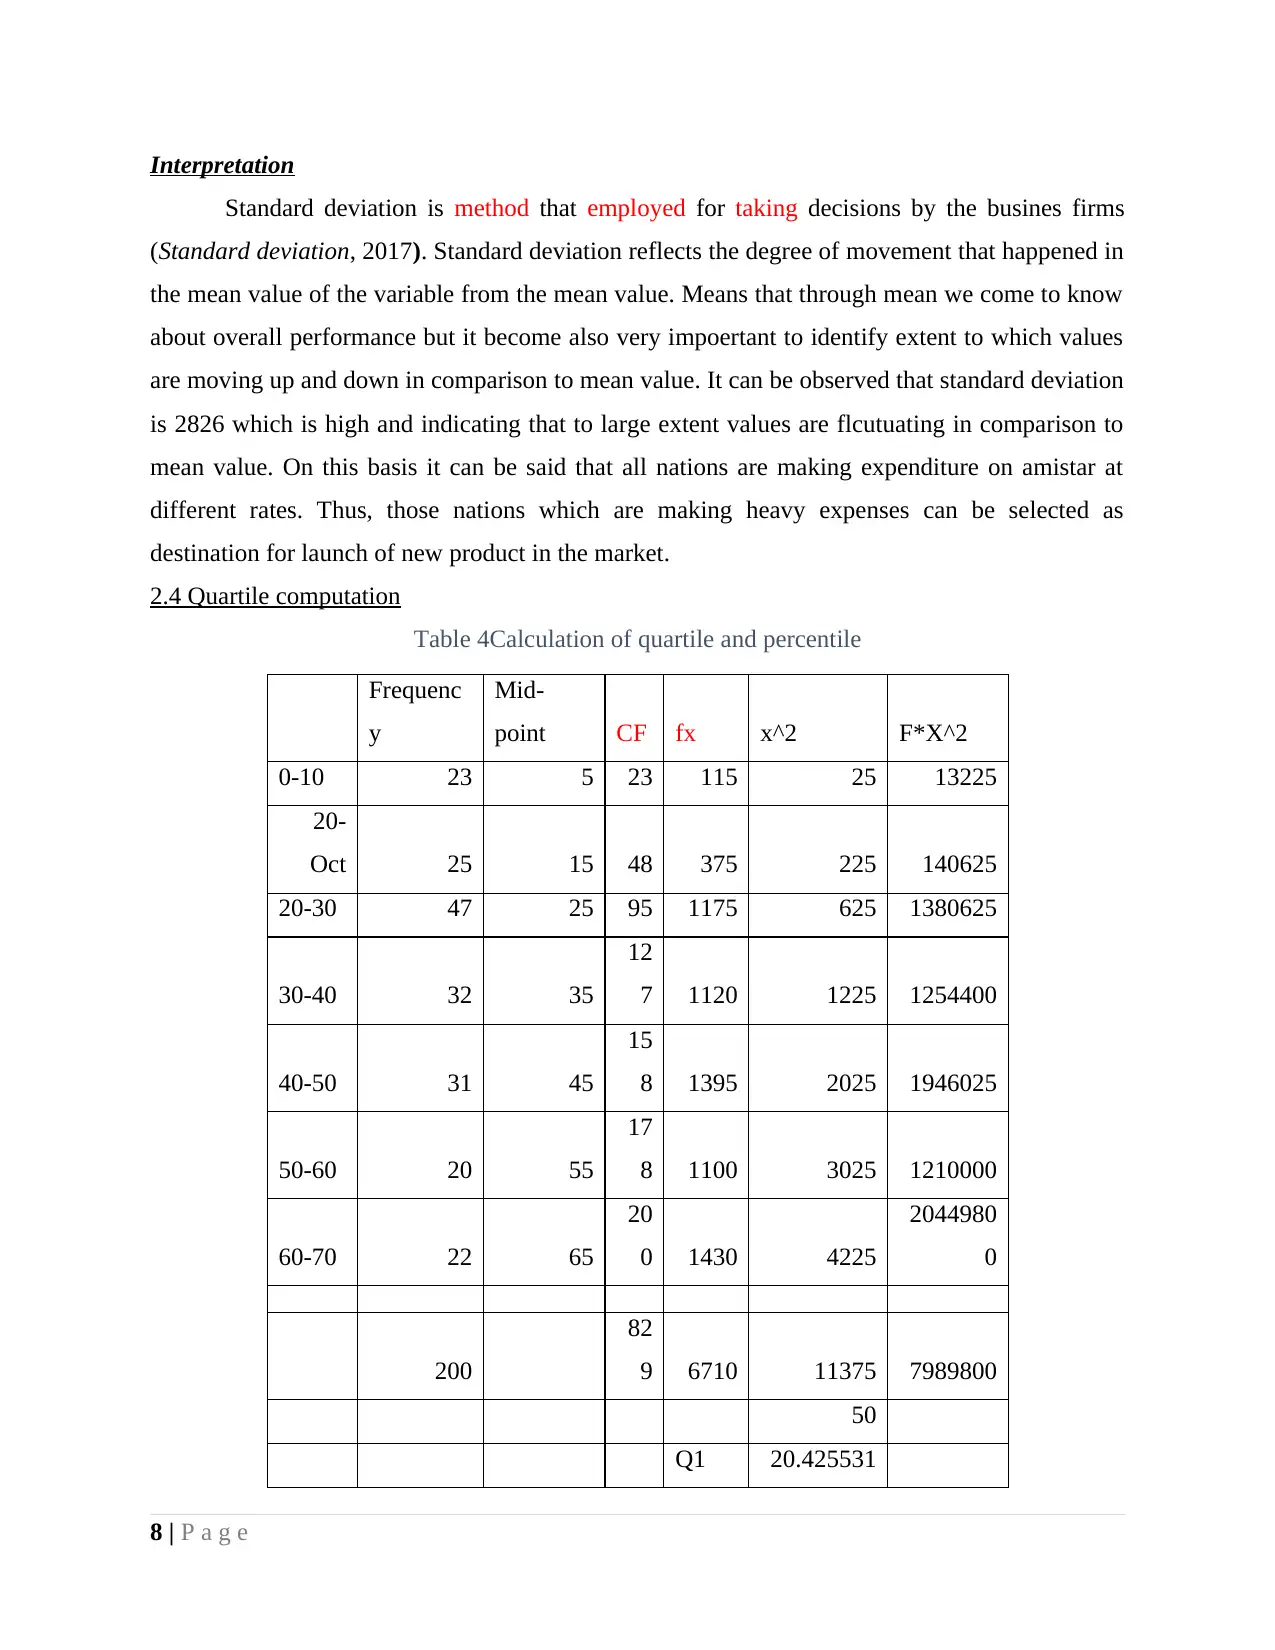
2.4 Quartile computation
Table 4Calculation of quartile and percentile
Frequenc
y
Mid-
point CF fx x^2 F*X^2
0-10 23 5 23 115 25 13225
20-
Oct 25 15 48 375 225 140625
20-30 47 25 95 1175 625 1380625
30-40 32 35
12
7 1120 1225 1254400
40-50 31 45
15
8 1395 2025 1946025
50-60 20 55
17
8 1100 3025 1210000
60-70 22 65
20
0 1430 4225
2044980
0
200
82
9 6710 11375 7989800
50
Q1 20.425531
8 | P a g e
Standard deviation is method that employed for taking decisions by the busines firms
(Standard deviation, 2017). Standard deviation reflects the degree of movement that happened in
the mean value of the variable from the mean value. Means that through mean we come to know
about overall performance but it become also very impoertant to identify extent to which values
are moving up and down in comparison to mean value. It can be observed that standard deviation
is 2826 which is high and indicating that to large extent values are flcutuating in comparison to
mean value. On this basis it can be said that all nations are making expenditure on amistar at
different rates. Thus, those nations which are making heavy expenses can be selected as
destination for launch of new product in the market.
2.4 Quartile computation
Table 4Calculation of quartile and percentile
Frequenc
y
Mid-
point CF fx x^2 F*X^2
0-10 23 5 23 115 25 13225
20-
Oct 25 15 48 375 225 140625
20-30 47 25 95 1175 625 1380625
30-40 32 35
12
7 1120 1225 1254400
40-50 31 45
15
8 1395 2025 1946025
50-60 20 55
17
8 1100 3025 1210000
60-70 22 65
20
0 1430 4225
2044980
0
200
82
9 6710 11375 7989800
50
Q1 20.425531
8 | P a g e
⊘ This is a preview!⊘
Do you want full access?
Subscribe today to unlock all pages.
Trusted by 1+ million students worldwide
9
150
Q3
47.419354
8
IQR 14.34
Rang
e 100
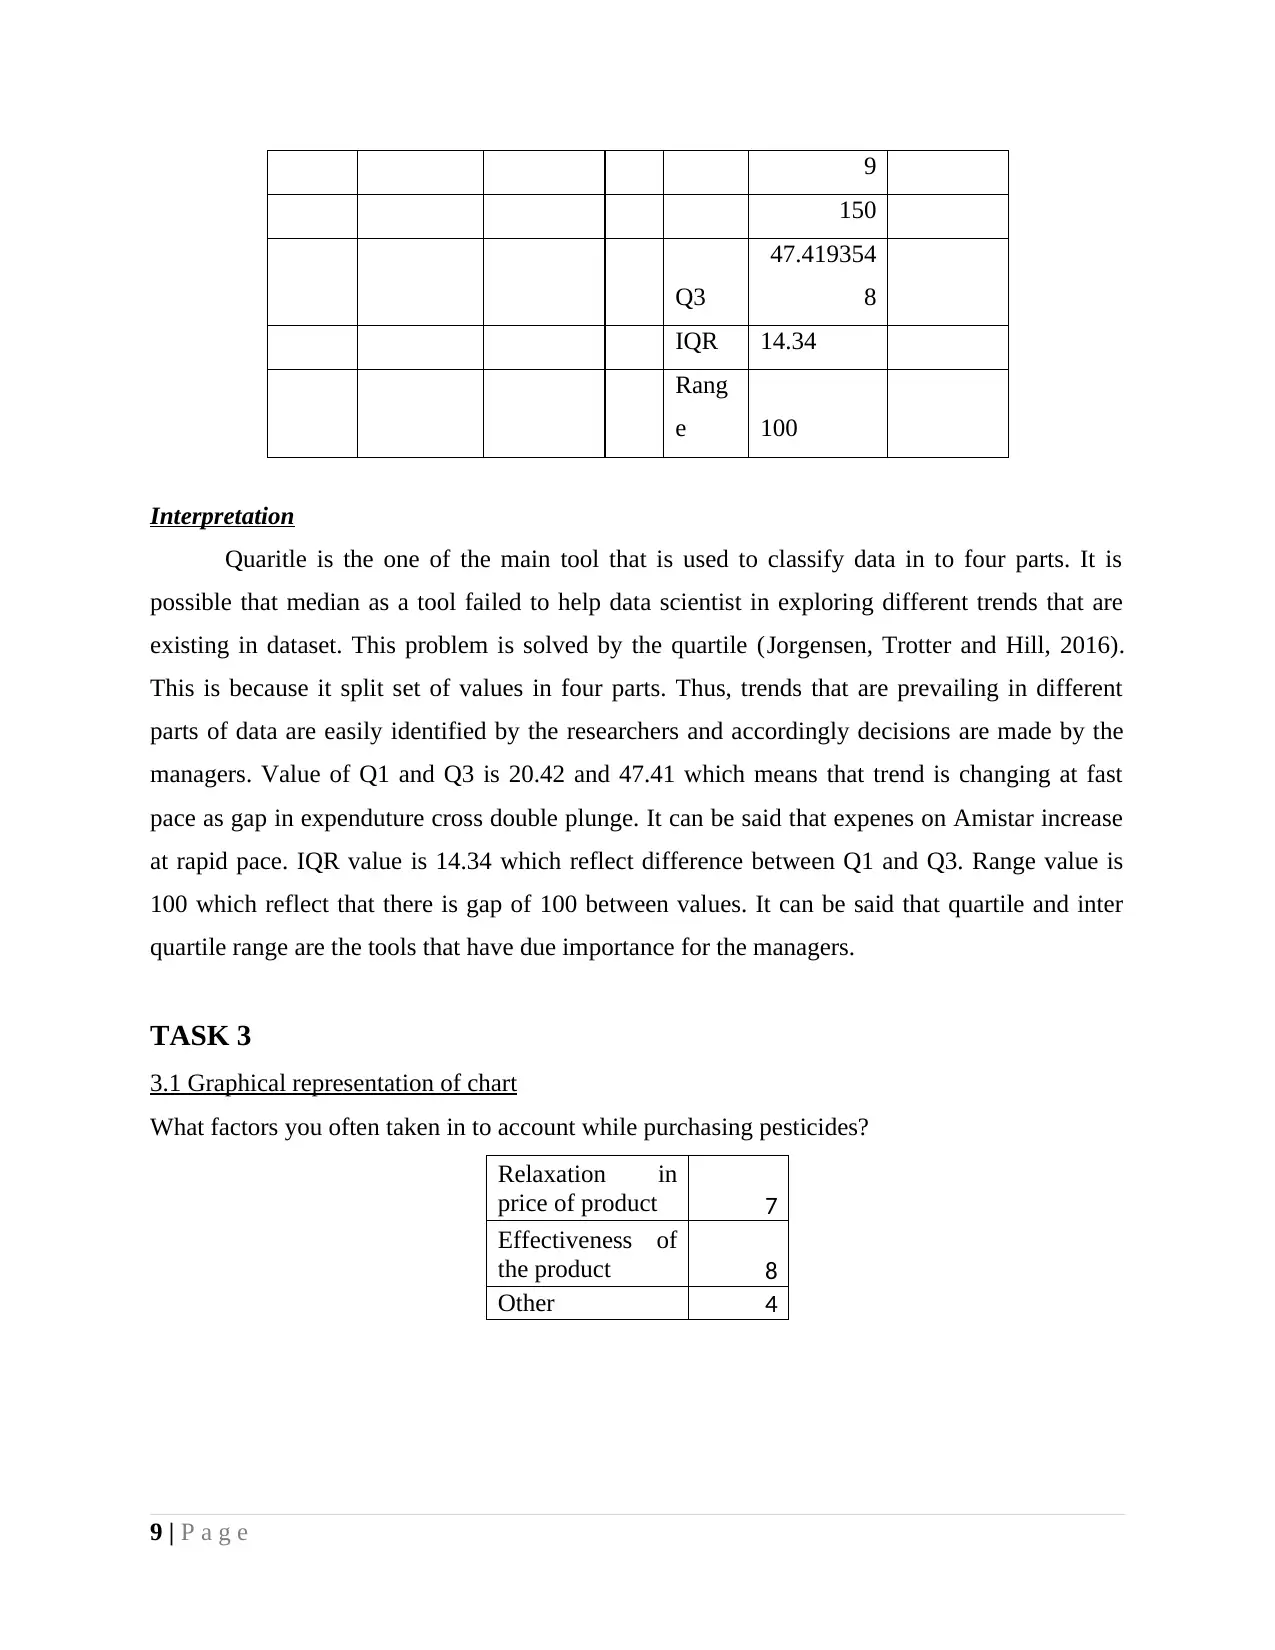
Interpretation
Quaritle is the one of the main tool that is used to classify data in to four parts. It is
possible that median as a tool failed to help data scientist in exploring different trends that are
existing in dataset. This problem is solved by the quartile (Jorgensen, Trotter and Hill, 2016).
This is because it split set of values in four parts. Thus, trends that are prevailing in different
parts of data are easily identified by the researchers and accordingly decisions are made by the
managers. Value of Q1 and Q3 is 20.42 and 47.41 which means that trend is changing at fast
pace as gap in expenduture cross double plunge. It can be said that expenes on Amistar increase
at rapid pace. IQR value is 14.34 which reflect difference between Q1 and Q3. Range value is
100 which reflect that there is gap of 100 between values. It can be said that quartile and inter
quartile range are the tools that have due importance for the managers.
TASK 3
3.1 Graphical representation of chart
What factors you often taken in to account while purchasing pesticides?
Relaxation in
price of product 7
Effectiveness of
the product 8
Other 4
9 | P a g e
150
Q3
47.419354
8
IQR 14.34
Rang
e 100
Interpretation
Quaritle is the one of the main tool that is used to classify data in to four parts. It is
possible that median as a tool failed to help data scientist in exploring different trends that are
existing in dataset. This problem is solved by the quartile (Jorgensen, Trotter and Hill, 2016).
This is because it split set of values in four parts. Thus, trends that are prevailing in different
parts of data are easily identified by the researchers and accordingly decisions are made by the
managers. Value of Q1 and Q3 is 20.42 and 47.41 which means that trend is changing at fast
pace as gap in expenduture cross double plunge. It can be said that expenes on Amistar increase
at rapid pace. IQR value is 14.34 which reflect difference between Q1 and Q3. Range value is
100 which reflect that there is gap of 100 between values. It can be said that quartile and inter
quartile range are the tools that have due importance for the managers.
TASK 3
3.1 Graphical representation of chart
What factors you often taken in to account while purchasing pesticides?
Relaxation in
price of product 7
Effectiveness of
the product 8
Other 4
9 | P a g e
Paraphrase This Document
Need a fresh take? Get an instant paraphrase of this document with our AI Paraphraser
7
8
4
Chart Title
Relaxation in price of product Effectiveness of the product
Other
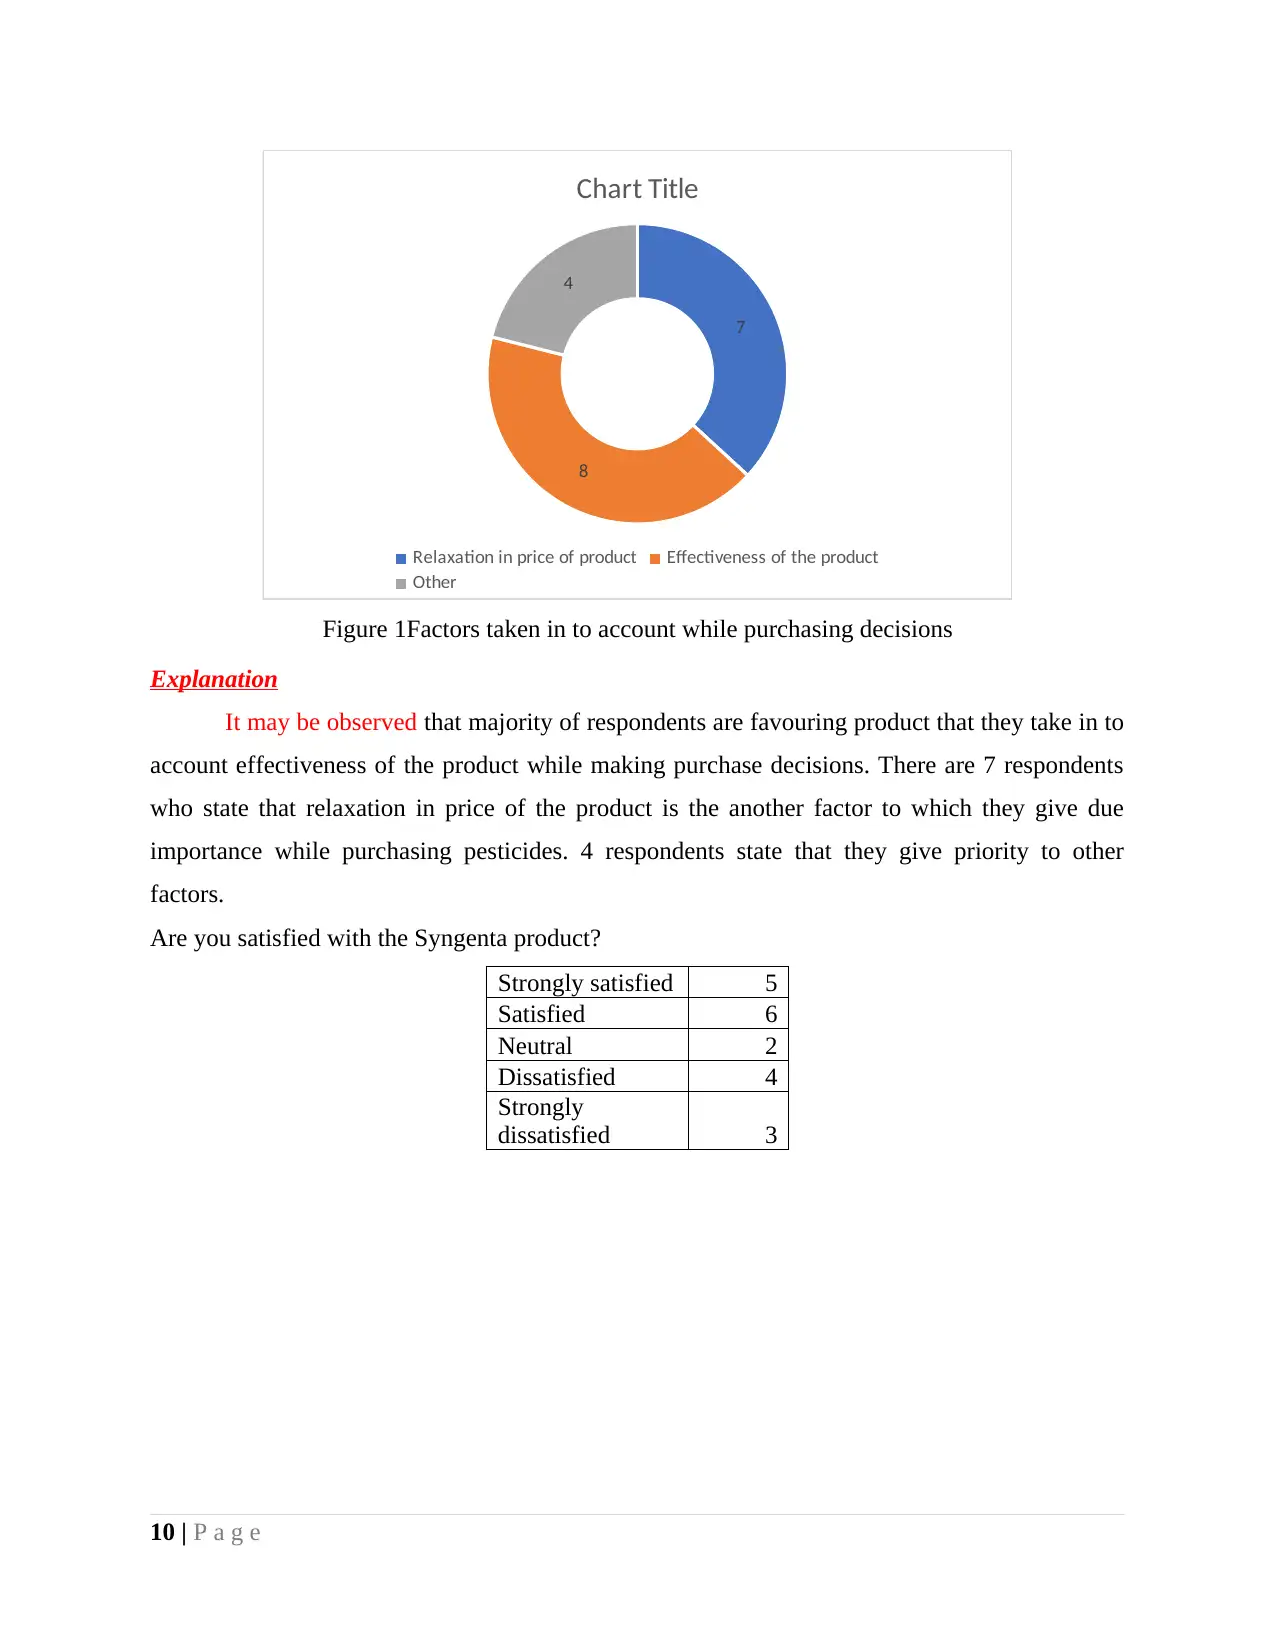
Figure 1Factors taken in to account while purchasing decisions
Explanation
It may be observed that majority of respondents are favouring product that they take in to
account effectiveness of the product while making purchase decisions. There are 7 respondents
who state that relaxation in price of the product is the another factor to which they give due
importance while purchasing pesticides. 4 respondents state that they give priority to other
factors.
Are you satisfied with the Syngenta product?
Strongly satisfied 5
Satisfied 6
Neutral 2
Dissatisfied 4
Strongly
dissatisfied 3
10 | P a g e
8
4
Chart Title
Relaxation in price of product Effectiveness of the product
Other
Figure 1Factors taken in to account while purchasing decisions
Explanation
It may be observed that majority of respondents are favouring product that they take in to
account effectiveness of the product while making purchase decisions. There are 7 respondents
who state that relaxation in price of the product is the another factor to which they give due
importance while purchasing pesticides. 4 respondents state that they give priority to other
factors.
Are you satisfied with the Syngenta product?
Strongly satisfied 5
Satisfied 6
Neutral 2
Dissatisfied 4
Strongly
dissatisfied 3
10 | P a g e
Strongly satisfied Satisfied Neutral Dissatisfied Strongly
dissatisfied
0
1
2
3
4
5
6
7
5
6
2
4
3
Chart Title
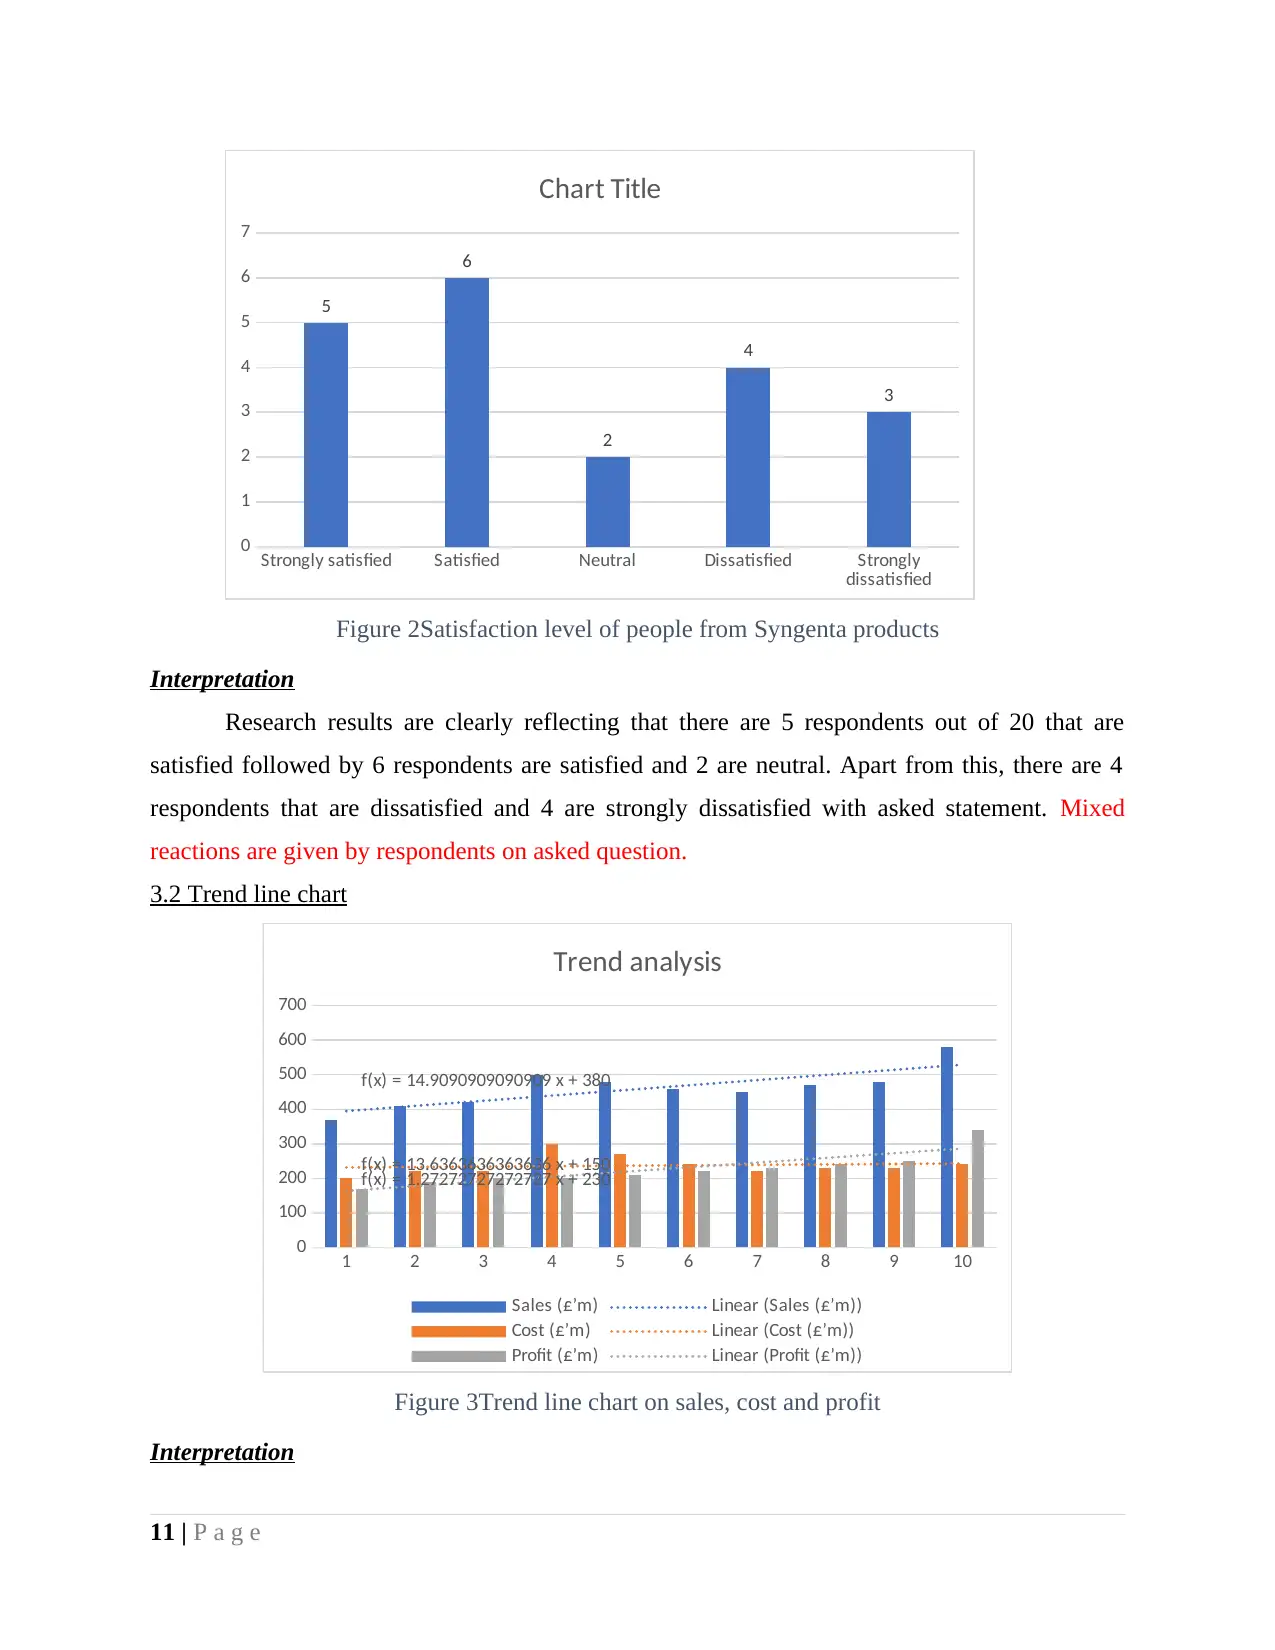
Figure 2Satisfaction level of people from Syngenta products
Interpretation
Research results are clearly reflecting that there are 5 respondents out of 20 that are
satisfied followed by 6 respondents are satisfied and 2 are neutral. Apart from this, there are 4
respondents that are dissatisfied and 4 are strongly dissatisfied with asked statement. Mixed
reactions are given by respondents on asked question.
3.2 Trend line chart
1 2 3 4 5 6 7 8 9 10
0
100
200
300
400
500
600
700
f(x) = 14.9090909090909 x + 380
f(x) = 1.27272727272727 x + 230
f(x) = 13.6363636363636 x + 150
Trend analysis
Sales (£’m) Linear (Sales (£’m))
Cost (£’m) Linear (Cost (£’m))
Profit (£’m) Linear (Profit (£’m))
Figure 3Trend line chart on sales, cost and profit
Interpretation
11 | P a g e
dissatisfied
0
1
2
3
4
5
6
7
5
6
2
4
3
Chart Title
Figure 2Satisfaction level of people from Syngenta products
Interpretation
Research results are clearly reflecting that there are 5 respondents out of 20 that are
satisfied followed by 6 respondents are satisfied and 2 are neutral. Apart from this, there are 4
respondents that are dissatisfied and 4 are strongly dissatisfied with asked statement. Mixed
reactions are given by respondents on asked question.
3.2 Trend line chart
1 2 3 4 5 6 7 8 9 10
0
100
200
300
400
500
600
700
f(x) = 14.9090909090909 x + 380
f(x) = 1.27272727272727 x + 230
f(x) = 13.6363636363636 x + 150
Trend analysis
Sales (£’m) Linear (Sales (£’m))
Cost (£’m) Linear (Cost (£’m))
Profit (£’m) Linear (Profit (£’m))
Figure 3Trend line chart on sales, cost and profit
Interpretation
11 | P a g e
⊘ This is a preview!⊘
Do you want full access?
Subscribe today to unlock all pages.
Trusted by 1+ million students worldwide
1 out of 18
Related Documents


Your All-in-One AI-Powered Toolkit for Academic Success.
+13062052269
info@desklib.com
Available 24*7 on WhatsApp / Email
![[object Object]](/_next/static/media/star-bottom.7253800d.svg)
Unlock your academic potential
Copyright © 2020–2026 A2Z Services. All Rights Reserved. Developed and managed by ZUCOL.