ICT103 Assignment 2: System Analysis and Design UML Diagrams Report
VerifiedAdded on  2023/04/25
|13
|1415
|427
Report
AI Summary
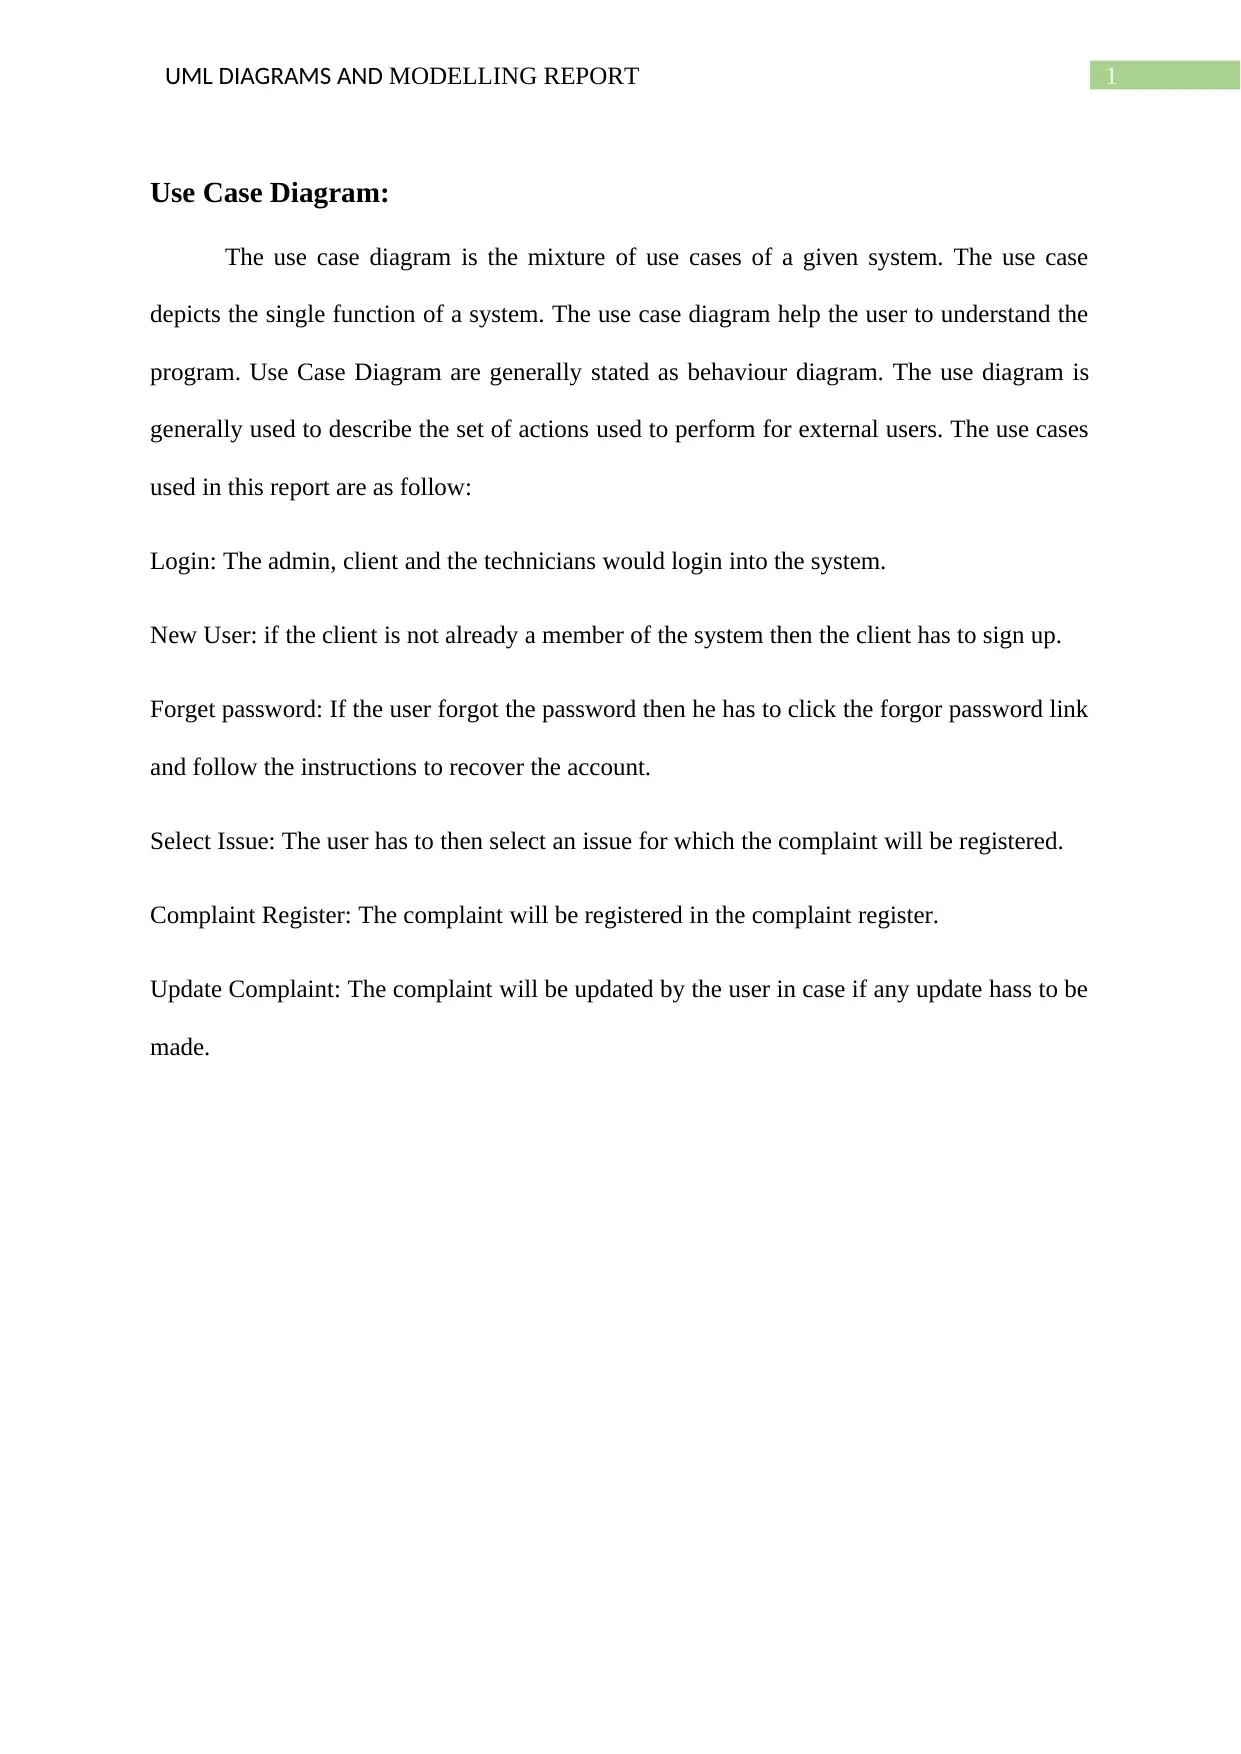
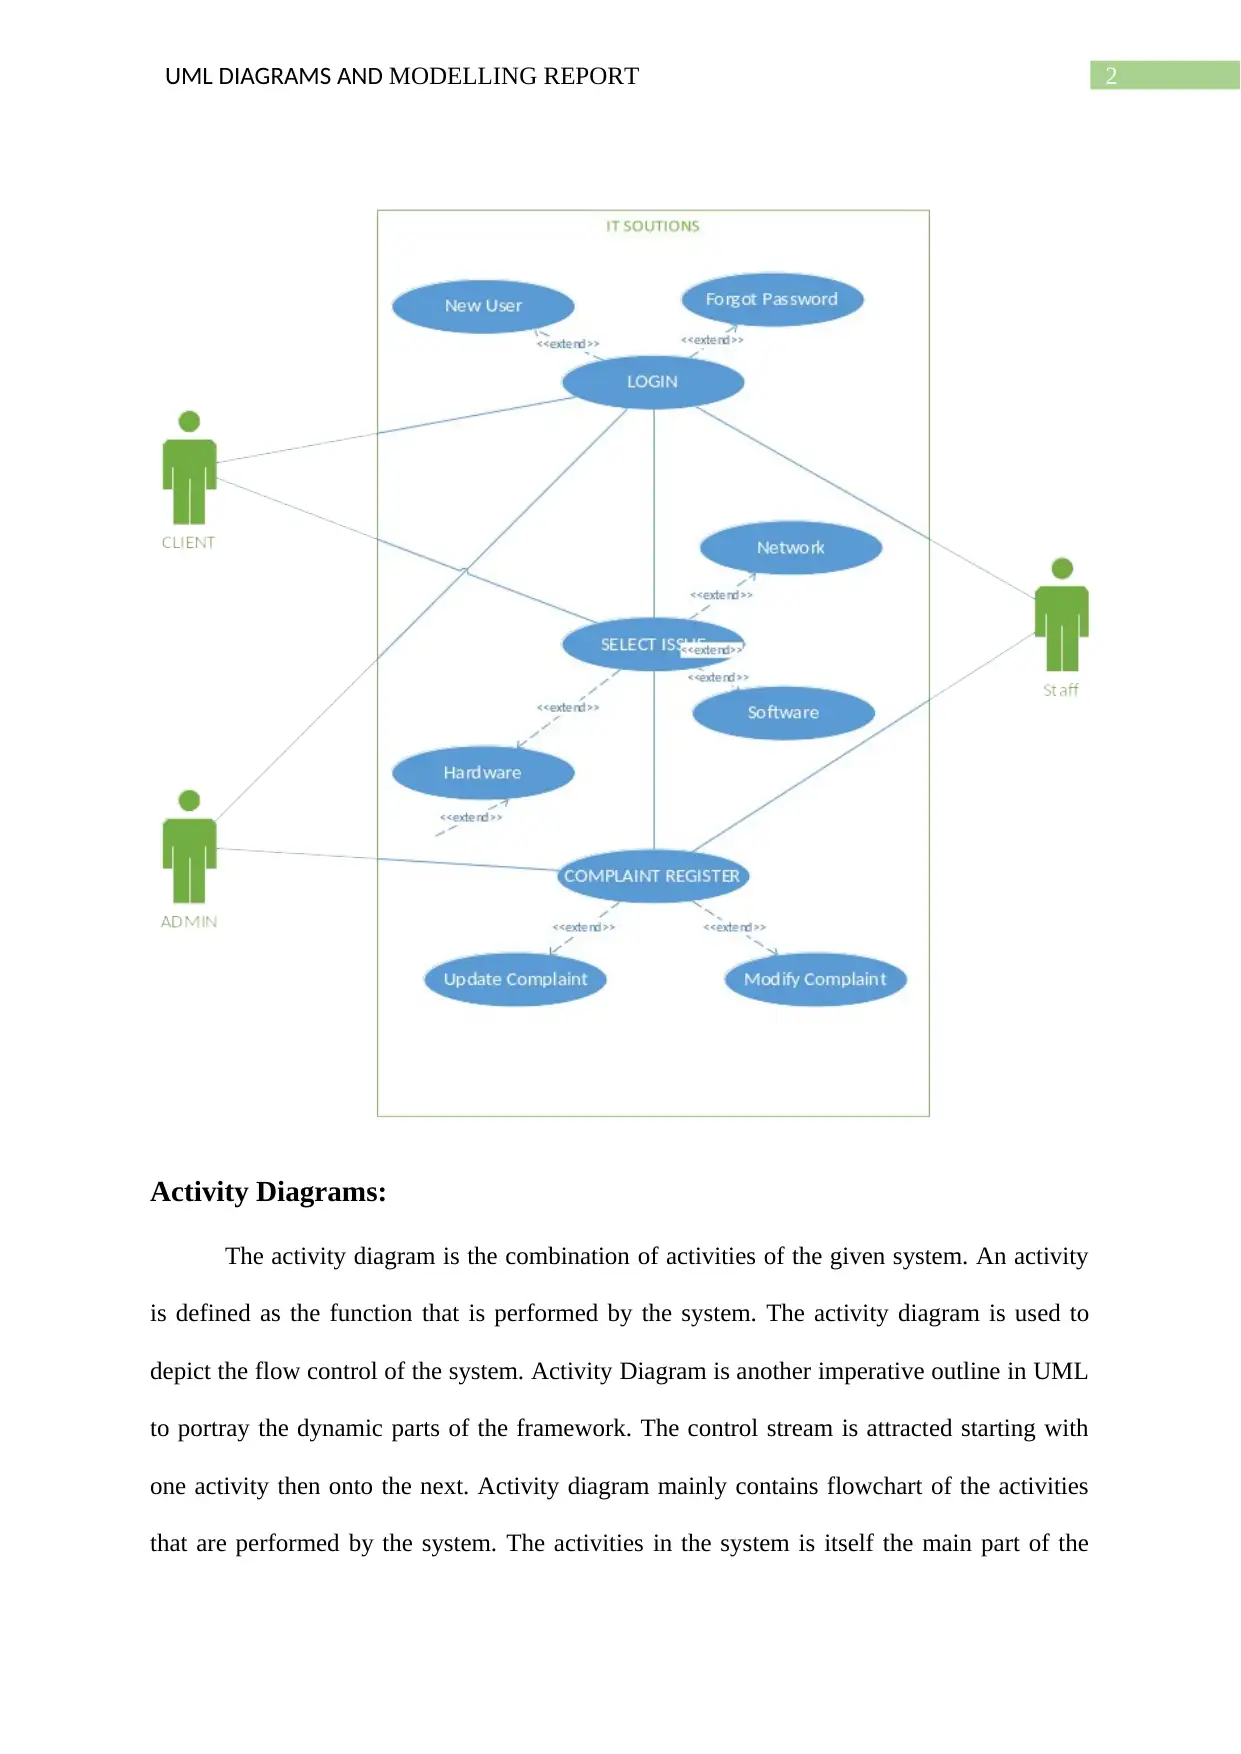
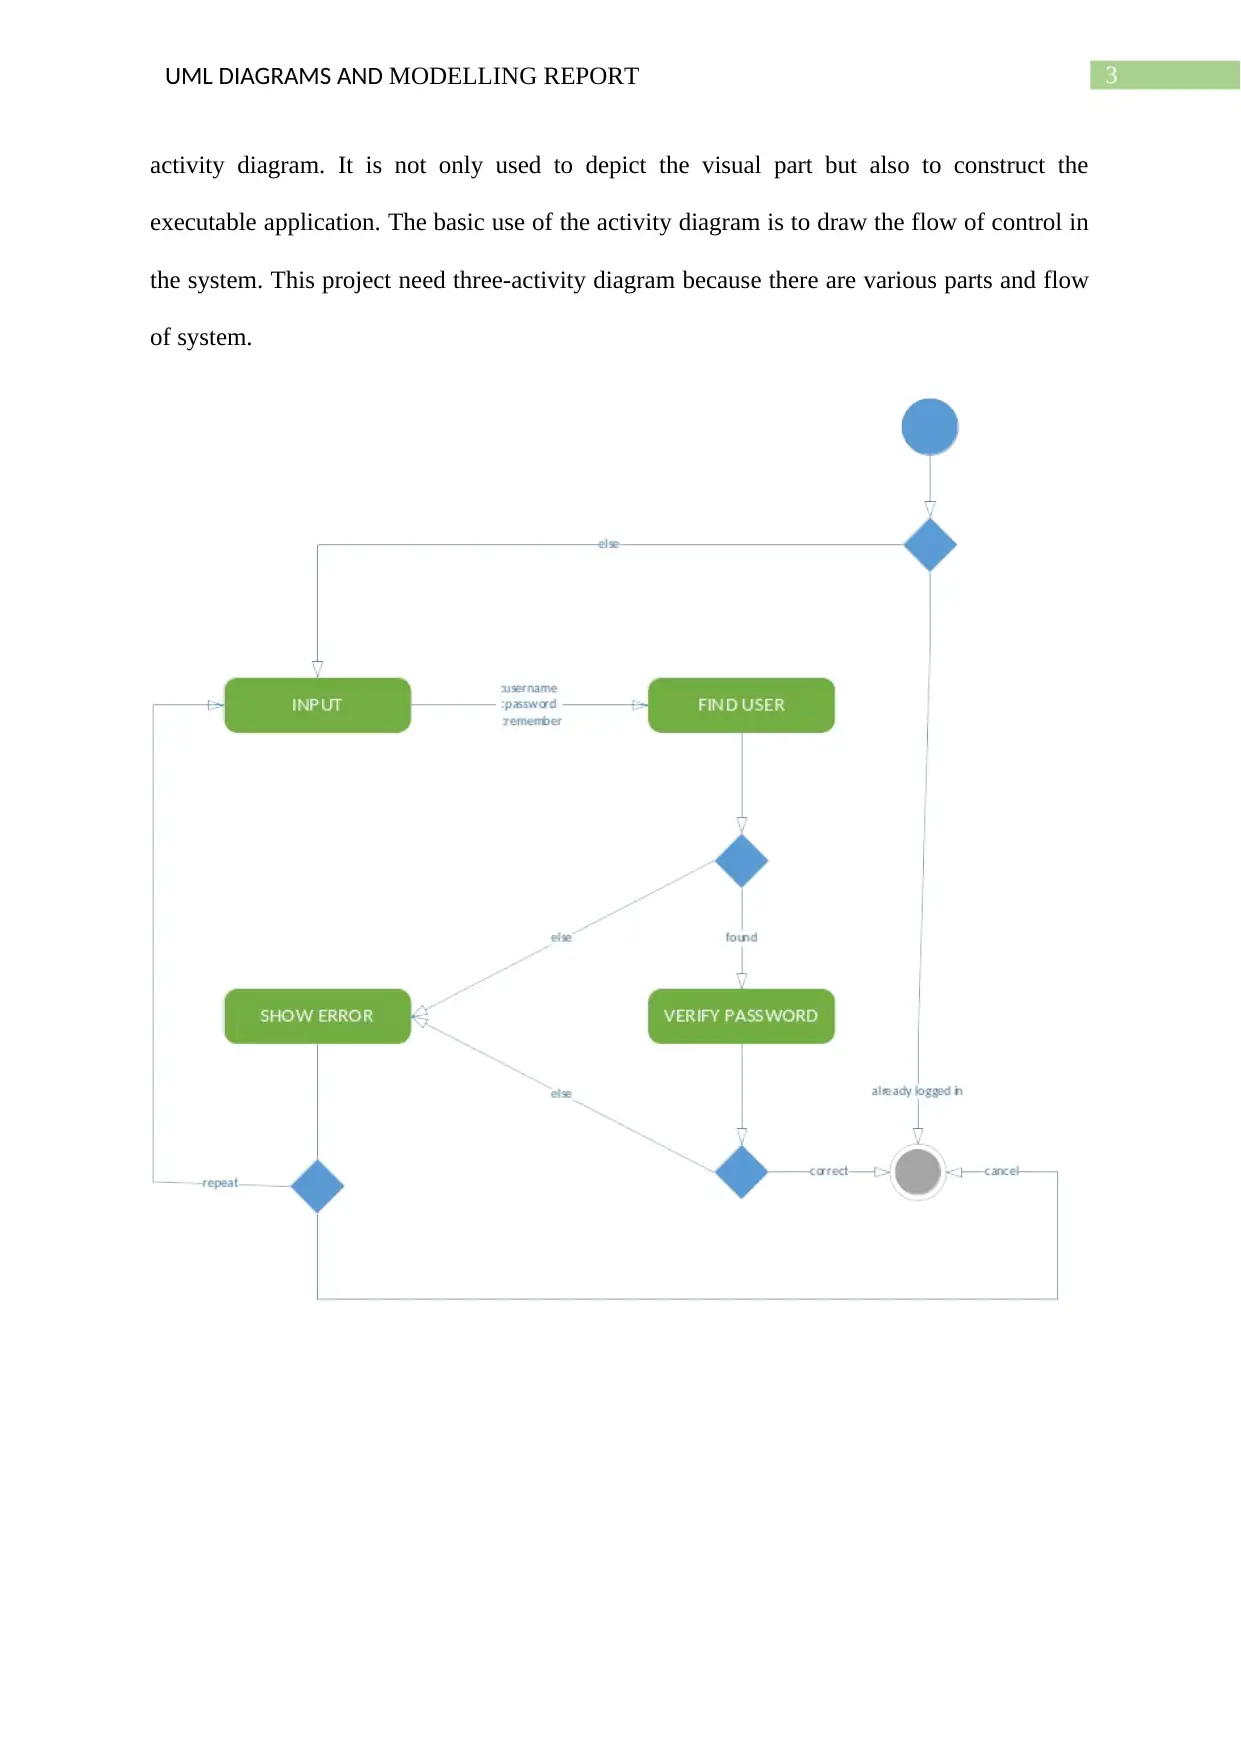
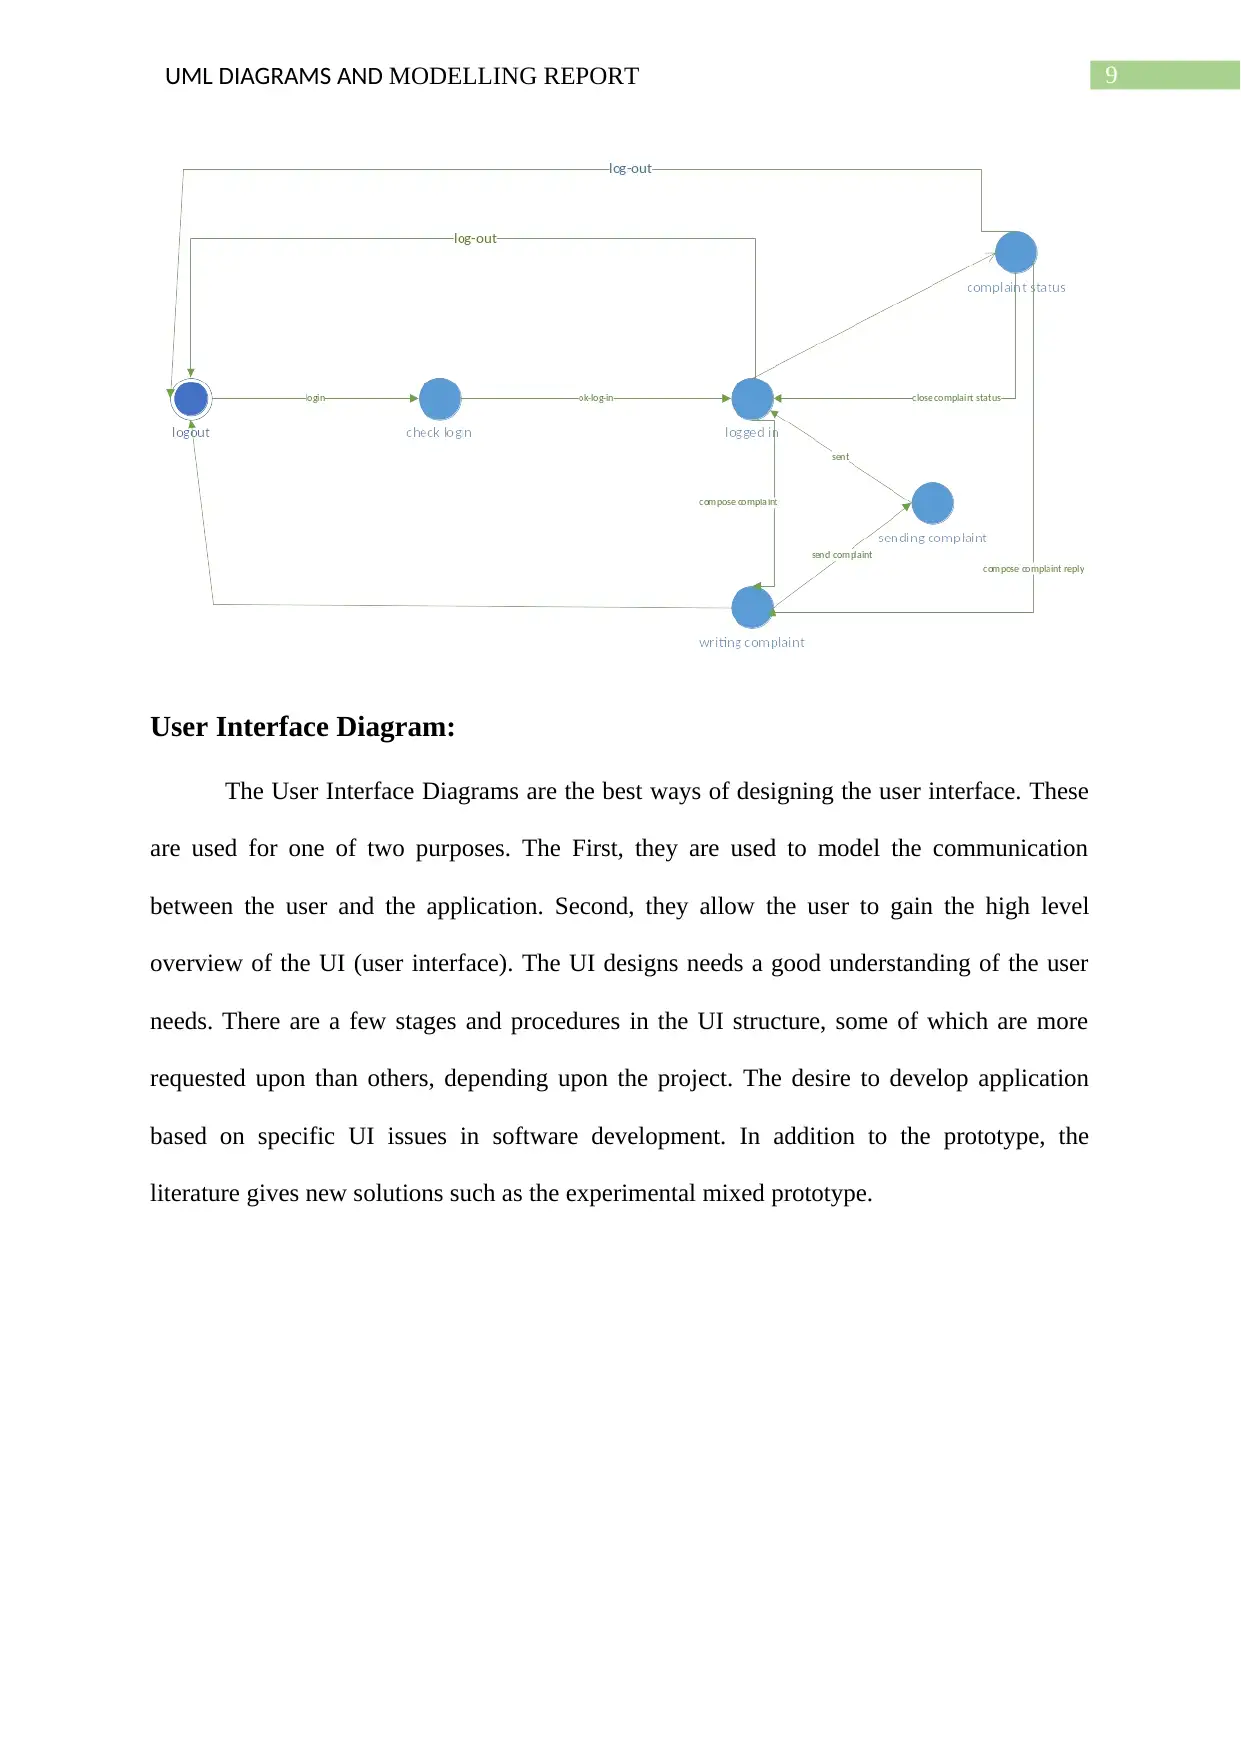
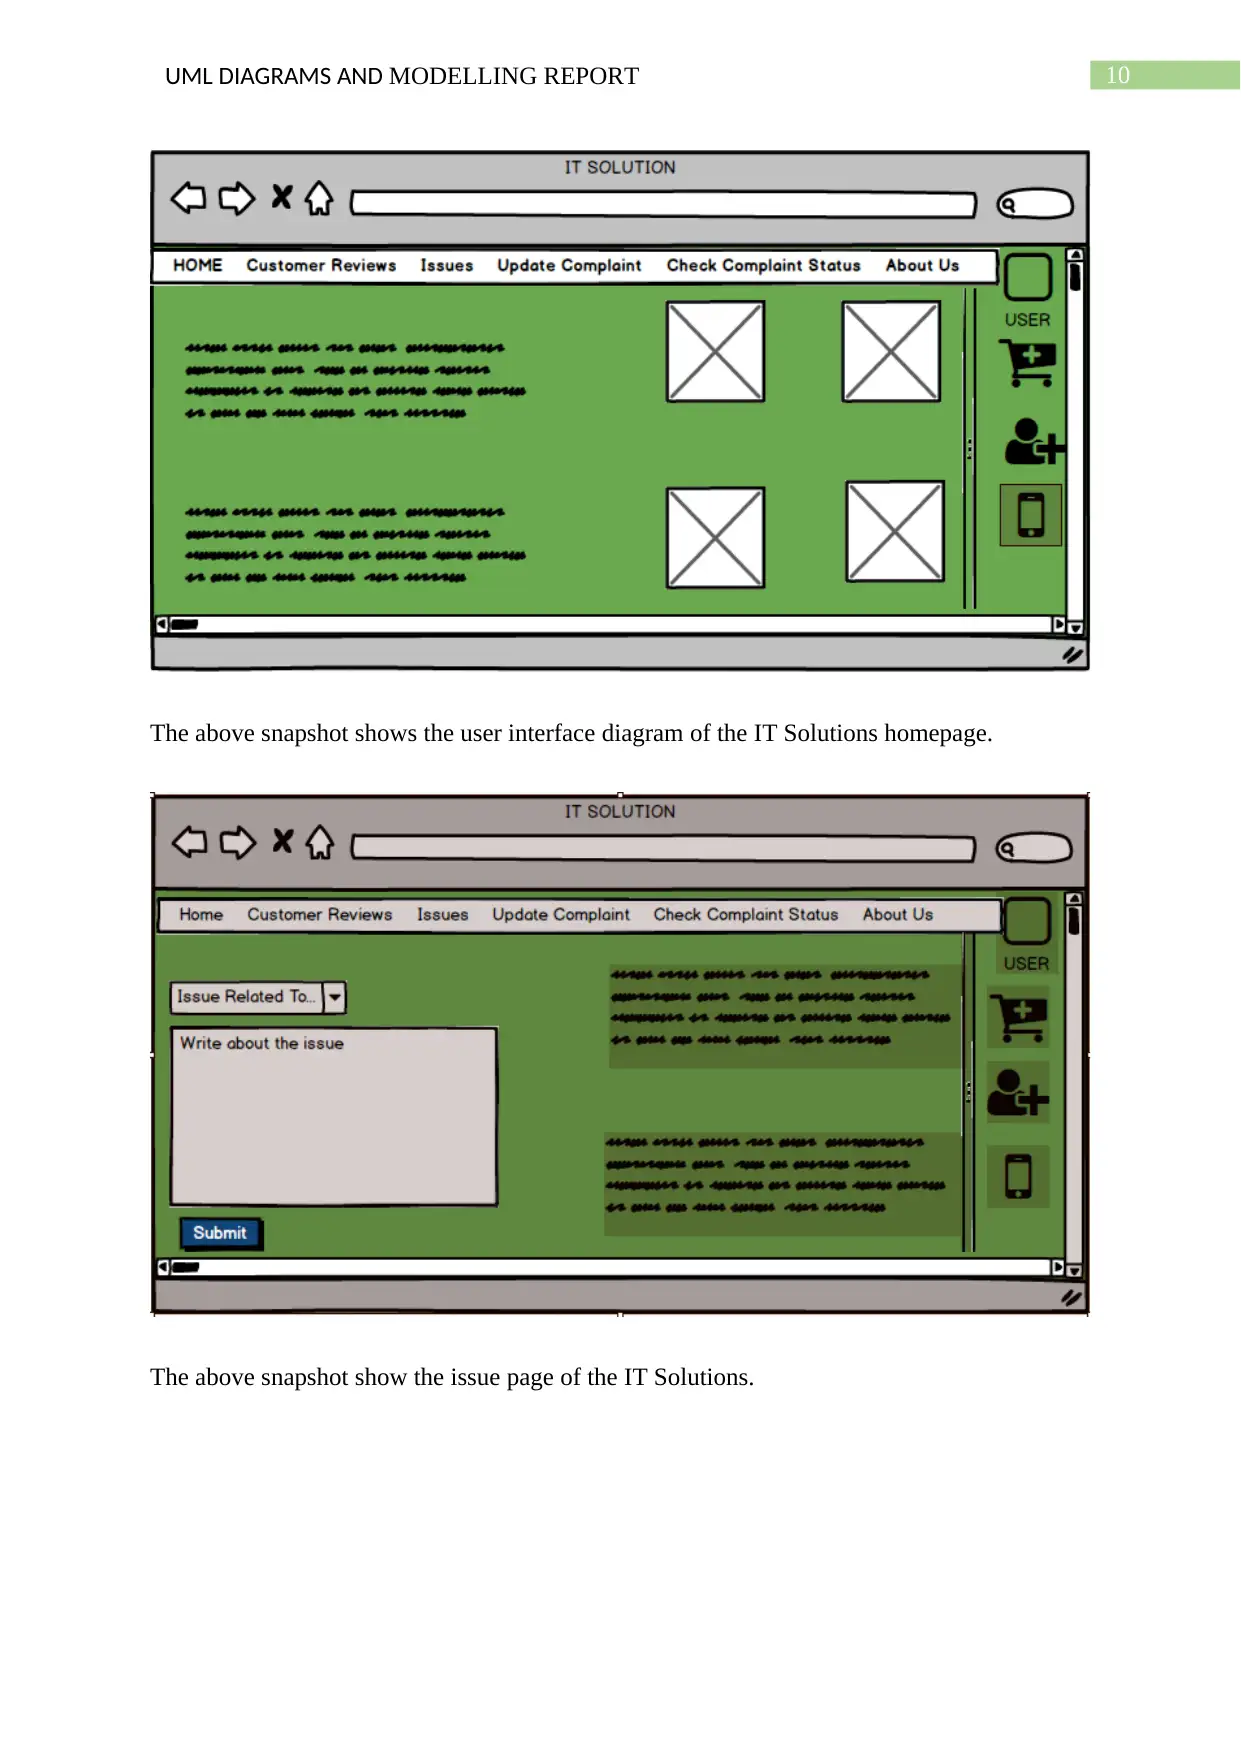
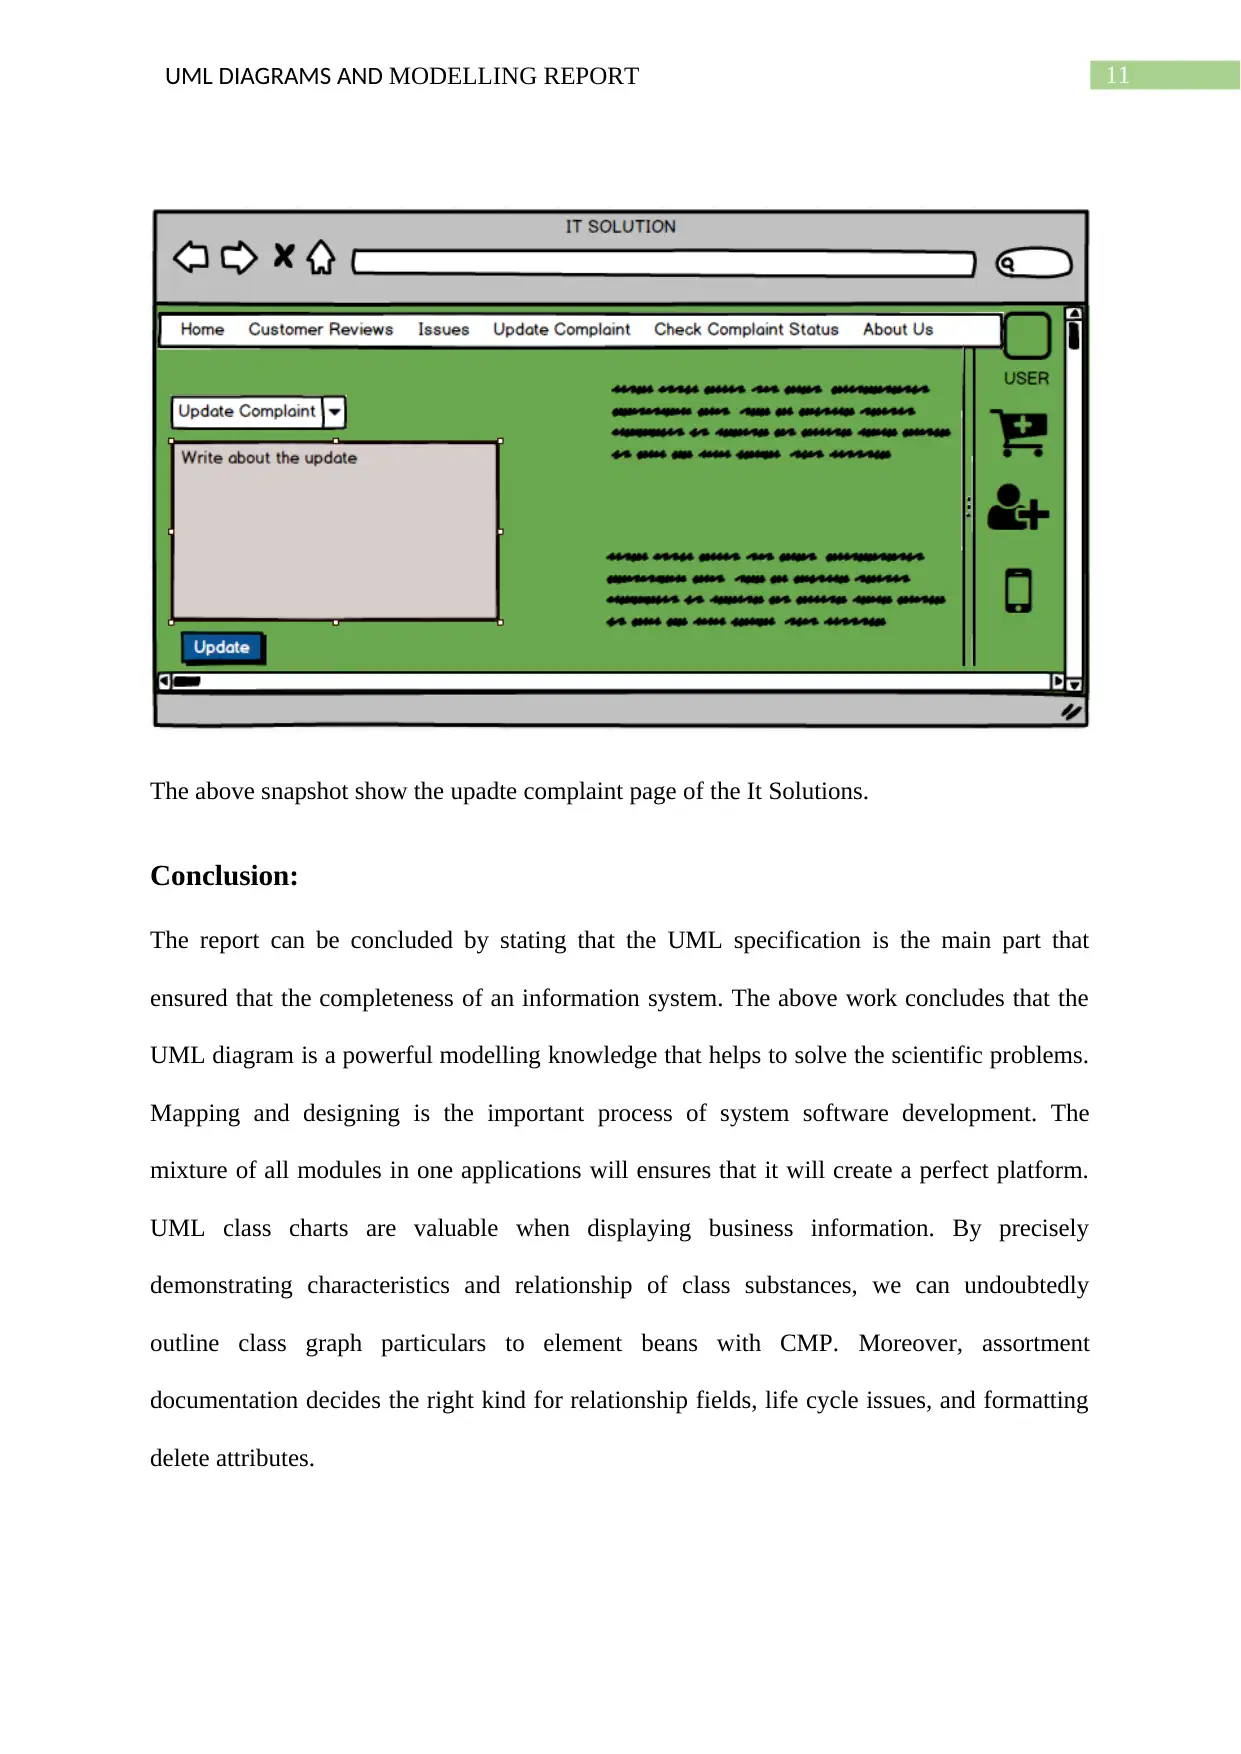
This report presents a detailed analysis of system analysis and design using UML diagrams. It begins with an overview of the IT Solutions case study, which involves an IT service provider seeking to improve its client service request system. The report then provides a comprehensive breakdown of various UML diagrams, including use case diagrams that describe system functionalities from a user's perspective (login, new user, etc.). Activity diagrams illustrating the workflow of the system, and sequence diagrams that show the interactions between different objects. Furthermore, the report includes domain class diagrams to represent the program's structure, state machine diagrams that depict the state transitions of the system and user interface diagrams that visualize the design of the user interface. The report concludes by summarizing the importance of UML specifications in ensuring the completeness of information systems and highlights the value of UML diagrams in solving scientific problems and designing software systems. The bibliography provides a list of references used in the report.

Running head: UML DIAGRAMS AND MODELLING REPORT
UML Diagrams and Modelling Report
Name of the Student
Name of the University
Author Note
UML Diagrams and Modelling Report
Name of the Student
Name of the University
Author Note
Paraphrase This Document
Need a fresh take? Get an instant paraphrase of this document with our AI Paraphraser

1UML DIAGRAMS AND MODELLING REPORT
Use Case Diagram:
The use case diagram is the mixture of use cases of a given system. The use case
depicts the single function of a system. The use case diagram help the user to understand the
program. Use Case Diagram are generally stated as behaviour diagram. The use diagram is
generally used to describe the set of actions used to perform for external users. The use cases
used in this report are as follow:
Login: The admin, client and the technicians would login into the system.
New User: if the client is not already a member of the system then the client has to sign up.
Forget password: If the user forgot the password then he has to click the forgor password link
and follow the instructions to recover the account.
Select Issue: The user has to then select an issue for which the complaint will be registered.
Complaint Register: The complaint will be registered in the complaint register.
Update Complaint: The complaint will be updated by the user in case if any update hass to be
made.

2UML DIAGRAMS AND MODELLING REPORT
Activity Diagrams:
The activity diagram is the combination of activities of the given system. An activity
is defined as the function that is performed by the system. The activity diagram is used to
depict the flow control of the system. Activity Diagram is another imperative outline in UML
to portray the dynamic parts of the framework. The control stream is attracted starting with
one activity then onto the next. Activity diagram mainly contains flowchart of the activities
that are performed by the system. The activities in the system is itself the main part of the
⊘ This is a preview!⊘
Do you want full access?
Subscribe today to unlock all pages.

Trusted by 1+ million students worldwide

3UML DIAGRAMS AND MODELLING REPORT
activity diagram. It is not only used to depict the visual part but also to construct the
executable application. The basic use of the activity diagram is to draw the flow of control in
the system. This project need three-activity diagram because there are various parts and flow
of system.
activity diagram. It is not only used to depict the visual part but also to construct the
executable application. The basic use of the activity diagram is to draw the flow of control in
the system. This project need three-activity diagram because there are various parts and flow
of system.
Paraphrase This Document
Need a fresh take? Get an instant paraphrase of this document with our AI Paraphraser

4UML DIAGRAMS AND MODELLING REPORT

5UML DIAGRAMS AND MODELLING REPORT
Sequence Diagram:
A communication diagram describes how they operates with each other and in what
order. The parallel vertical lines (lifelines) describes various processes are performed
simultaneously and as horizontally arrow, show the message communication between the
orders they occur in. The sequence diagram in simple draws the communication flow
between the objects in sequential order. The actors in the sequence diagrams represent the
user. The Lifeline represent individual participant in the sequence diagram. The sequence
diagram is primarily used to show the communication between the object and the use cases.
The sequence diagram is used to show details of the use case diagram. The sequence diagram
⊘ This is a preview!⊘
Do you want full access?
Subscribe today to unlock all pages.

Trusted by 1+ million students worldwide

6UML DIAGRAMS AND MODELLING REPORT
are also used to understand the full functionality of the future application. The sending and
receiving the messages is known as Communication.
are also used to understand the full functionality of the future application. The sending and
receiving the messages is known as Communication.
Paraphrase This Document
Need a fresh take? Get an instant paraphrase of this document with our AI Paraphraser

7UML DIAGRAMS AND MODELLING REPORT
Domain Class Diagram:
The domain class diagram is the static diagram, which is used to represent the image
of the program. The domain class diagram can also be used for creating the executable code
of the of except for the visualization, description and documentation of the software. The
class diagram is also known as structural diagram. The main use of the structural diagram is
to depict the static view of the application. The class diagram is used to provide an overview
of the desired application by depicting the objects and classes that are present inside the
system. The class diagram provide different usage, like modelling the system and detailed
design of the desired application.

8UML DIAGRAMS AND MODELLING REPORT
State Machine Diagram:
The state machine diagram is also known as the State Chart Diagram. It depicts the
flow of control from one state to the other state. The state is defined as the change of
condition of an object from its creation until the termination. The chart diagram is similar to
the activity diagram of the system. The state machine diagram show the possible transition of
a system in various states. The state machine diagram is the behaviour diagram that depicts
the behaviour of the desired system through limited state transformations.
⊘ This is a preview!⊘
Do you want full access?
Subscribe today to unlock all pages.

Trusted by 1+ million students worldwide

9UML DIAGRAMS AND MODELLING REPORT
User Interface Diagram:
The User Interface Diagrams are the best ways of designing the user interface. These
are used for one of two purposes. The First, they are used to model the communication
between the user and the application. Second, they allow the user to gain the high level
overview of the UI (user interface). The UI designs needs a good understanding of the user
needs. There are a few stages and procedures in the UI structure, some of which are more
requested upon than others, depending upon the project. The desire to develop application
based on specific UI issues in software development. In addition to the prototype, the
literature gives new solutions such as the experimental mixed prototype.
Paraphrase This Document
Need a fresh take? Get an instant paraphrase of this document with our AI Paraphraser

10UML DIAGRAMS AND MODELLING REPORT
The above snapshot shows the user interface diagram of the IT Solutions homepage.
The above snapshot show the issue page of the IT Solutions.
The above snapshot shows the user interface diagram of the IT Solutions homepage.
The above snapshot show the issue page of the IT Solutions.

11UML DIAGRAMS AND MODELLING REPORT
The above snapshot show the upadte complaint page of the It Solutions.
Conclusion:
The report can be concluded by stating that the UML specification is the main part that
ensured that the completeness of an information system. The above work concludes that the
UML diagram is a powerful modelling knowledge that helps to solve the scientific problems.
Mapping and designing is the important process of system software development. The
mixture of all modules in one applications will ensures that it will create a perfect platform.
UML class charts are valuable when displaying business information. By precisely
demonstrating characteristics and relationship of class substances, we can undoubtedly
outline class graph particulars to element beans with CMP. Moreover, assortment
documentation decides the right kind for relationship fields, life cycle issues, and formatting
delete attributes.
⊘ This is a preview!⊘
Do you want full access?
Subscribe today to unlock all pages.

Trusted by 1+ million students worldwide
1 out of 13
Related Documents

Your All-in-One AI-Powered Toolkit for Academic Success.
 +13062052269
info@desklib.com
Available 24*7 on WhatsApp / Email
Unlock your academic potential
Copyright © 2020–2025 A2Z Services. All Rights Reserved. Developed and managed by ZUCOL.