Solved System Identification and Adaptive Control Assignment
VerifiedAdded on 2023/04/20
|9
|1689
|480
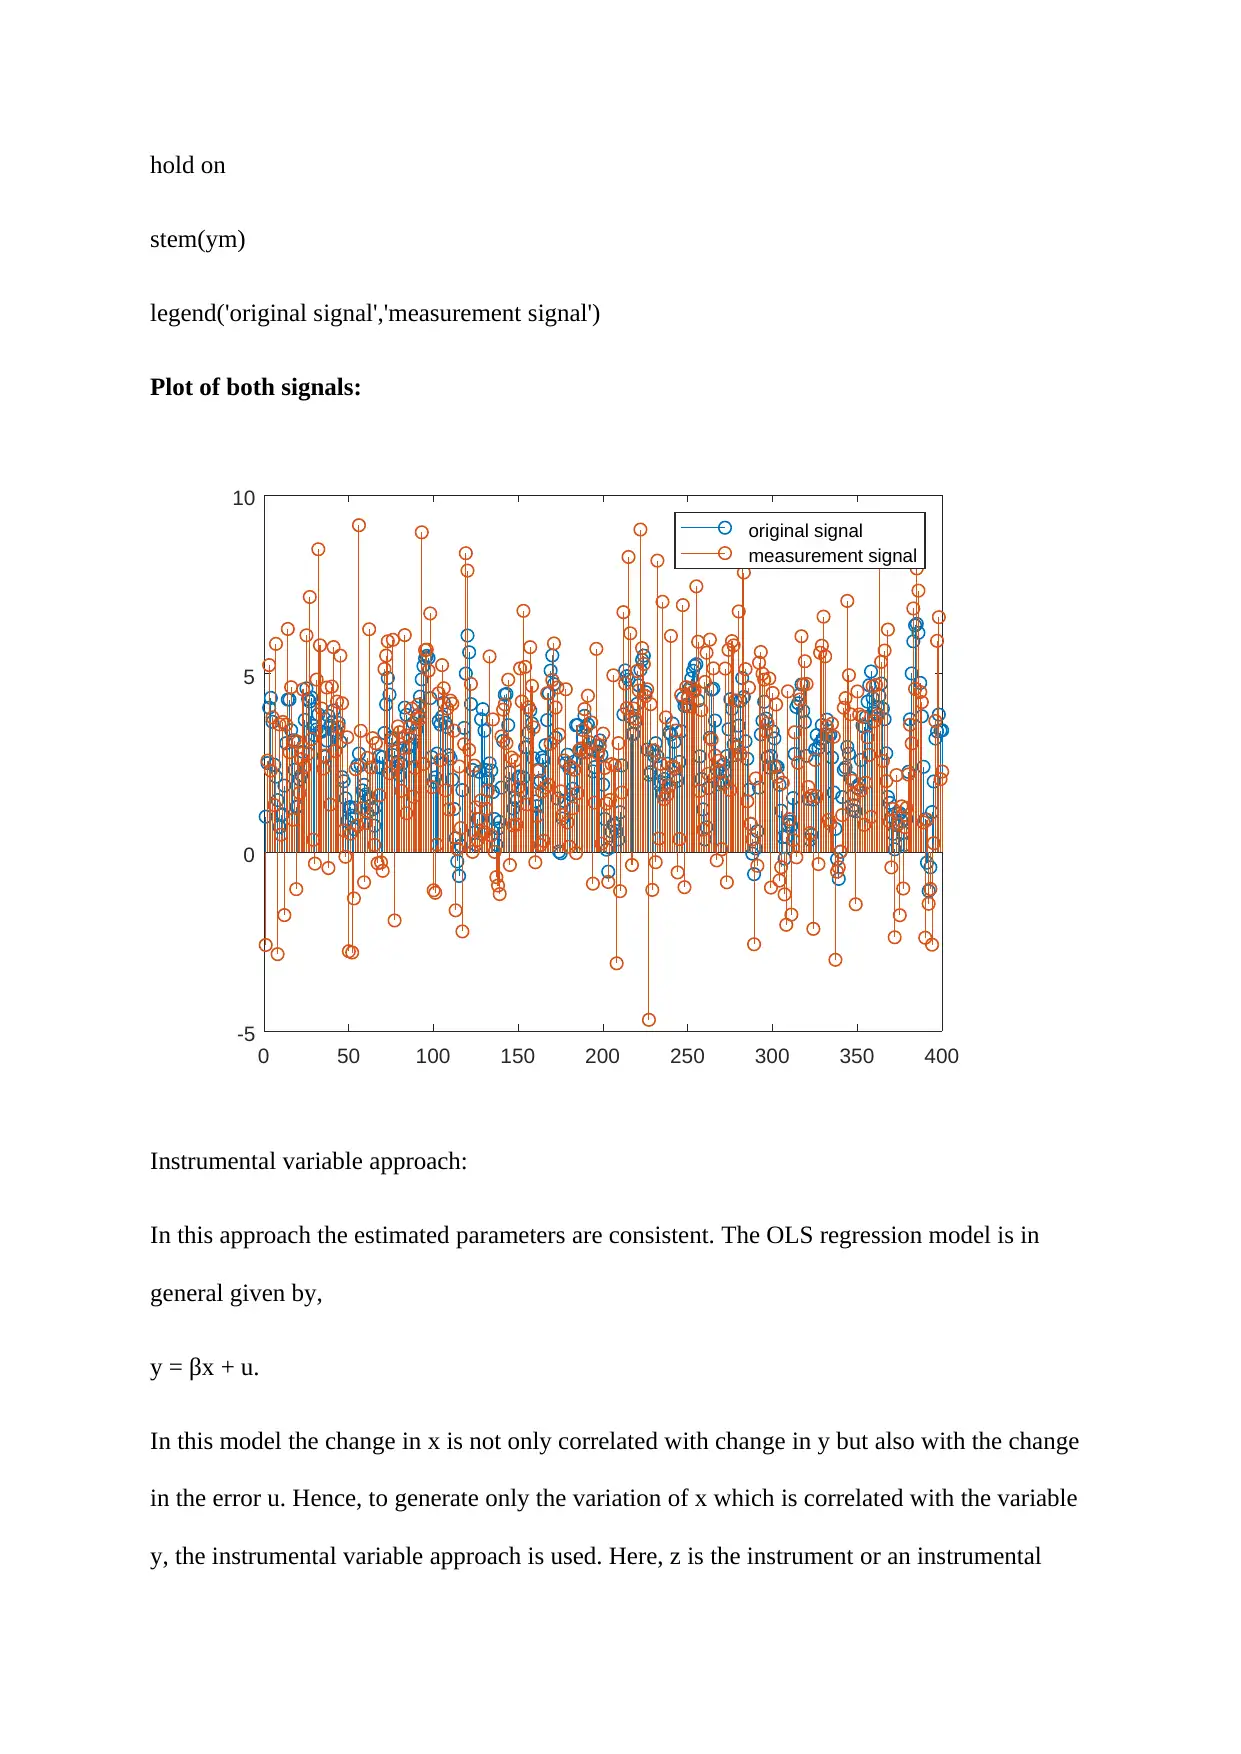
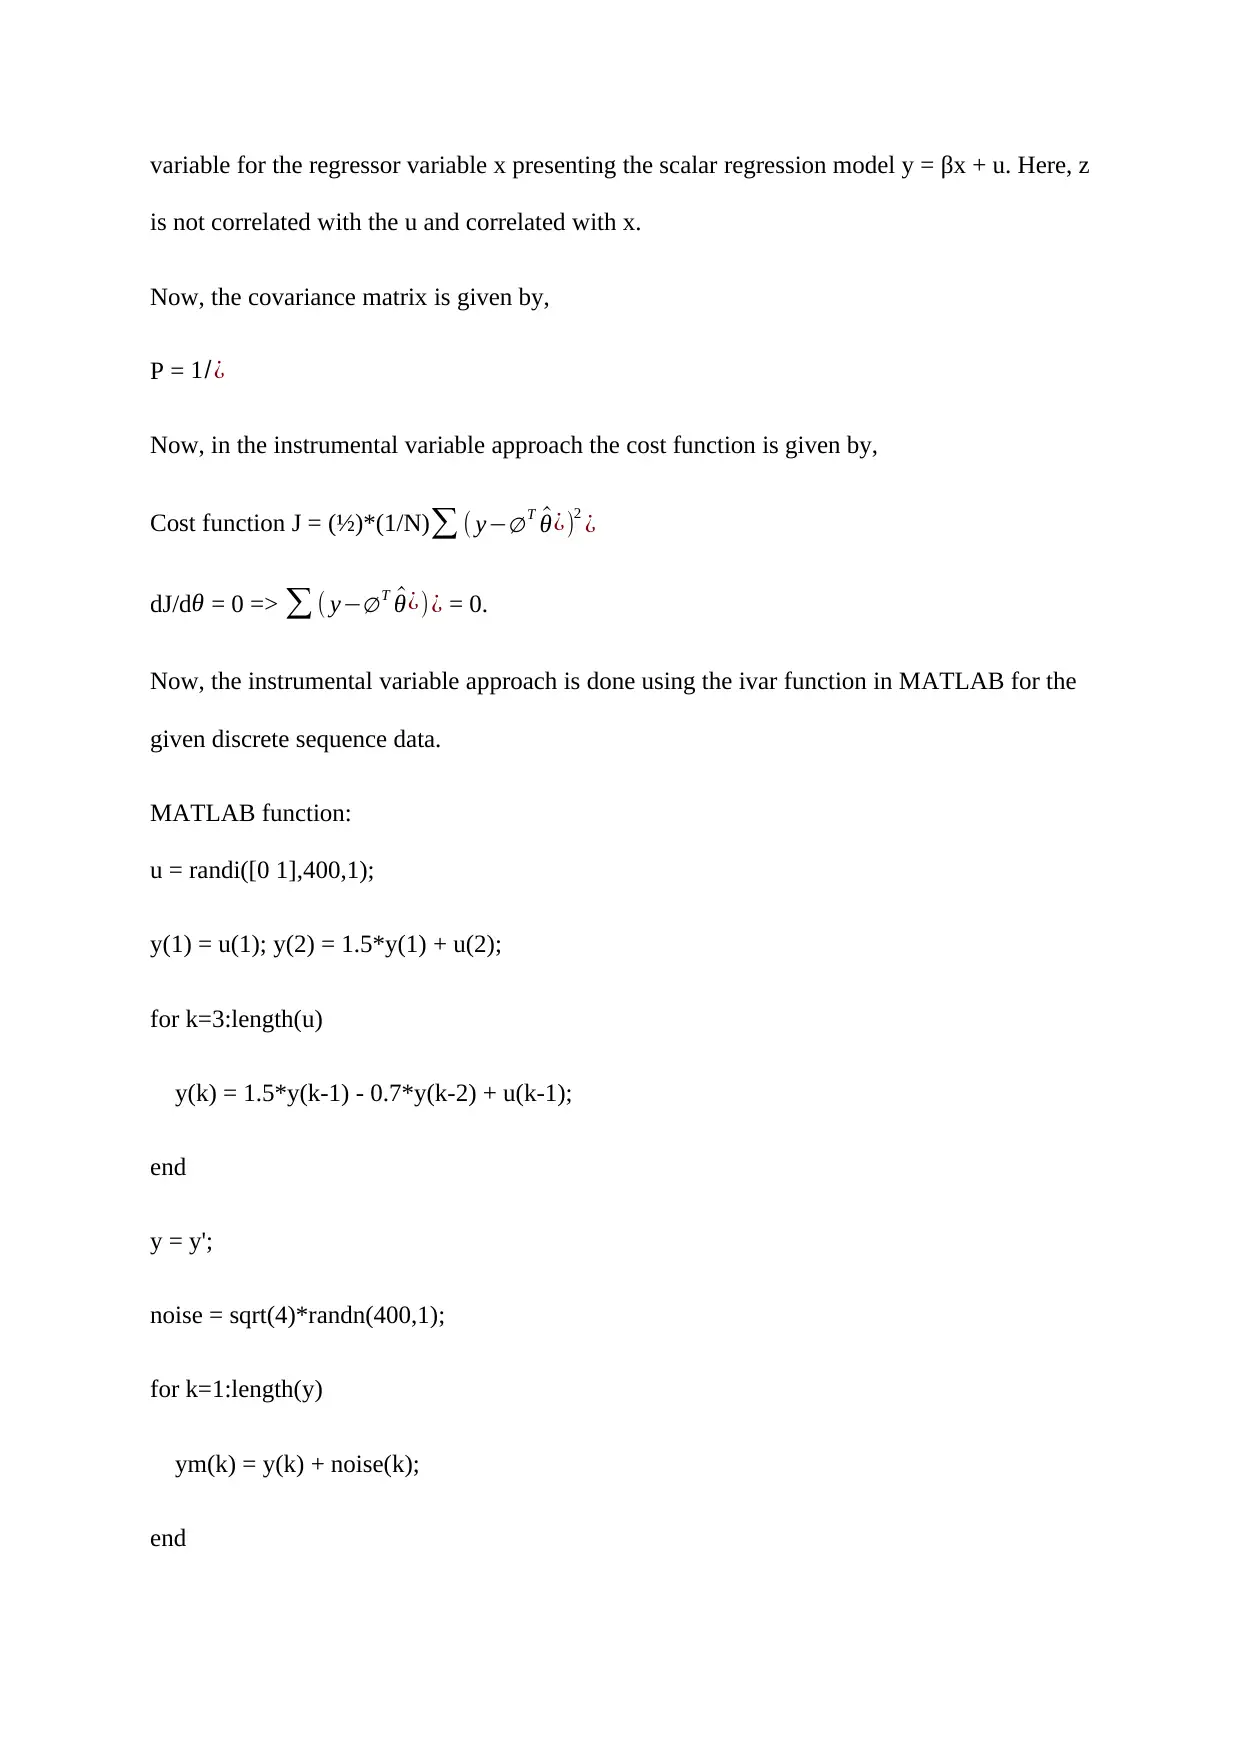
Homework Assignment
AI Summary
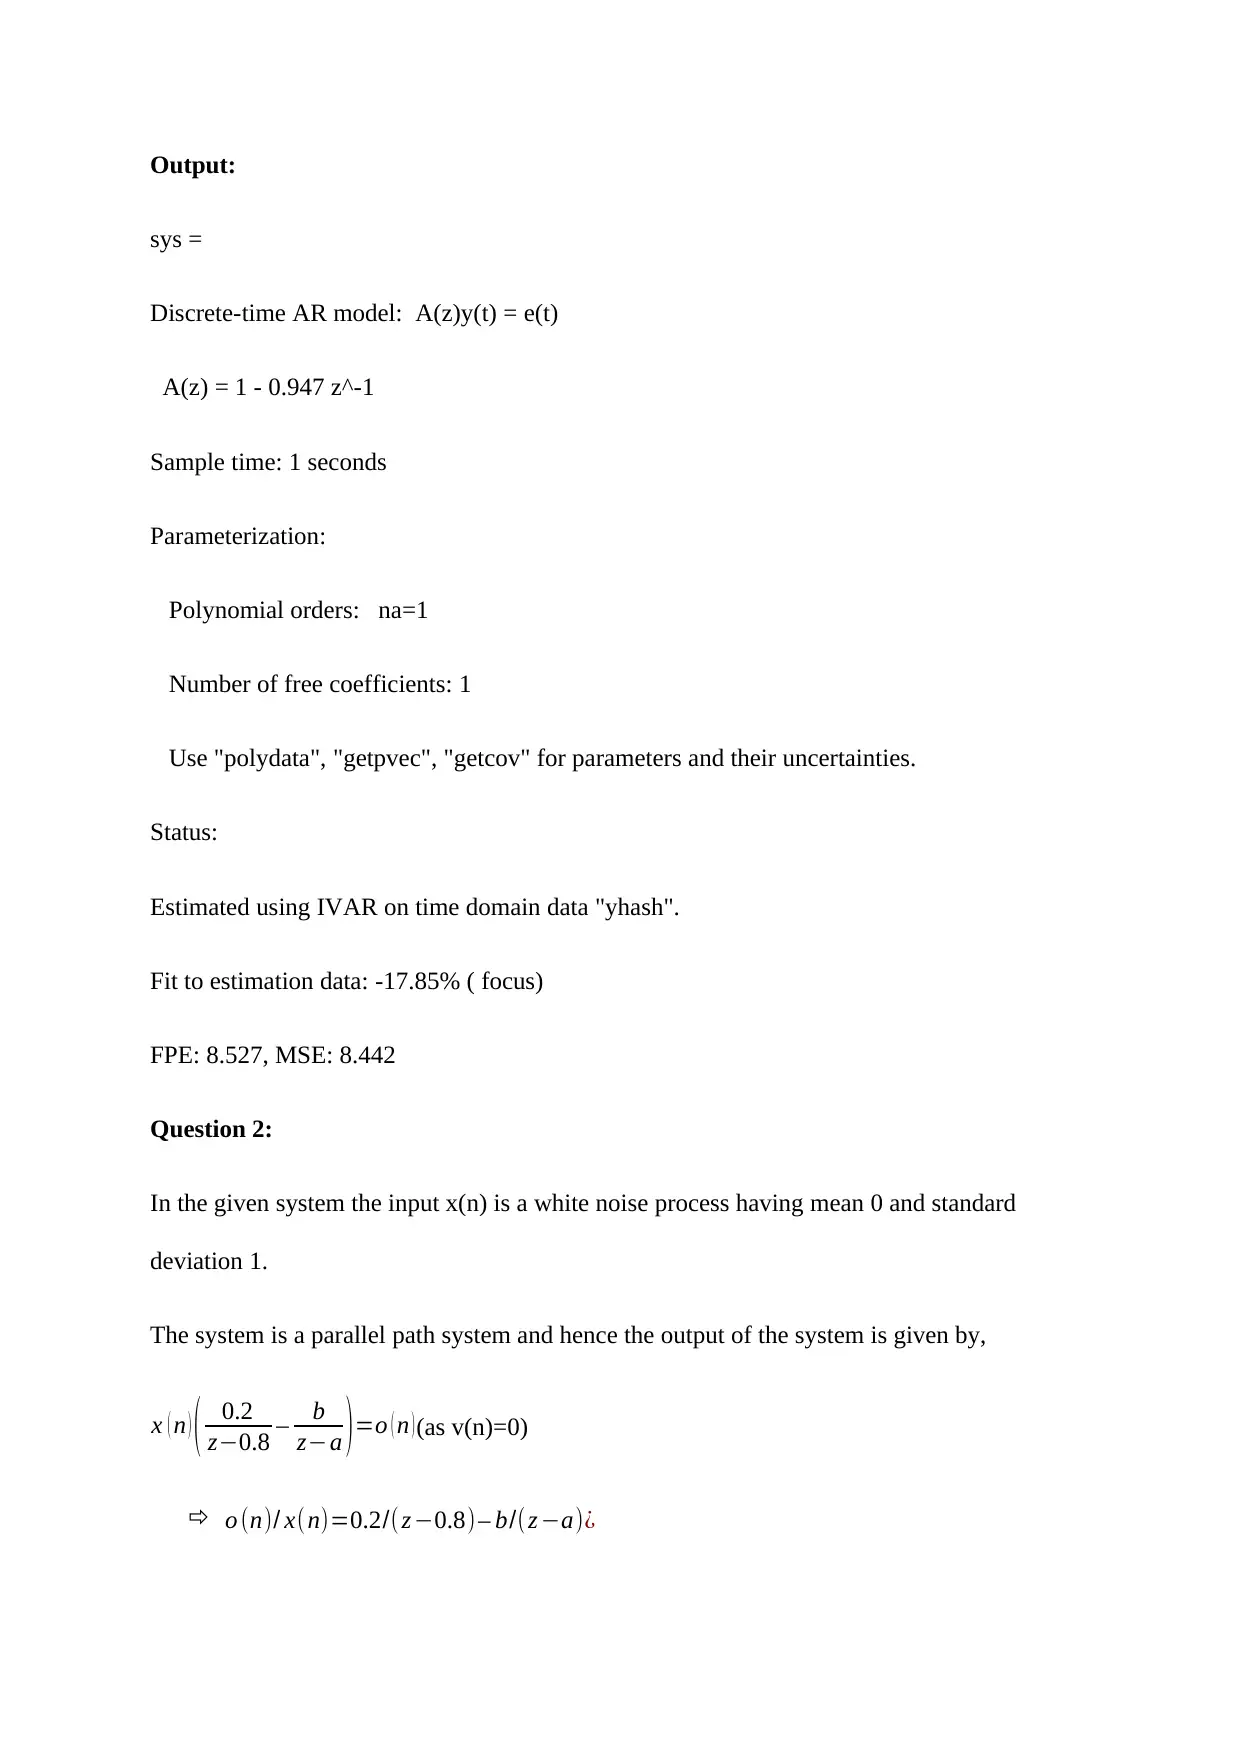
This assignment solution covers several key concepts in system identification and adaptive control. It includes the application of the instrumental variable approach to estimate parameters in a discrete-time system, analysis and optimization using the steepest descent algorithm for a parallel path system, and implementation of the recursive least squares algorithm for system identification with noisy signals. MATLAB code and plots are provided to illustrate the methods and results, offering a comprehensive understanding of these techniques in signal processing and control systems. Desklib provides students access to a wealth of solved assignments and study resources to aid in their academic pursuits.

1 out of 9
Related Documents


Your All-in-One AI-Powered Toolkit for Academic Success.
+13062052269
info@desklib.com
Available 24*7 on WhatsApp / Email
![[object Object]](/_next/static/media/star-bottom.7253800d.svg)
Copyright © 2020–2026 A2Z Services. All Rights Reserved. Developed and managed by ZUCOL.