Analysis of Systolic Blood Pressure: A Research Report
VerifiedAdded on 2022/12/15
|12
|3599
|313
Report
AI Summary
This report presents a comprehensive analysis of systolic blood pressure, employing descriptive statistics, regression analysis, and ANOVA to investigate its characteristics and health implications. The introduction establishes the context of psychometrics and its application in health assessment, emphasizing the importance of blood pressure measurements. The methodology section details the use of descriptive analysis, regression analysis, and ANOVA to interpret the data. The results section presents the findings, including statistical values for systolic blood pressure, correlations between age and systolic blood pressure, and ANOVA results. The discussion interprets these findings, highlighting the correlation coefficient, the ANOVA outcomes, and their significance. The report underscores the importance of understanding blood pressure measurements and their implications for health, offering insights into how to interpret the data and the implications of high blood pressure.

Coursework: A research
report
1
report
1
Paraphrase This Document
Need a fresh take? Get an instant paraphrase of this document with our AI Paraphraser

Contents
Contents...........................................................................................................................................2
Step one: Introduction......................................................................................................................3
Step Two: Design and Method........................................................................................................5
Step three: Results...........................................................................................................................6
Step Four: Discussion......................................................................................................................9
REFERENCES..............................................................................................................................12
2
Step one: Introduction
Psychometrics is a discipline of psychology that explores the philosophy and application of
psychological assessment. This is really a psychological assessment. It applies to the subfields of
education and psychology dealing with research, evaluation, and appraisal, as well as associated
practices (Abadie and et.al., 2020). Furthermore, many scholars and researchers work
collaboratively. The objective assessment of skills and experience, aptitudes, behaviours,
personality characteristics, clinical structures and psychiatric illness, as well as educational
success, are all topics covered in this area. Any psychometricians specialize in the creation and
validation of appraisal tools like questionnaires, surveys, ratters’ assessments, psychiatric
symptom indices, and temperament measures. In this report, Systolic Blood pressure of different
individual have been selected in order to perform the suitable test and find the suitable results
which support in making decision. Methods for dealing with massive matrices of similarities and
covariance’s also have been developed by psychometricians. For eg, a graduate pupil's view of
politics can be concluded from either a college standardized test and afterwards accurately
contrasted to a secondary school content performance deduced from a somewhat complicated
test. Classical test theory grades don’t have this function, because they are based on individual
skill rather than ability in comparison to other students admitted. com needs to test (Brooks and
et.al., 2019).
Multiple regression, a technique of deciding the fundamental parameters of data, is one
methodology in this particular process. The lack of agreement on appropriate methods for
estimating the amount of latent variables is among the key problems faced by confirmatory
factor consumers. Since the original globe shrinks, it's normal to avoid factoring whenever the
eigenvalues decrease below one. Other nonparametric models are concerned with the lack of
breaking positions. Reliability and authenticity are two key principles of traditional test theory.
An accurate metric is one that accurately tests a construct over time, over people, and across
contexts. A legitimate test is one that correctly calculates what it appears to be calculating.
Validity requires, but that is not adequate for, reliability. Whenever a measurement is linked to
measurements of other structures as needed by theory, it is claimed to have measure the same
construct. The material content validity is a proof that the objects accurately cover that area
being evaluated. In the case of staff selection, test description is based on a statement given or
collection of reports of experience, abilities, capacity, or other attributes extracted from an
3
⊘ This is a preview!⊘
Do you want full access?
Subscribe today to unlock all pages.
Trusted by 1+ million students worldwide
analysable dataset. The relation among found widely and different test answers is modelled using
analytical and logical reasoning. IRT, along with other things, establishes a foundation for
estimating a test-position taker's on even a defined latent characteristic, and also the normal
errors of calculation of that position. A college student's understanding of background, for
example, may be inferred from the performance (Canales, 2016). Each document lays out a
series of principles that can be used in a number of educational situations. The principles lay out
criteria for developing, applying, evaluating, and optimizing the chosen assessment method. To
facilitate proper, effective, achievable, and reliable educational assessments, several of the
criteria has been put under one of two general categories. Validity and durability concerns are
addressed underneath the reliability heading in such collections of guidelines. Student
consistency criteria, for example, aim to guarantee that student assessments contain sound,
precise, and reliable data on students' learning and success. Psychometrics is a branch of
psychology that studies individual skills, personalities, characteristics, and educational
progression. Comparative psychology, for example, examines the actions, thought mechanisms,
and skills of non-human species, while social science studies the difference among non-human
individuals as well as the majority of species. Nonetheless, several people advocate for a much
more incremental transition seen between plant and livestock approaches. It implies that have
high blood pressure if systolic pressure was around 120 as well as 129 mm Hg but the systolic
blood would be less below 80 mm Hg. Despite the fact that these figures aren't actually elevated
blood pressure, Individual exceeded the reasonable levels. Blood pressure that is higher does
have a strong probability of being high cholesterol, placing them at risk for heart failure and
stroke. The heart pulls and drives blood across the lungs to either the entire body as it beats. The
systolic blood volume is measured by the force exerted on certain blood vessels. A systolic
pressure of less than 120 is deemed acceptable. Blood pressure is described as some readings of
140 or higher. High blood pressure, commonly known as manic depression, is a condition in
which the blood pressure is greater than average. The blood pressure fluctuates during the day
depending on what do. Blood pressure readings that are consistently higher than average will
lead to a diagnosis of increased blood pressure (or hypertension). The recommendations for
diagnosing heart problems can vary from one health care provider to the next:
When a patient's body temperature is regularly 140/90 mm Hg or greater, certain
healthcare professionals treat them with elevated blood pressure (Creehan, 2018).
4
Paraphrase This Document
Need a fresh take? Get an instant paraphrase of this document with our AI Paraphraser
This cap is based on even a 2003 rule, as shown in the chart below. Sufferers with
elevated blood pressure are diagnosed by certain care providers.
If a physician's body temperature is regularly 130/80 mm Hg or higher, many health
care providers will diagnose them with elevated blood pressure. 1 This cap is based
on even a 2017 rule, as shown in the chart following that is discussed in the next step
of this report.
The most reliable method is to take an aggregate of cholesterol levels over time. That's why it's
recommended that also have their blood pressure checked at least just before per year by a
medical practitioner. If the levels are large, may need to search more often. High BP may cause a
stroke by causing their veins that deliver blood through oxygen to the brain to burst or become
blocked (Dai and et.al., 2019). During a trauma, neurons die as a result of a loss of oxygen.
Strokes can cause significant impairments of voice, mobility, and other essential functions. This
will even die from a stroke. Keep in mind that a single blood pressure reading does not always
indicate how well people maintain their life to live better.
Step Two: Design and Method
Descriptive analysis: Descriptive statistics often used to characterize the fundamental
characteristics of study's results. They offer fast summaries of sample and the metrics. They are
the foundation of practically any quantitative data review along with basic graphics analysis.
Inferential statistics often distinguished from the descriptive statistics. When one uses descriptive
statistics, this actually explaining what data is or indicates. When using inferential statistics,
this attempting to draw conclusions that go beyond data at hand. For example, one use inferential
statistics that try to determine what population would think based on sample data. Alternatively,
one can use inferential metrics to assess if an observed discrepancy among groups is accurate
and one that occurred by likelihood in this sample. As a result, one can use inferential statistics
to extrapolate general conditions through ones’ data, while descriptive statistics are utilized to
merely describe what's happening on in data (Ding and et.al., 2019).
Regression analysis: According to the design of classification, total variance present
in collection of data can be split into number of non-overlapping elements. Analysis of Variance
(ANNOVA) is systematic method for accomplishing this. Any hypothesis testing can be done
with the aid of these partitioning. ANOVA is initially used to evaluate experimental data through
Randomized Designs, although it became later extended to include survey including secondary
5
data through Descriptive Research. Corresponding analysis being defined as N-Way ANOVA
(N>=2) when one considers the influence of greater than one addressable trigger (different
classes of multiple variables) on response variable (Frizzo-Barker and et.al, 2020). Two-Way
ANOVA is used when the effect of two variables (with multiple categories) on dependent
(response) variable taken into account. When just single variable (distinct groups of single
factor) affects response variable's results, there would be only 1 assignable explanation for data
sub-divide, and the resulting analysis known as the One-Way Analysis of Variance.
Corresponding study is defined as N-Way ANOVA where (N>=2) if one consider the influence
of greater than 1 assignable trigger (divide classes of various factors) on response variable/factor.
Two-Way ANOVA is used when the effect of two variables (with multiple
classes) on dependent factor is taken into account.
Anova analysis: Regression is statistical technique employed in economics, investing, as well as
other applications to evaluate the intensity and nature of relationship between 1 dependent
variable (typically represented by Y) as well as a set of other factors (regarded as
the independent variables).
Investing and financial managers may use regression to quantify assets as well as grasp the
associations among variables like commodities rates as well as the inventory of companies that
trade within these commodities. Simple linear regressions and multiple linear regressions are the
two most common forms of regression, however non-linear regression approaches exist for more
complex data and evaluation. Multiple-linear regression requires multiple independent factors to
predict the result of dependent variable Y, whereas simple-linear regression employs single
independent factor to describe or predict outcome of dependent variable Y. Regression attempts
to identify a statistical association between a set of random variables that are supposed to
determine Y. The most common type of such relationship is straight line (linear regressions)
which best approximates all of individual data points. Here, Subscripts are used to distinguish the
various variables in the multiple regression (Guo and et.al., 2019).
Step three: Results
Descriptive:
Statistics
Systolic BP (mean 2nd/3rd)
6
⊘ This is a preview!⊘
Do you want full access?
Subscribe today to unlock all pages.
Trusted by 1+ million students worldwide
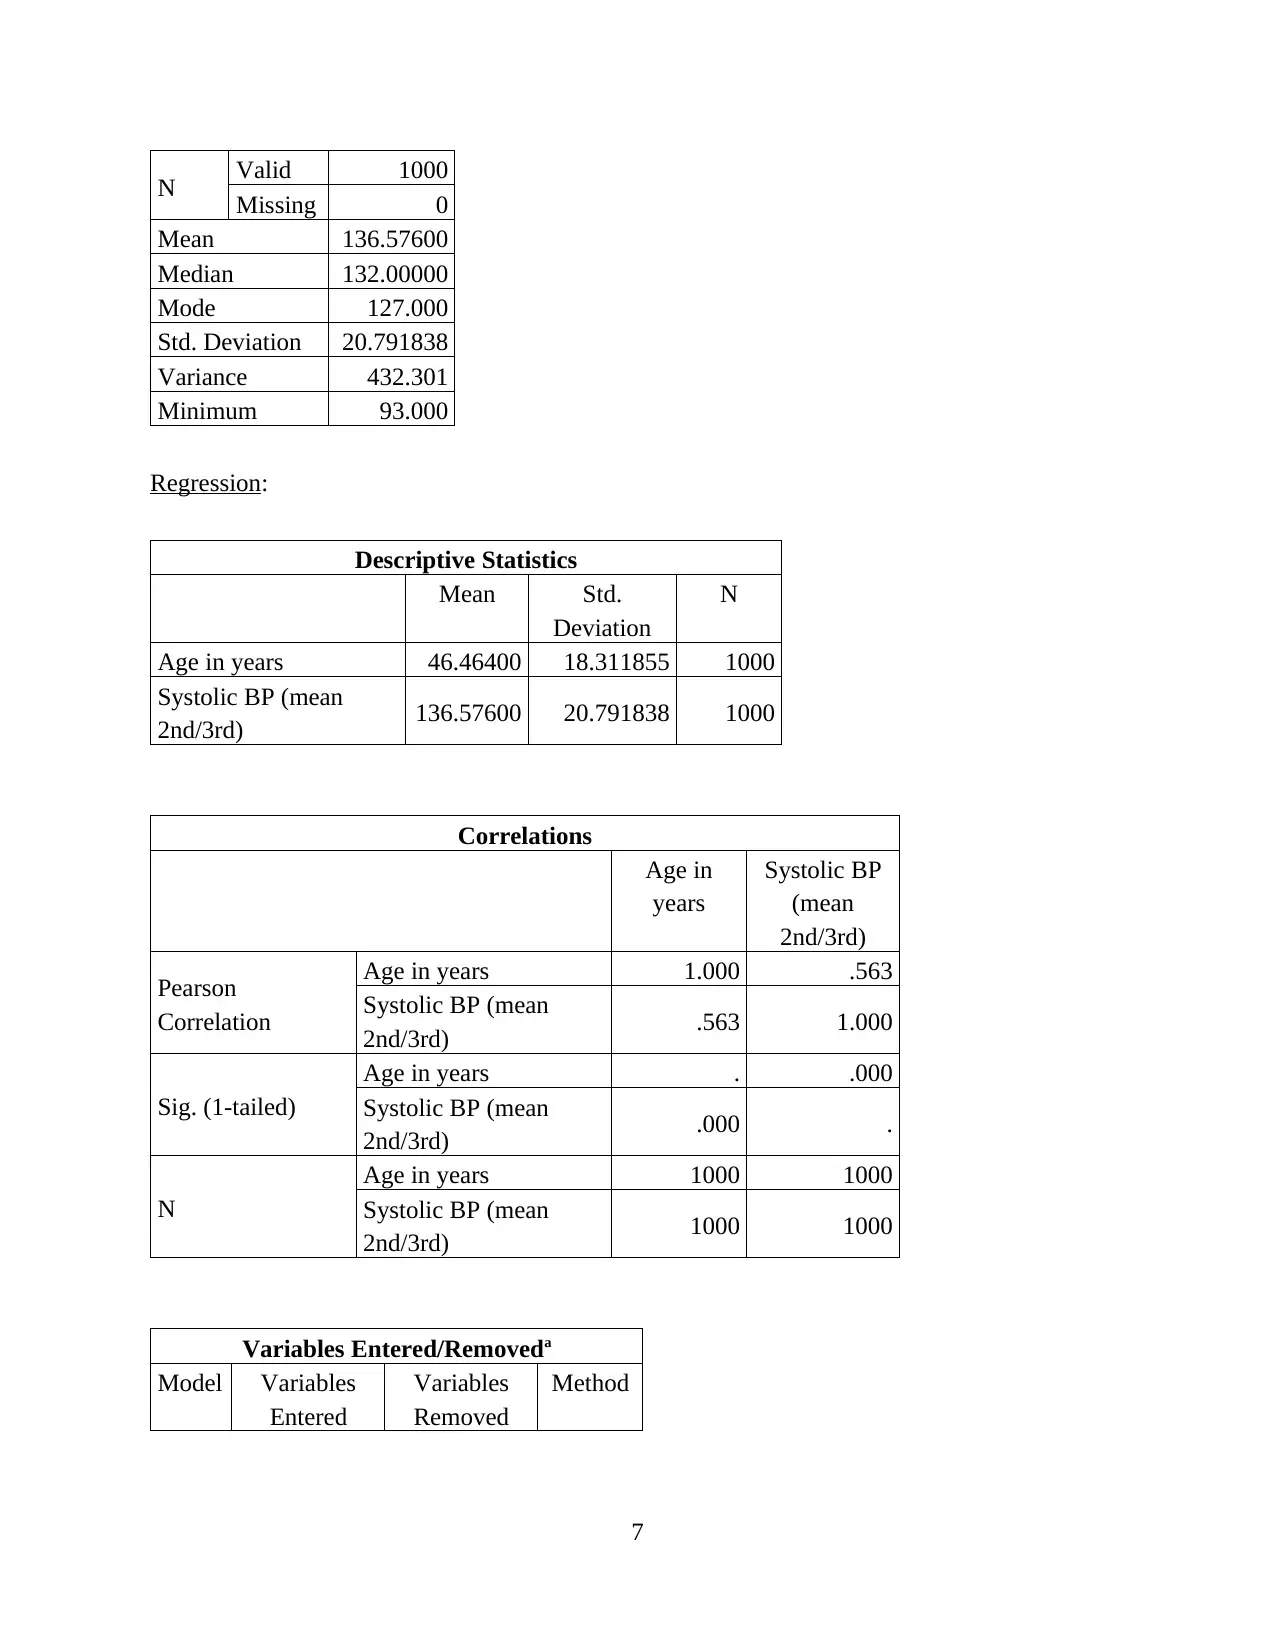
N Valid 1000
Missing 0
Mean 136.57600
Median 132.00000
Mode 127.000
Std. Deviation 20.791838
Variance 432.301
Minimum 93.000
Regression:
Descriptive Statistics
Mean Std.
Deviation
N
Age in years 46.46400 18.311855 1000
Systolic BP (mean
2nd/3rd) 136.57600 20.791838 1000
Correlations
Age in
years
Systolic BP
(mean
2nd/3rd)
Pearson
Correlation
Age in years 1.000 .563
Systolic BP (mean
2nd/3rd) .563 1.000
Sig. (1-tailed)
Age in years . .000
Systolic BP (mean
2nd/3rd) .000 .
N
Age in years 1000 1000
Systolic BP (mean
2nd/3rd) 1000 1000
Variables Entered/Removeda
Model Variables
Entered
Variables
Removed
Method
7
Paraphrase This Document
Need a fresh take? Get an instant paraphrase of this document with our AI Paraphraser
1
Systolic BP
(mean
2nd/3rd)b
. Enter
a. Dependent Variable: Age in years
b. All requested variables entered.
Model Summary
Model R R
Square
Adjusted R
Square
Std. Error of
the Estimate
Change Statistics
R Square
Change
F
Change
df
1
df2 Sig. F
Change
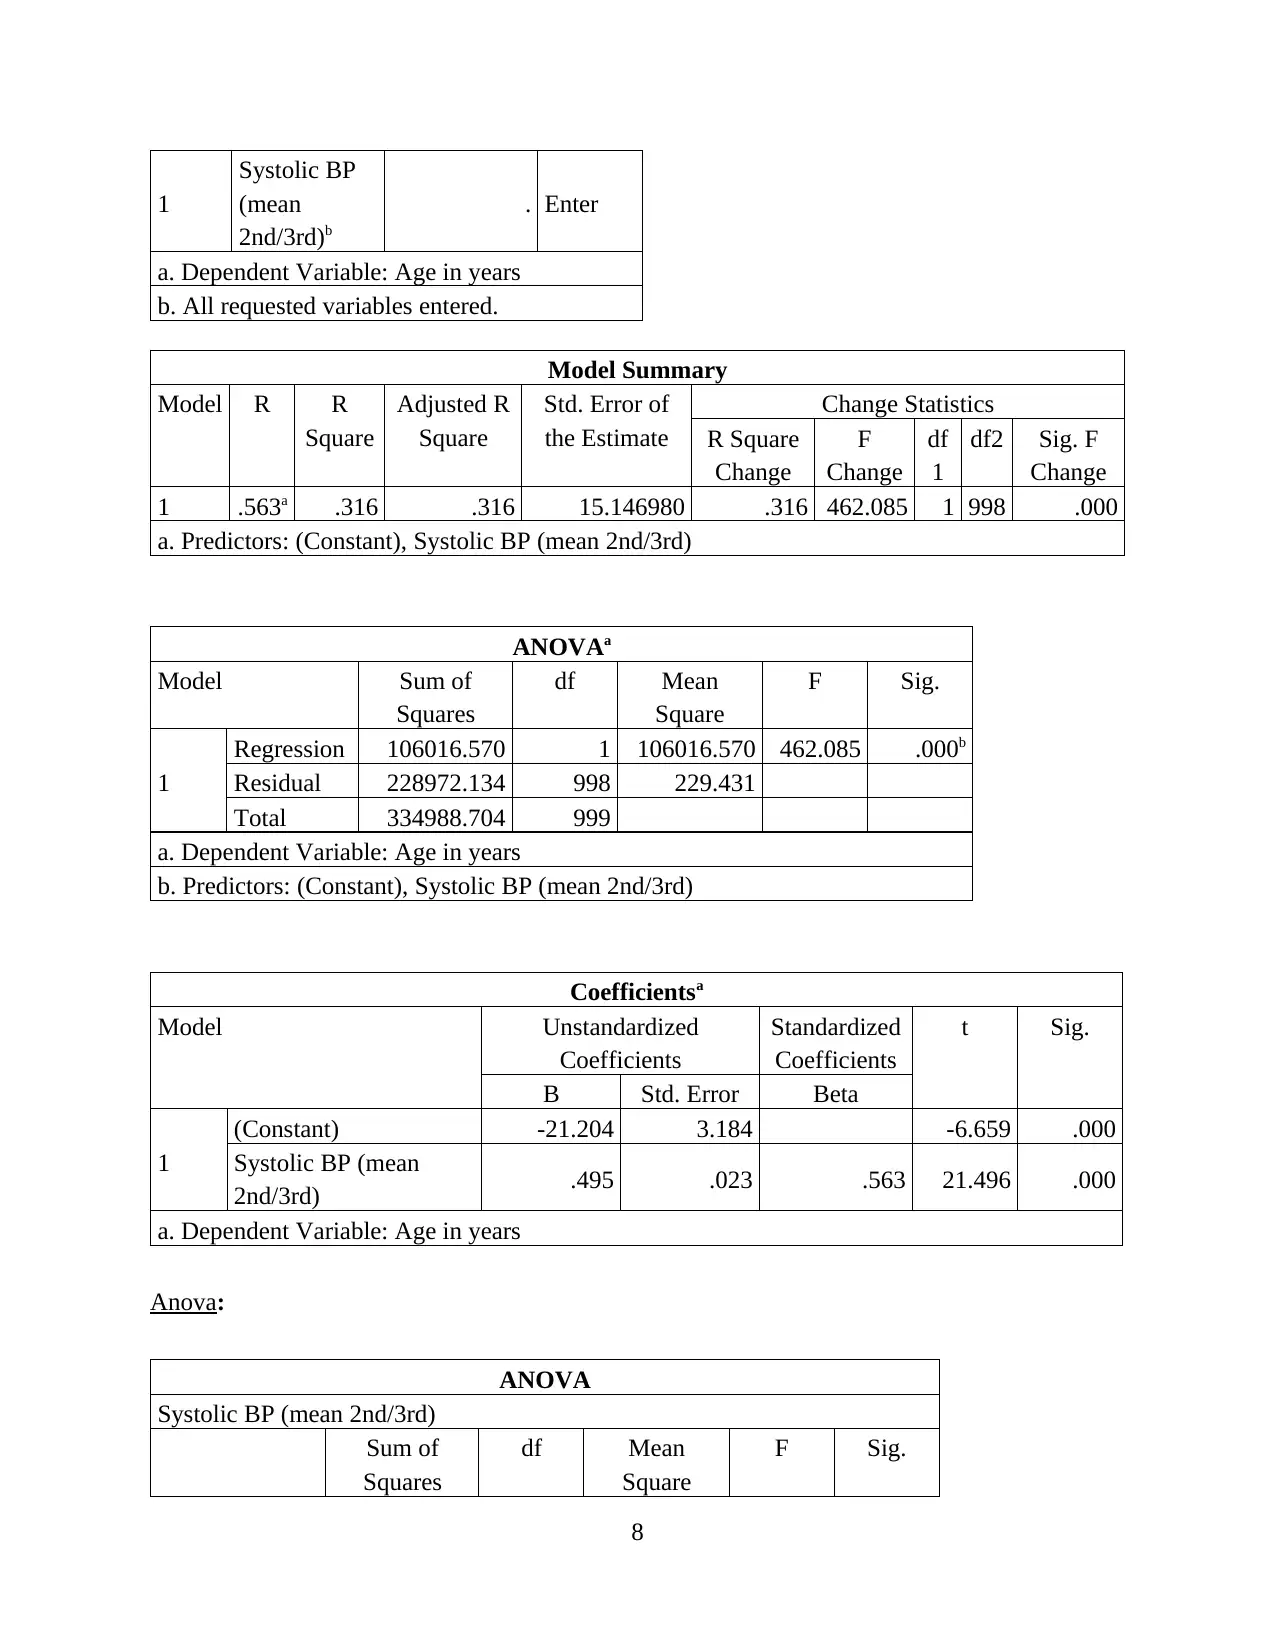
1 .563a .316 .316 15.146980 .316 462.085 1 998 .000
a. Predictors: (Constant), Systolic BP (mean 2nd/3rd)
ANOVAa
Model Sum of
Squares
df Mean
Square
F Sig.
1
Regression 106016.570 1 106016.570 462.085 .000b
Residual 228972.134 998 229.431
Total 334988.704 999
a. Dependent Variable: Age in years
b. Predictors: (Constant), Systolic BP (mean 2nd/3rd)
Coefficientsa
Model Unstandardized
Coefficients
Standardized
Coefficients
t Sig.
B Std. Error Beta
1
(Constant) -21.204 3.184 -6.659 .000
Systolic BP (mean
2nd/3rd) .495 .023 .563 21.496 .000
a. Dependent Variable: Age in years
Anova:
ANOVA
Systolic BP (mean 2nd/3rd)
Sum of
Squares
df Mean
Square
F Sig.
8
Systolic BP
(mean
2nd/3rd)b
. Enter
a. Dependent Variable: Age in years
b. All requested variables entered.
Model Summary
Model R R
Square
Adjusted R
Square
Std. Error of
the Estimate
Change Statistics
R Square
Change
F
Change
df
1
df2 Sig. F
Change
1 .563a .316 .316 15.146980 .316 462.085 1 998 .000
a. Predictors: (Constant), Systolic BP (mean 2nd/3rd)
ANOVAa
Model Sum of
Squares
df Mean
Square
F Sig.
1
Regression 106016.570 1 106016.570 462.085 .000b
Residual 228972.134 998 229.431
Total 334988.704 999
a. Dependent Variable: Age in years
b. Predictors: (Constant), Systolic BP (mean 2nd/3rd)
Coefficientsa
Model Unstandardized
Coefficients
Standardized
Coefficients
t Sig.
B Std. Error Beta
1
(Constant) -21.204 3.184 -6.659 .000
Systolic BP (mean
2nd/3rd) .495 .023 .563 21.496 .000
a. Dependent Variable: Age in years
Anova:
ANOVA
Systolic BP (mean 2nd/3rd)
Sum of
Squares
df Mean
Square
F Sig.
8
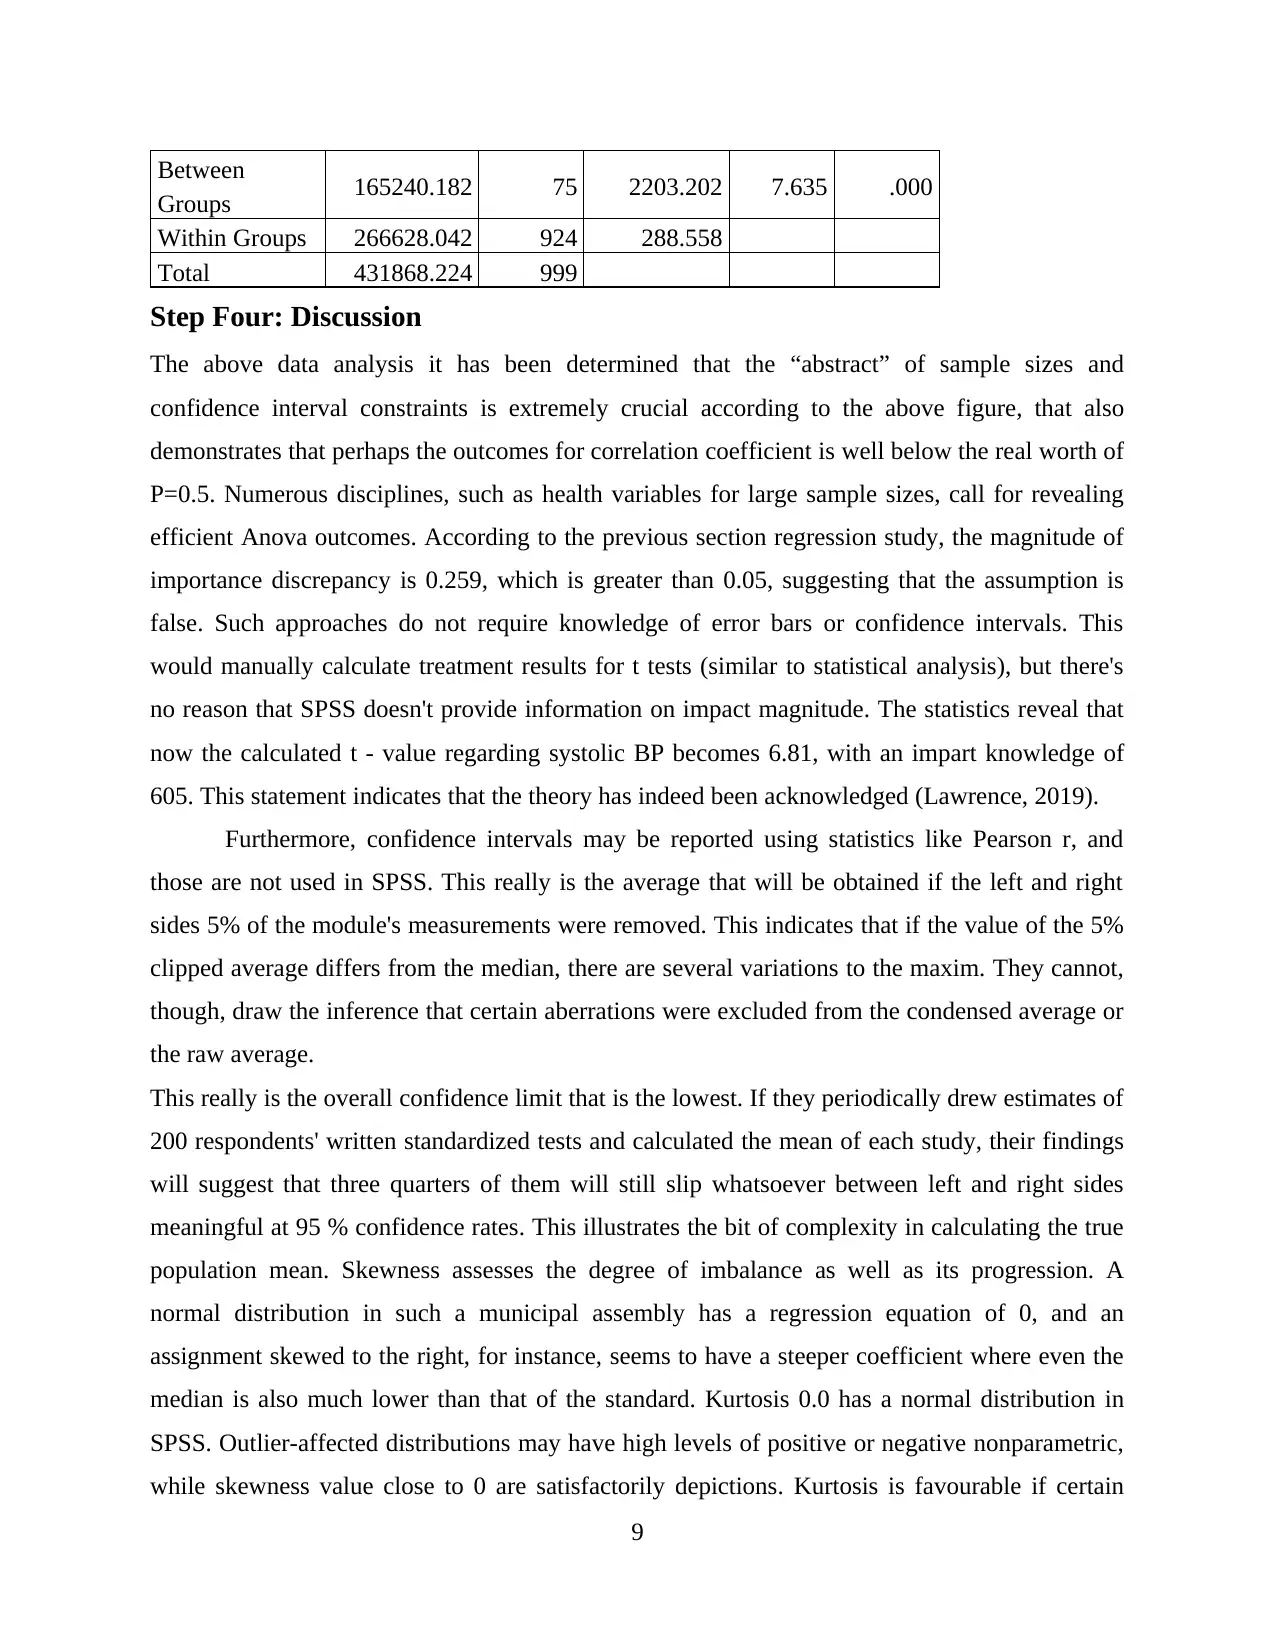
Between
Groups 165240.182 75 2203.202 7.635 .000
Within Groups 266628.042 924 288.558
Total 431868.224 999
Step Four: Discussion
The above data analysis it has been determined that the “abstract” of sample sizes and
confidence interval constraints is extremely crucial according to the above figure, that also
demonstrates that perhaps the outcomes for correlation coefficient is well below the real worth of
P=0.5. Numerous disciplines, such as health variables for large sample sizes, call for revealing
efficient Anova outcomes. According to the previous section regression study, the magnitude of
importance discrepancy is 0.259, which is greater than 0.05, suggesting that the assumption is
false. Such approaches do not require knowledge of error bars or confidence intervals. This
would manually calculate treatment results for t tests (similar to statistical analysis), but there's
no reason that SPSS doesn't provide information on impact magnitude. The statistics reveal that
now the calculated t - value regarding systolic BP becomes 6.81, with an impart knowledge of
605. This statement indicates that the theory has indeed been acknowledged (Lawrence, 2019).
Furthermore, confidence intervals may be reported using statistics like Pearson r, and
those are not used in SPSS. This really is the average that will be obtained if the left and right
sides 5% of the module's measurements were removed. This indicates that if the value of the 5%
clipped average differs from the median, there are several variations to the maxim. They cannot,
though, draw the inference that certain aberrations were excluded from the condensed average or
the raw average.
This really is the overall confidence limit that is the lowest. If they periodically drew estimates of
200 respondents' written standardized tests and calculated the mean of each study, their findings
will suggest that three quarters of them will still slip whatsoever between left and right sides
meaningful at 95 % confidence rates. This illustrates the bit of complexity in calculating the true
population mean. Skewness assesses the degree of imbalance as well as its progression. A
normal distribution in such a municipal assembly has a regression equation of 0, and an
assignment skewed to the right, for instance, seems to have a steeper coefficient where even the
median is also much lower than that of the standard. Kurtosis 0.0 has a normal distribution in
SPSS. Outlier-affected distributions may have high levels of positive or negative nonparametric,
while skewness value close to 0 are satisfactorily depictions. Kurtosis is favourable if certain
9
⊘ This is a preview!⊘
Do you want full access?
Subscribe today to unlock all pages.
Trusted by 1+ million students worldwide
heads are 'greater' than for a normal distribution, however neutral unless the heads are 'heavier'
than for a typical value. Those would be the regression coefficients for a measure's printing. Any
of the measurements is exceedingly small, which is a feature of how precisely they are weighed.
If there's not a price at the 5th percentile, for example, the price is already standardized. Since
there are a few different ways to calculate these attributes, SPSS discusses how it does it by
explaining that 'Type 1' was being used. These columns give a single vector of percentile values.
It is costly when compared to other popular alternatives. 'New' patches are published around
once a year; there are several major changes to any of these 'new' variables, so hypothesis
checking will not be a headache. As a result, it is reasonable to conclude that there is no
substantial relationship between those who earn credit and those who buy the vehicle (Saura,
Herráez and Reyes-Menendez, 2019).
Since they were rather resistant in swallowing up-and-down measures mostly on
dependent variables of mental health, large firms may be more focused by consumer segments,
since all the parameters are all out: large corporations have enough resources to sponsor research
projects, the findings obtained are more valuable in improving their employment policies, as well
as the key motivating are much more valuable in improving their business behaviour, because
they were most resistant in eating up-and-down interventions on mostly measurement items of
heath. Two approaches to presenting an anecdote are also proposed.
It also suggests two approaches to engaging an analytical firm, one of which is to "do
upstream stuff with individual project teams." Also does spss findings aim to be a correlational
research of a project that is forward more to findings to the successful healthcare market
perspectives of descriptive and predictive tests like Anova research by relating to the data
analytics. Although "data analytics" is usually a greater and more scattered component of "data
gathering," it can be used to denote more traditional big data, like data sources of therapeutic
outcomes against food intakes, a diagnostic experiment on the efficacy of a drug in certain
communities, and predicting the performance of a heat panel given historical data production
across many years. These comparative tests were, in fact, smaller in scale than other variables. A
niche technology research business organization focuses inside and reacts to publicly available
applications, throughout addition to having large production and distribution facilities. For Data
View, the duration of every other line in the table. Which is not the same also as range of values
shown by each price. This is valid in terms of the extent of each spreadsheet row. To change the
10
Paraphrase This Document
Need a fresh take? Get an instant paraphrase of this document with our AI Paraphraser

font size of a factor, select this in the cell and click the "Columns" button. Then click the "up" or
"down" button symbol to increase or decrease the column size. Left-justified, center-justified,
and right-justified content alignment alternatives are available in the SPSS Data Show file
columns and directions. The column corresponding both to the 'Position' row for that cell and the
individual categories alignment (Saura, Herráez and Reyes-Menendez, 2019).
11
REFERENCES
Books and Journals
Abadie, A., and et.al., 2020. Sampling‐Based versus Design‐Based Uncertainty in Regression
Analysis. Econometrica, 88(1), pp.265-296.
Brooks, C. and et.al., 2019. Why does research in finance have so little impact? Critical
Perspectives on Accounting, 58, pp.24-52.
Canales, R., 2016. From ideals to institutions: Institutional entrepreneurship and the growth of
Mexican small business finance. Organization Science, 27(6), pp.1548-1573.
Creehan, S., 2018. How digital innovation can increase small business access to finance in
asia. Asia Focus, (March).
Dai, K., Wang, D., Lu, H., Sun, C. and Li, J., 2019. Visual tracking via adaptive spatially-
regularized correlation filters. In Proceedings of the IEEE Conference on Computer
Vision and Pattern Recognition (pp. 4670-4679).
Ding, H., Jiang, X., Shuai, B., Liu, A.Q. and Wang, G., 2019. Semantic correlation promoted
shape-variant context for segmentation. In Proceedings of the IEEE Conference on
Computer Vision and Pattern Recognition (pp. 8885-8894).
Fisch, C., 2019. Initial coin offerings (ICOs) to finance new ventures. Journal of Business
Venturing. 34(1). pp.1-22.
Frizzo-Barker, J. and et.al, 2020. Blockchain as a disruptive technology for business: A
systematic review. International Journal of Information Management. 51. p.102029.
Guo, X., Yang, K., Yang, W., Wang, X. and Li, H., 2019. Group-wise correlation stereo
network. In Proceedings of the IEEE Conference on Computer Vision and Pattern
Recognition (pp. 3273-3282).
Lawrence, K. D., 2019. Robust regression: analysis and applications. Routledge.
Saura, J. R., Herráez, B. R. and Reyes-Menendez, A., 2019. Comparing a traditional approach
for financial Brand Communication Analysis with a Big Data Analytics technique. IEEE
Access. 7. pp.37100-37108.
12
⊘ This is a preview!⊘
Do you want full access?
Subscribe today to unlock all pages.
Trusted by 1+ million students worldwide
1 out of 12
Related Documents


Your All-in-One AI-Powered Toolkit for Academic Success.
+13062052269
info@desklib.com
Available 24*7 on WhatsApp / Email
![[object Object]](/_next/static/media/star-bottom.7253800d.svg)
Unlock your academic potential
Copyright © 2020–2026 A2Z Services. All Rights Reserved. Developed and managed by ZUCOL.