Financial Performance Evaluation: An Analysis Report of T plc

Verified

Added on  2023/06/18

|7
|1443
|485
Report
AI Summary
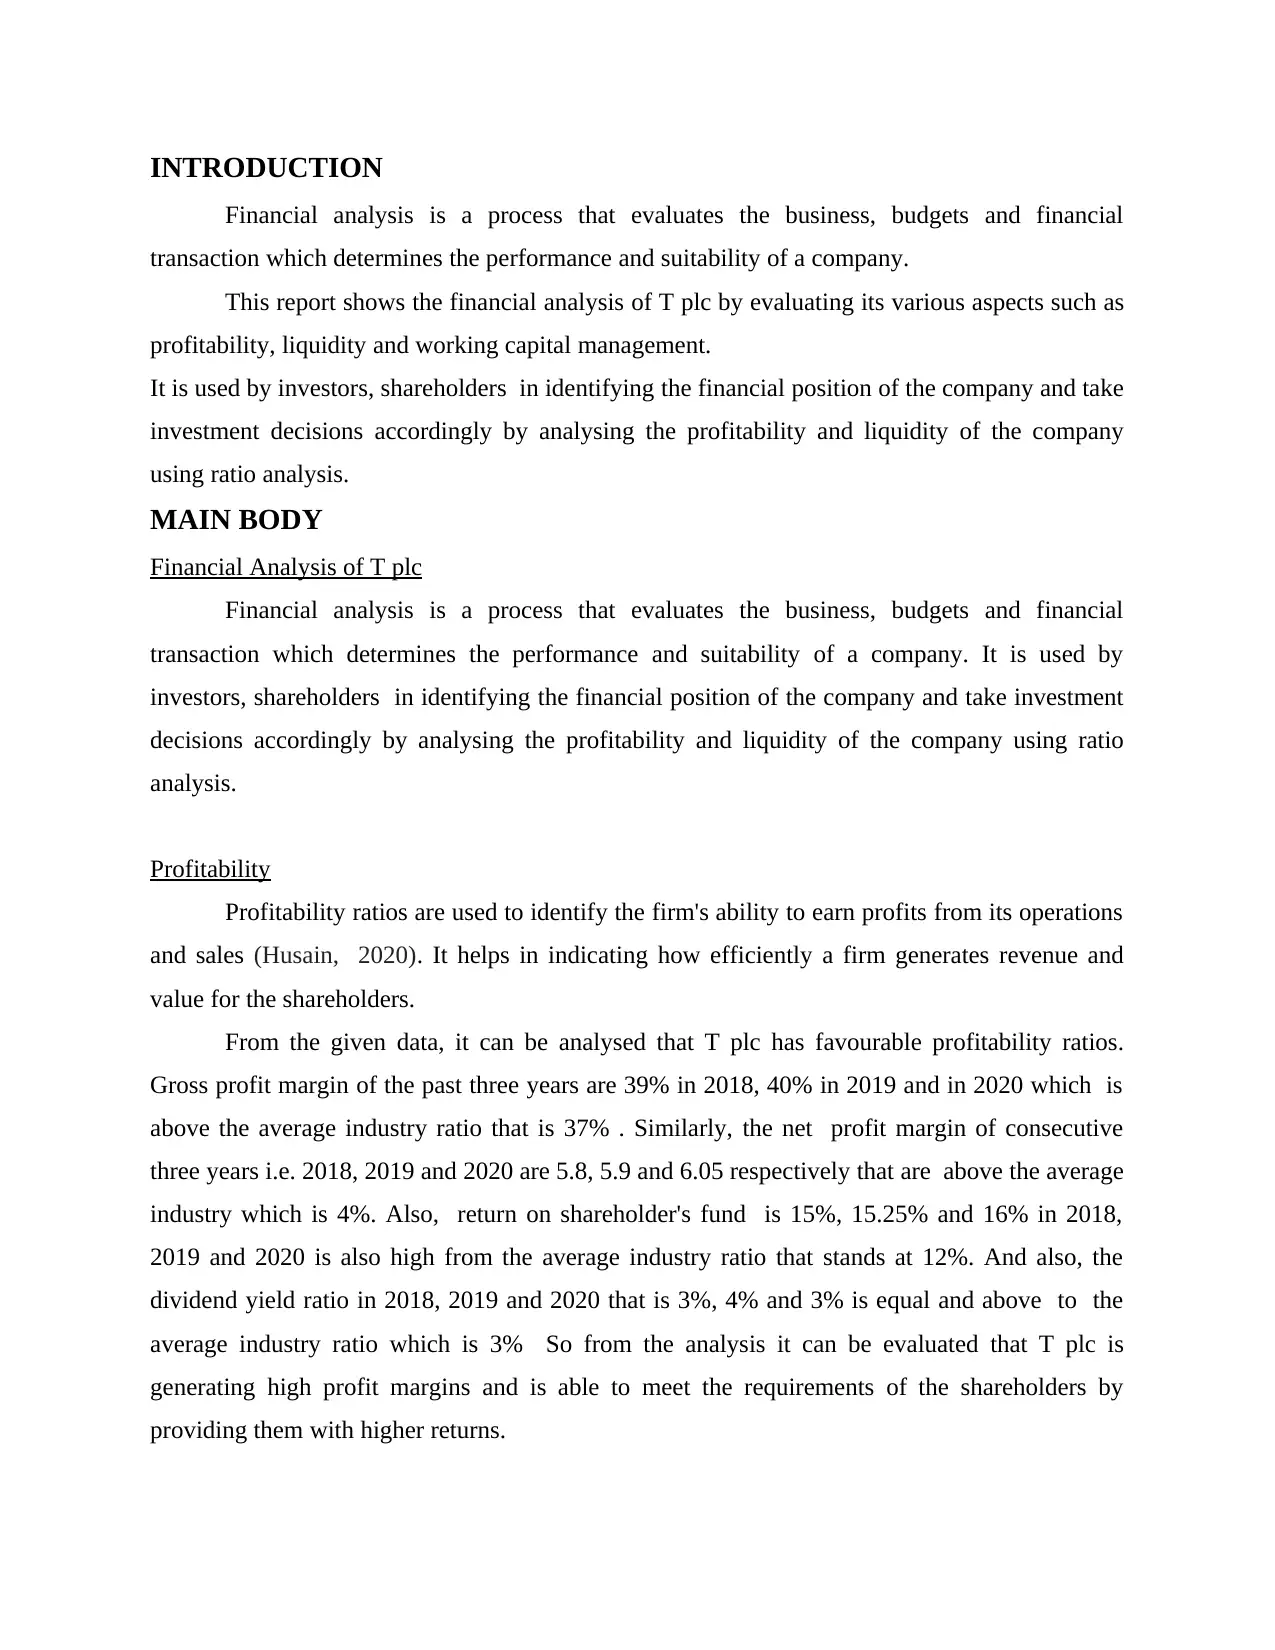
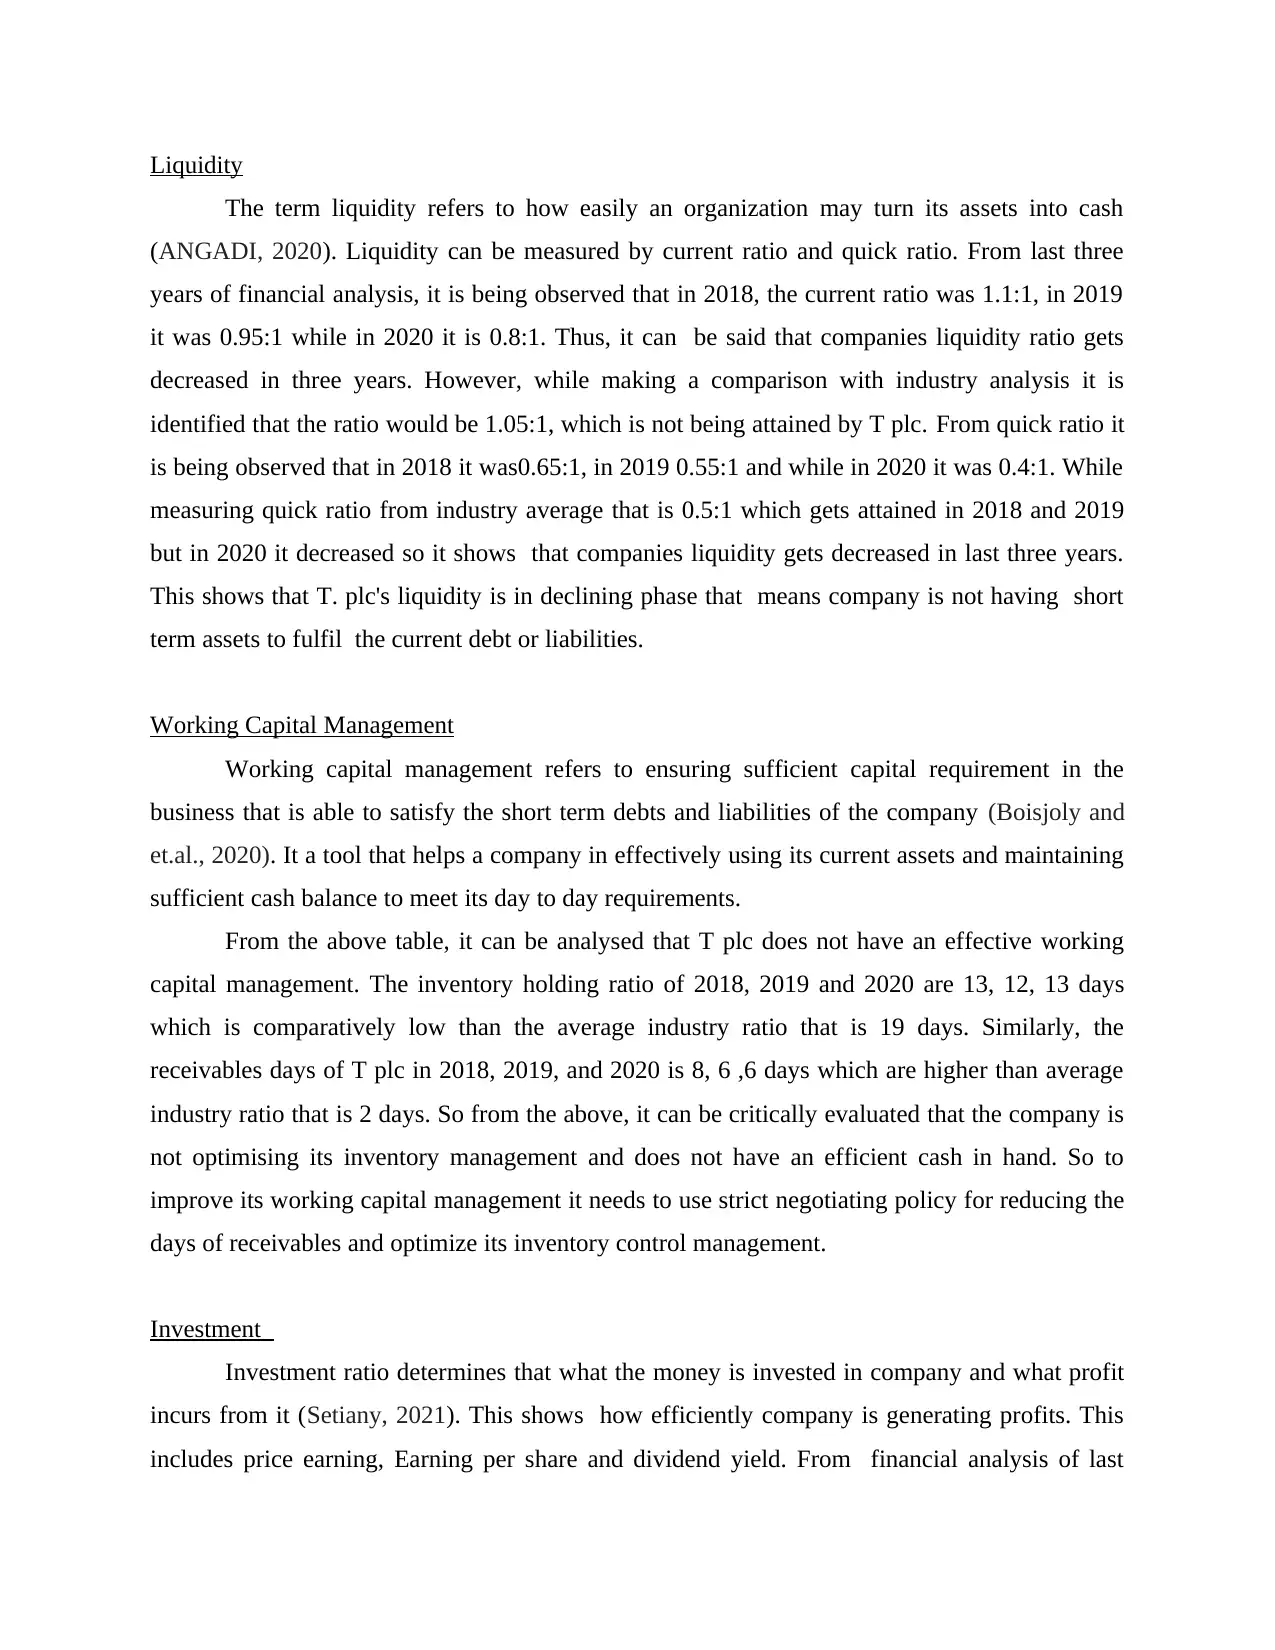
This report presents a financial analysis of T plc, evaluating its business performance through key financial metrics. The analysis covers profitability, assessing gross and net profit margins, return on shareholder's funds, and dividend yield, revealing favorable profitability ratios compared to industry averages. Liquidity is examined through current and quick ratios, indicating a declining trend but still attaining industry averages in some years. Working capital management is analyzed via inventory holding and receivables days, highlighting areas for improvement. Investment ratios, including earnings per share and price-earnings ratio, suggest growth and investor interest. The report concludes that T plc presents a potentially sound investment opportunity due to its overall financial health and revenue generation capabilities. Desklib offers access to this and other solved assignments for students.
tabler-icon-diamond-filled.svg

Contribute Materials

Your contribution can guide someone’s learning journey. Share your documents today.
Document Page
BUSINESS PERFORMANCE
tabler-icon-diamond-filled.svg

Secure Best Marks with AI Grader

Need help grading? Try our AI Grader for instant feedback on your assignments.
Document Page
Table of Contents
INTRODUCTION...........................................................................................................................3
MAIN BODY...................................................................................................................................3
Financial Analysis of T plc..........................................................................................................3
Profitability..................................................................................................................................3
Liquidity.......................................................................................................................................4
Working Capital Management.....................................................................................................4
Investment ..................................................................................................................................4
Investments in T. plc....................................................................................................................5
CONCLUSION................................................................................................................................5
REFERENCES................................................................................................................................1
Document Page
INTRODUCTION
Financial analysis is a process that evaluates the business, budgets and financial
transaction which determines the performance and suitability of a company.
This report shows the financial analysis of T plc by evaluating its various aspects such as
profitability, liquidity and working capital management.
It is used by investors, shareholders in identifying the financial position of the company and take
investment decisions accordingly by analysing the profitability and liquidity of the company
using ratio analysis.
MAIN BODY
Financial Analysis of T plc
Financial analysis is a process that evaluates the business, budgets and financial
transaction which determines the performance and suitability of a company. It is used by
investors, shareholders in identifying the financial position of the company and take investment
decisions accordingly by analysing the profitability and liquidity of the company using ratio
analysis.
Profitability
Profitability ratios are used to identify the firm's ability to earn profits from its operations
and sales (Husain, 2020). It helps in indicating how efficiently a firm generates revenue and
value for the shareholders.
From the given data, it can be analysed that T plc has favourable profitability ratios.
Gross profit margin of the past three years are 39% in 2018, 40% in 2019 and in 2020 which is
above the average industry ratio that is 37% . Similarly, the net profit margin of consecutive
three years i.e. 2018, 2019 and 2020 are 5.8, 5.9 and 6.05 respectively that are above the average
industry which is 4%. Also, return on shareholder's fund is 15%, 15.25% and 16% in 2018,
2019 and 2020 is also high from the average industry ratio that stands at 12%. And also, the
dividend yield ratio in 2018, 2019 and 2020 that is 3%, 4% and 3% is equal and above to the
average industry ratio which is 3% So from the analysis it can be evaluated that T plc is
generating high profit margins and is able to meet the requirements of the shareholders by
providing them with higher returns.
Document Page
Liquidity
The term liquidity refers to how easily an organization may turn its assets into cash
(ANGADI, 2020). Liquidity can be measured by current ratio and quick ratio. From last three
years of financial analysis, it is being observed that in 2018, the current ratio was 1.1:1, in 2019
it was 0.95:1 while in 2020 it is 0.8:1. Thus, it can be said that companies liquidity ratio gets
decreased in three years. However, while making a comparison with industry analysis it is
identified that the ratio would be 1.05:1, which is not being attained by T plc. From quick ratio it
is being observed that in 2018 it was0.65:1, in 2019 0.55:1 and while in 2020 it was 0.4:1. While
measuring quick ratio from industry average that is 0.5:1 which gets attained in 2018 and 2019
but in 2020 it decreased so it shows that companies liquidity gets decreased in last three years.
This shows that T. plc's liquidity is in declining phase that means company is not having short
term assets to fulfil the current debt or liabilities.
Working Capital Management
Working capital management refers to ensuring sufficient capital requirement in the
business that is able to satisfy the short term debts and liabilities of the company (Boisjoly and
et.al., 2020). It a tool that helps a company in effectively using its current assets and maintaining
sufficient cash balance to meet its day to day requirements.
From the above table, it can be analysed that T plc does not have an effective working
capital management. The inventory holding ratio of 2018, 2019 and 2020 are 13, 12, 13 days
which is comparatively low than the average industry ratio that is 19 days. Similarly, the
receivables days of T plc in 2018, 2019, and 2020 is 8, 6 ,6 days which are higher than average
industry ratio that is 2 days. So from the above, it can be critically evaluated that the company is
not optimising its inventory management and does not have an efficient cash in hand. So to
improve its working capital management it needs to use strict negotiating policy for reducing the
days of receivables and optimize its inventory control management.
Investment
Investment ratio determines that what the money is invested in company and what profit
incurs from it (Setiany, 2021). This shows how efficiently company is generating profits. This
includes price earning, Earning per share and dividend yield. From financial analysis of last
tabler-icon-diamond-filled.svg

Secure Best Marks with AI Grader

Need help grading? Try our AI Grader for instant feedback on your assignments.
Document Page
three years it is observed that earning per share of company in the year 2018 and 2019 was 23p
but in year 2020 shows 25p that determines companies value increased in last year that means
investors pays more for company's share. Thus earning per share gets increased. The price
earning ratio for the year 2018 was 20, 2019 it was 22 but while in the year 2020 it was 25,
comparing with industry averages that is 22. However, while making comparison from industry
analysis it is identified that, organization has attained industry averages that is 22 and can be
said that company is performing well, so investors may do investments. In addition, it can be
said that T. plc analysis of investment ratios shows that financial or investment ratio was overall
good that means company is in growth phase it generates more revenues than spending upon its
fixed assets.
Investments in T. plc
As an investors point of view it should invest in T.plc company looking towards the
overall performance of company on comparing it with industry averages of the past three years
data it is analysed that profit margins has increased as compared with industry averages. It was
analysed that liquidity ratio of company was in declining phase due to that company it
determines that by cutting down costs and give timely payments to receivables. When analysed
investment ratio of T. plc it is inclining and shows company is in growth phase that means
company have sufficient amount in terms of money. It generates higher revenues due to which
investors may interest to invest in this company and may enhance its market value that is
profitable for company. When look at the profit margins both net and gross also tends to incline.
The inventory holding & receivables days on comparing with industry averages is also less that
means organization sales is good and it easily pays off its receivables. Thus, it can be said that
the overall financial position of the company is good so a potential investor can invest in T. plc.
It determines that revenue generation is also good so it may result in growth in terms of future
aspect.
CONCLUSION
It can be concluded from the above report, that investors can invest in T plc after
analysing the profitability and liquidity. That is the company had a favourable liquidity and
Document Page
profitability and is available to meet the requirements of the shareholders and investors by
providing them efficient returns.
Document Page
REFERENCES
Books and journals
ANGADI, M., 2020. Statutory Liquidity Ratio and Cash Reserve Ratio–An overview. IJRAR-
International Journal of Research and Analytical Reviews (IJRAR). 7(3). pp.472-481.
Boisjoly and et.al., 2020. Working capital management: Financial and valuation impacts. Journal
of Business Research. 108. pp.1-8.
Husain, T. and Sunardi, N., 2020. Firm's Value Prediction Based on Profitability Ratios and
Dividend Policy. Finance & Economics Review. 2(2). pp.13-26.
Setiany, E., 2021. The Effect of Investment, Free Cash Flow, Earnings Management, and
Interest Coverage Ratio on Financial Distress. Journal of Social Science. 2(1). pp.67-73.
1
chevron_up_icon
1 out of 7
circle_padding
hide_on_mobile
zoom_out_icon
logo.png

Your All-in-One AI-Powered Toolkit for Academic Success.

Available 24*7 on WhatsApp / Email

[object Object]