Statistical Analysis: T-Test on Surface Area of Dog's Mercury Leaves
VerifiedAdded on 2021/01/02
|5
|725
|264
Homework Assignment
AI Summary
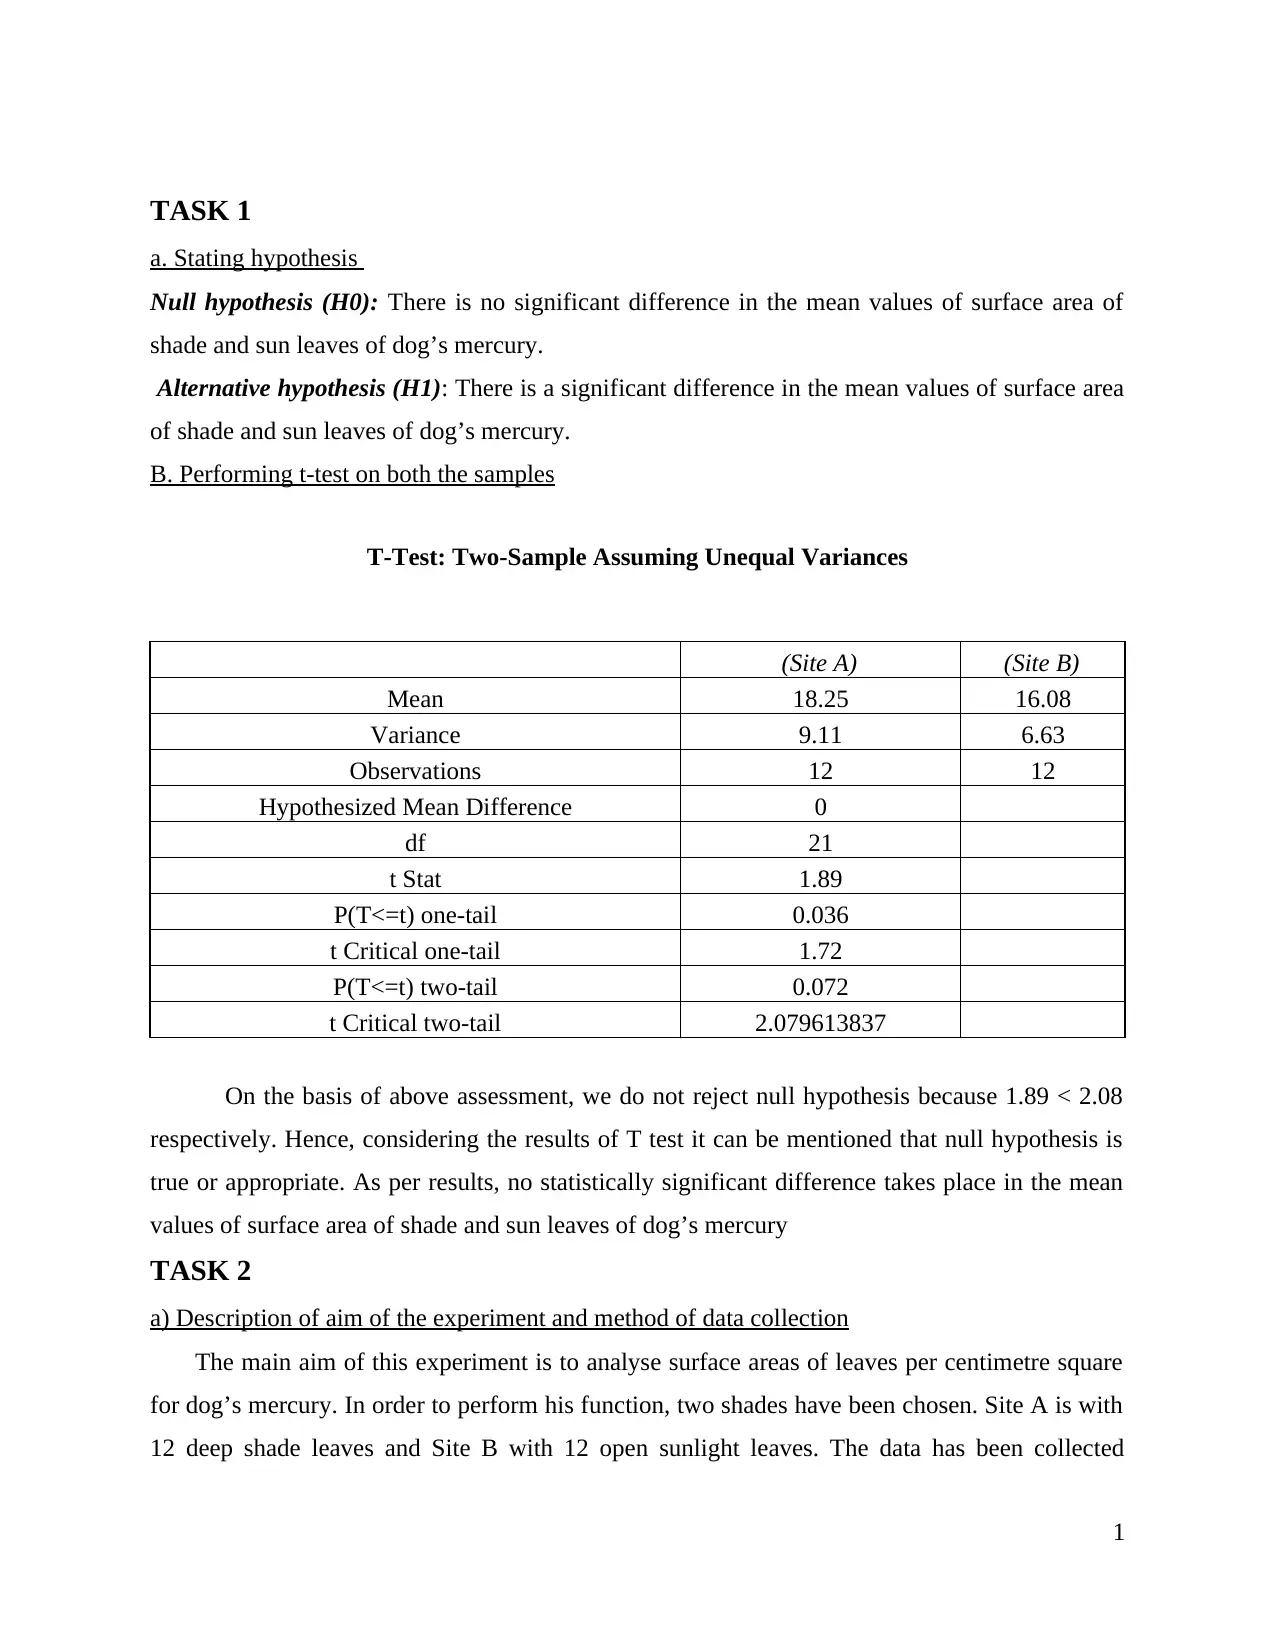
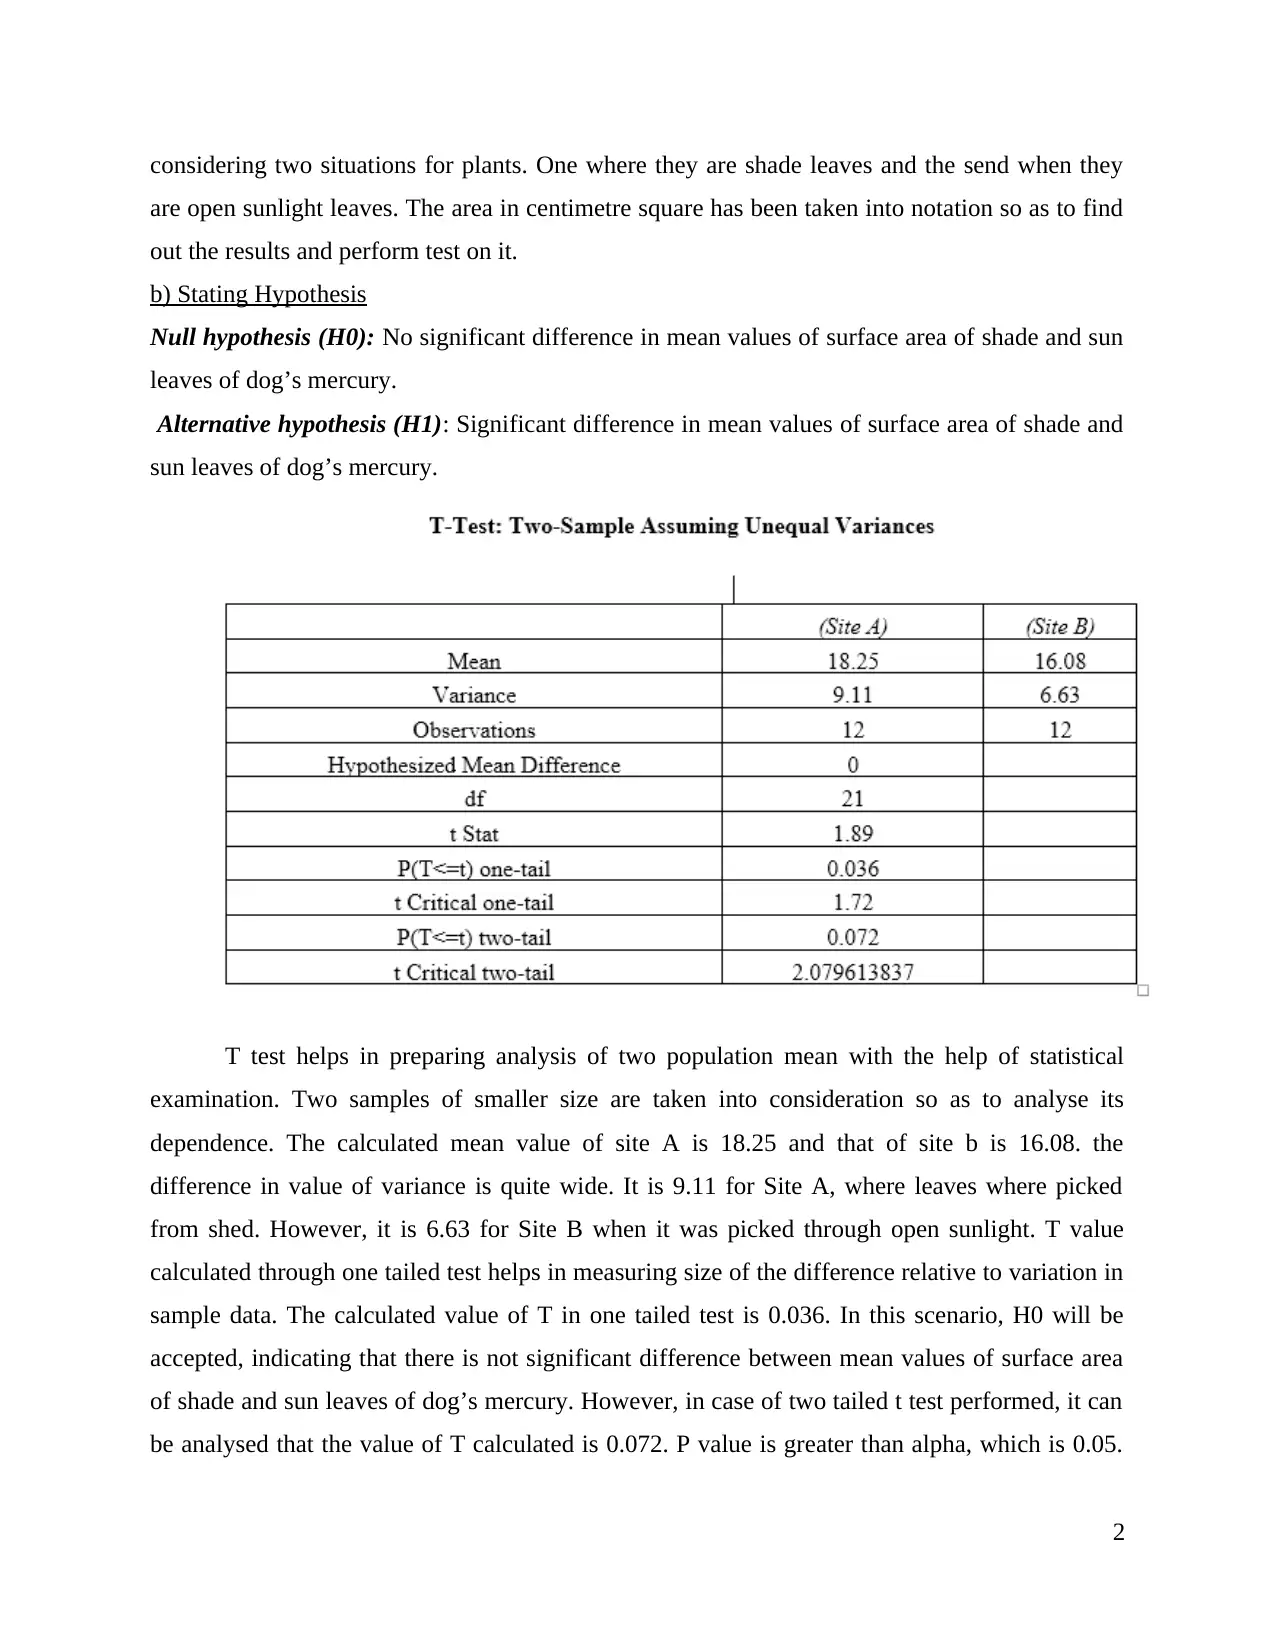
This assignment focuses on performing and interpreting a t-test to analyze the surface area of dog's mercury leaves. The student begins by stating the null and alternative hypotheses, then performs a t-test on two samples: shade leaves and sun leaves. The assignment includes calculations of means, variances, and t-statistics, along with the interpretation of p-values to determine whether to reject or fail to reject the null hypothesis. The experiment's aim is described, along with the method of data collection, followed by a restatement of the hypotheses. The importance of the significance value in the t-test is also discussed, highlighting its role in indicating the risk associated with the results and guiding the acceptance or rejection of the hypotheses based on the p-value compared to the alpha value. The analysis concludes that there is no statistically significant difference in the mean values of the surface area of shade and sun leaves of dog’s mercury.
1 out of 5
Related Documents


Your All-in-One AI-Powered Toolkit for Academic Success.
+13062052269
info@desklib.com
Available 24*7 on WhatsApp / Email
![[object Object]](/_next/static/media/star-bottom.7253800d.svg)
Copyright © 2020–2026 A2Z Services. All Rights Reserved. Developed and managed by ZUCOL.