Statistical Analysis: T-Test for Income Differences, SPSS
VerifiedAdded on 2022/09/17
|3
|614
|22
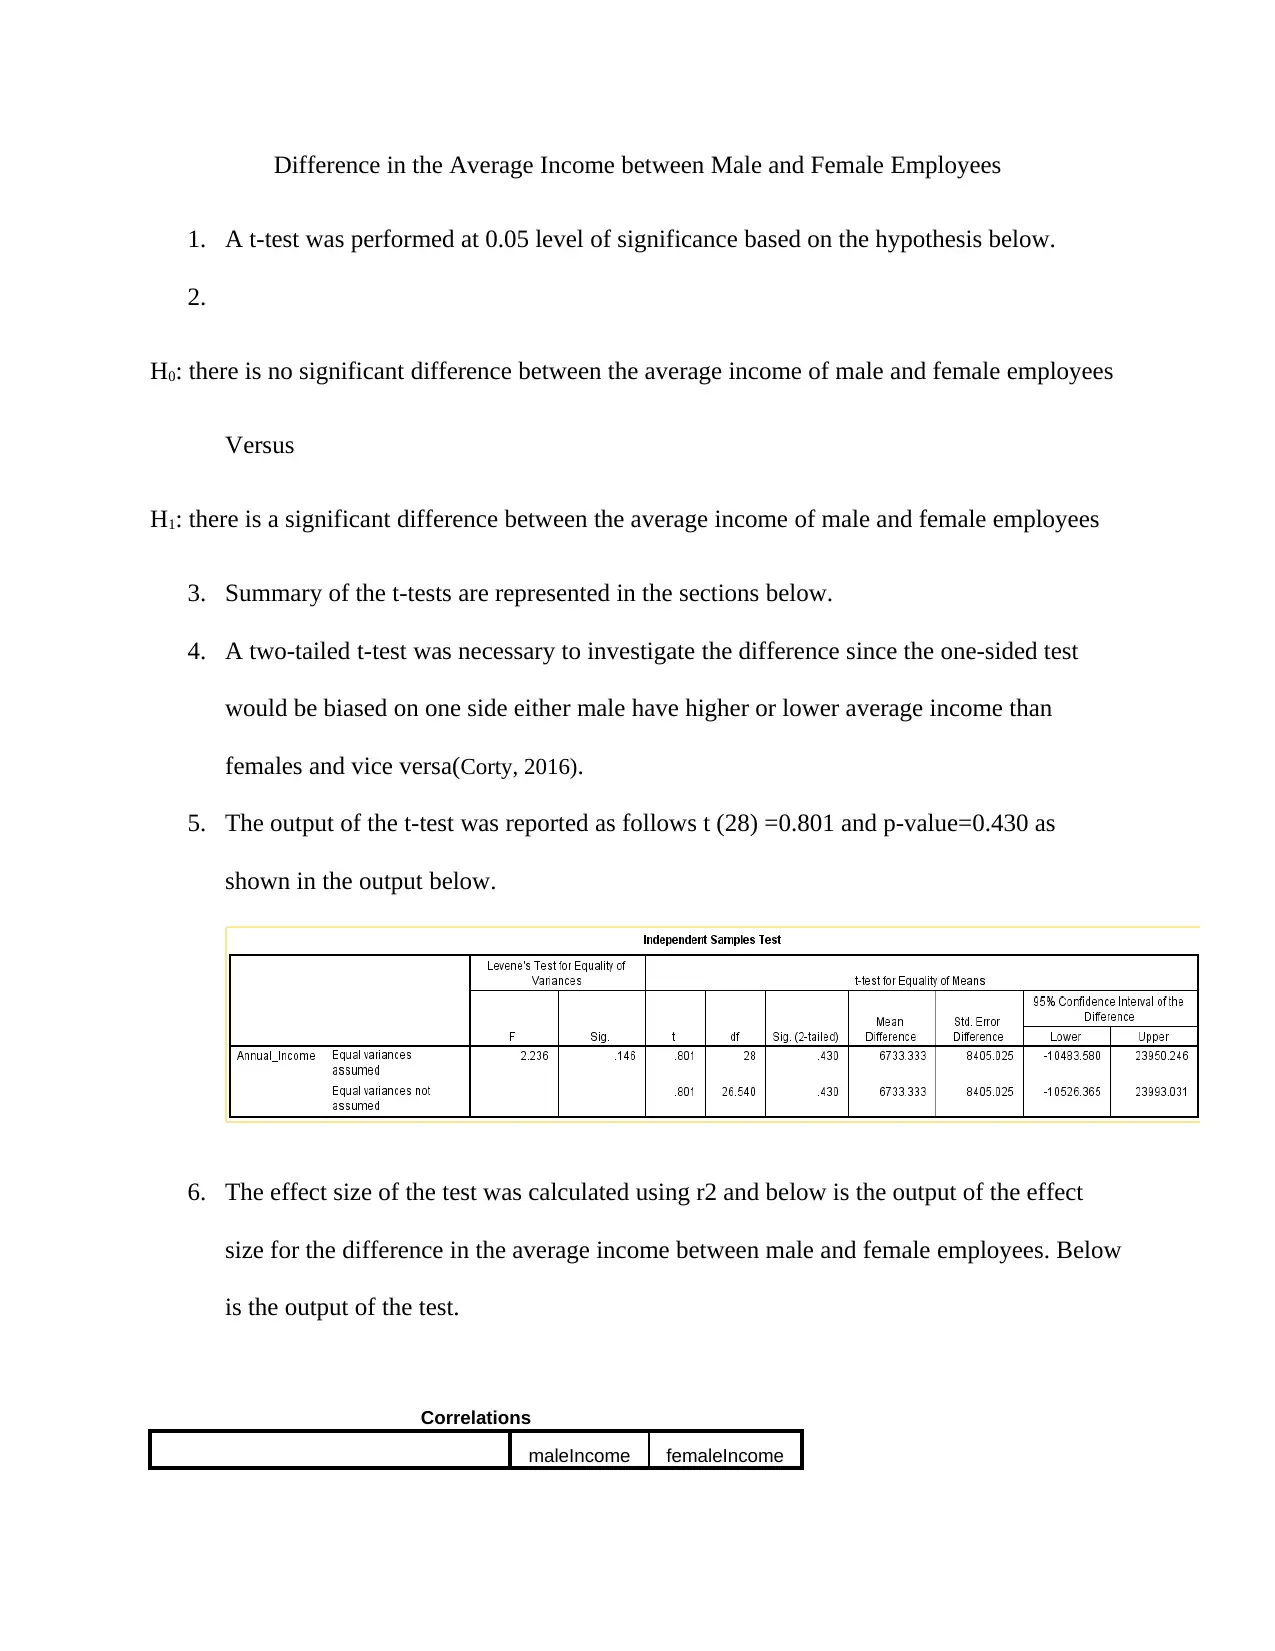
Homework Assignment
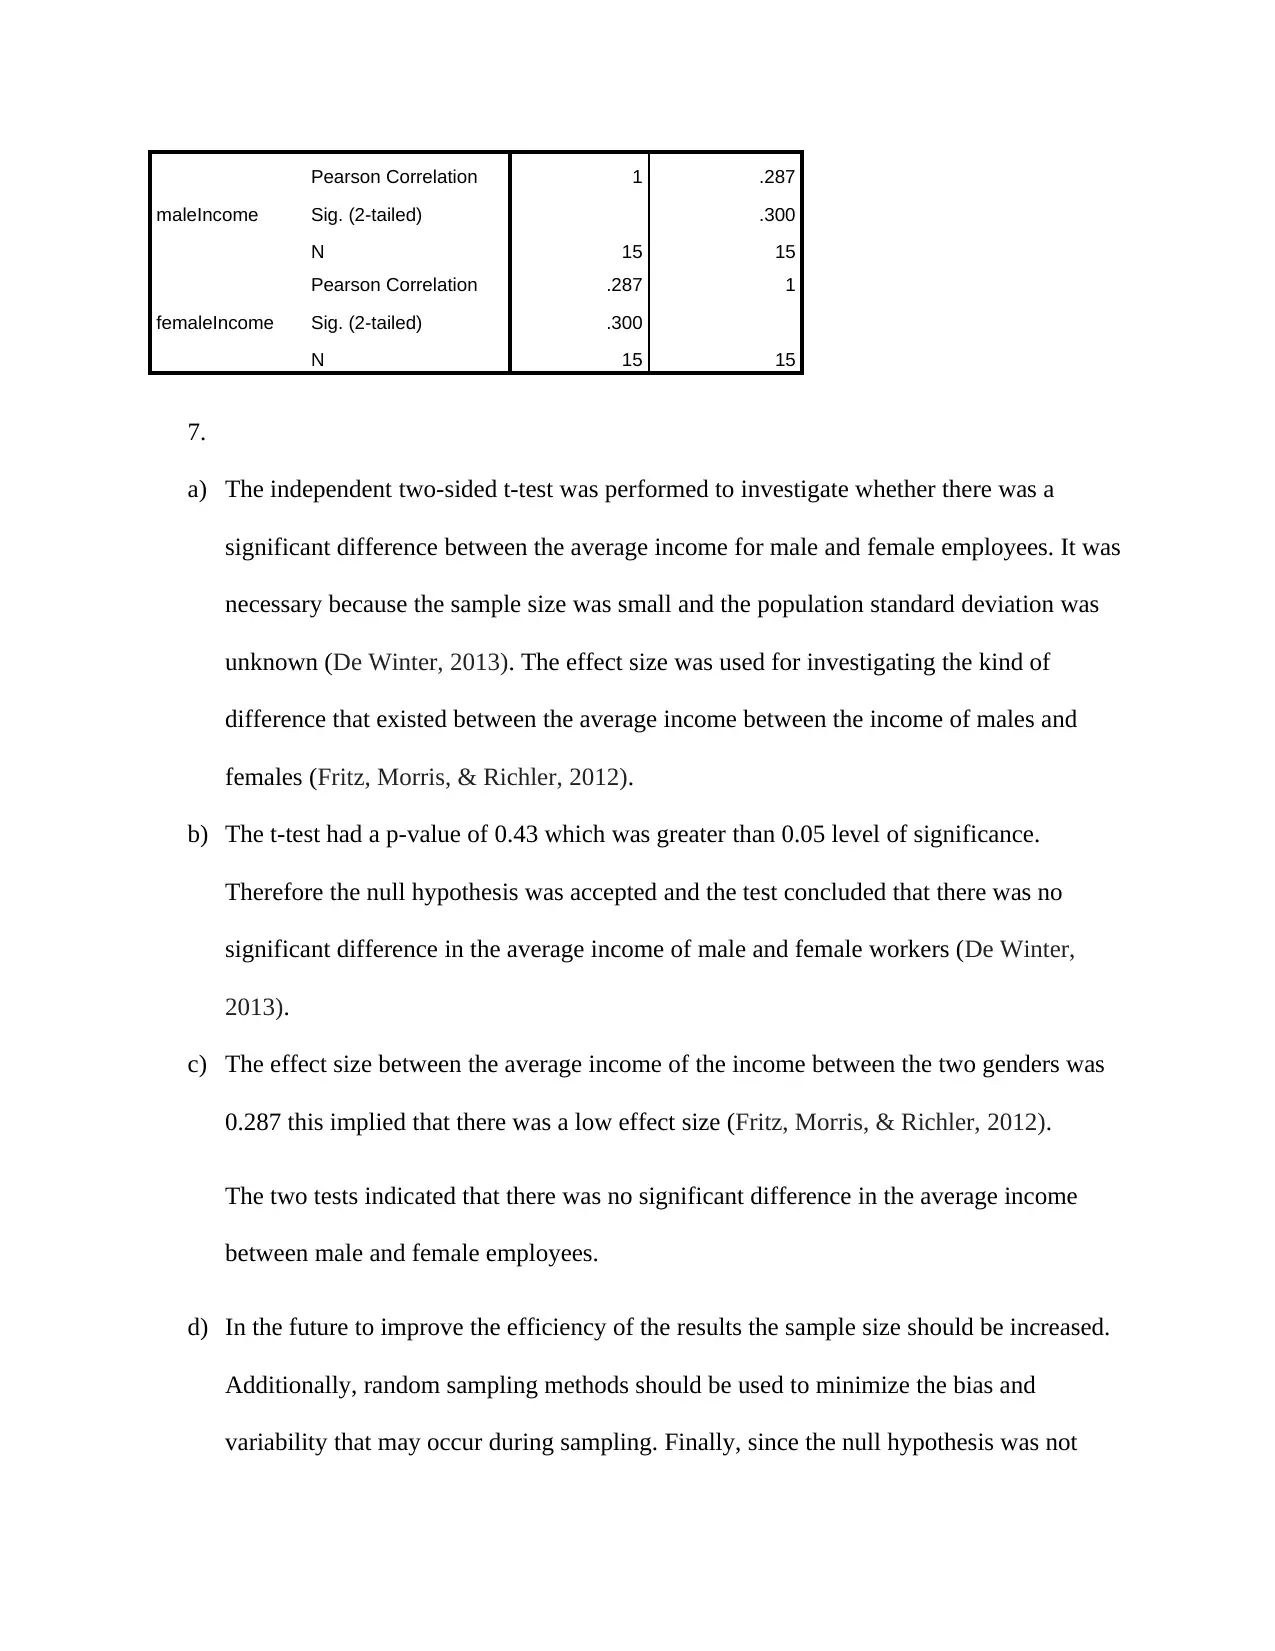
AI Summary
This assignment applies the t-test to analyze income differences between male and female employees using a sample dataset. The student used IBM SPSS Statistics and the "Example Dataset" to assess the hypothesis: "Men and women have different incomes in this city." The solution includes the t-test output, calculations, and a discussion of the appropriate t-test type, including the rationale for using a two-tailed test. The student calculated the test statistic, critical value, and effect size (r2), and interpreted the results by stating the reason for the study, presenting the main results, explaining the results' meaning, and suggesting future research directions. The analysis concluded that there was no significant difference in the average income of male and female workers, and the student recommended increasing the sample size and using random sampling methods for future research.
1 out of 3
Related Documents


Your All-in-One AI-Powered Toolkit for Academic Success.
+13062052269
info@desklib.com
Available 24*7 on WhatsApp / Email
![[object Object]](/_next/static/media/star-bottom.7253800d.svg)
Copyright © 2020–2026 A2Z Services. All Rights Reserved. Developed and managed by ZUCOL.