Comparative Analysis of Intervention Programs Using T-Test Statistics

Verified

Added on  2022/09/26

|4
|492
|21
Report
AI Summary
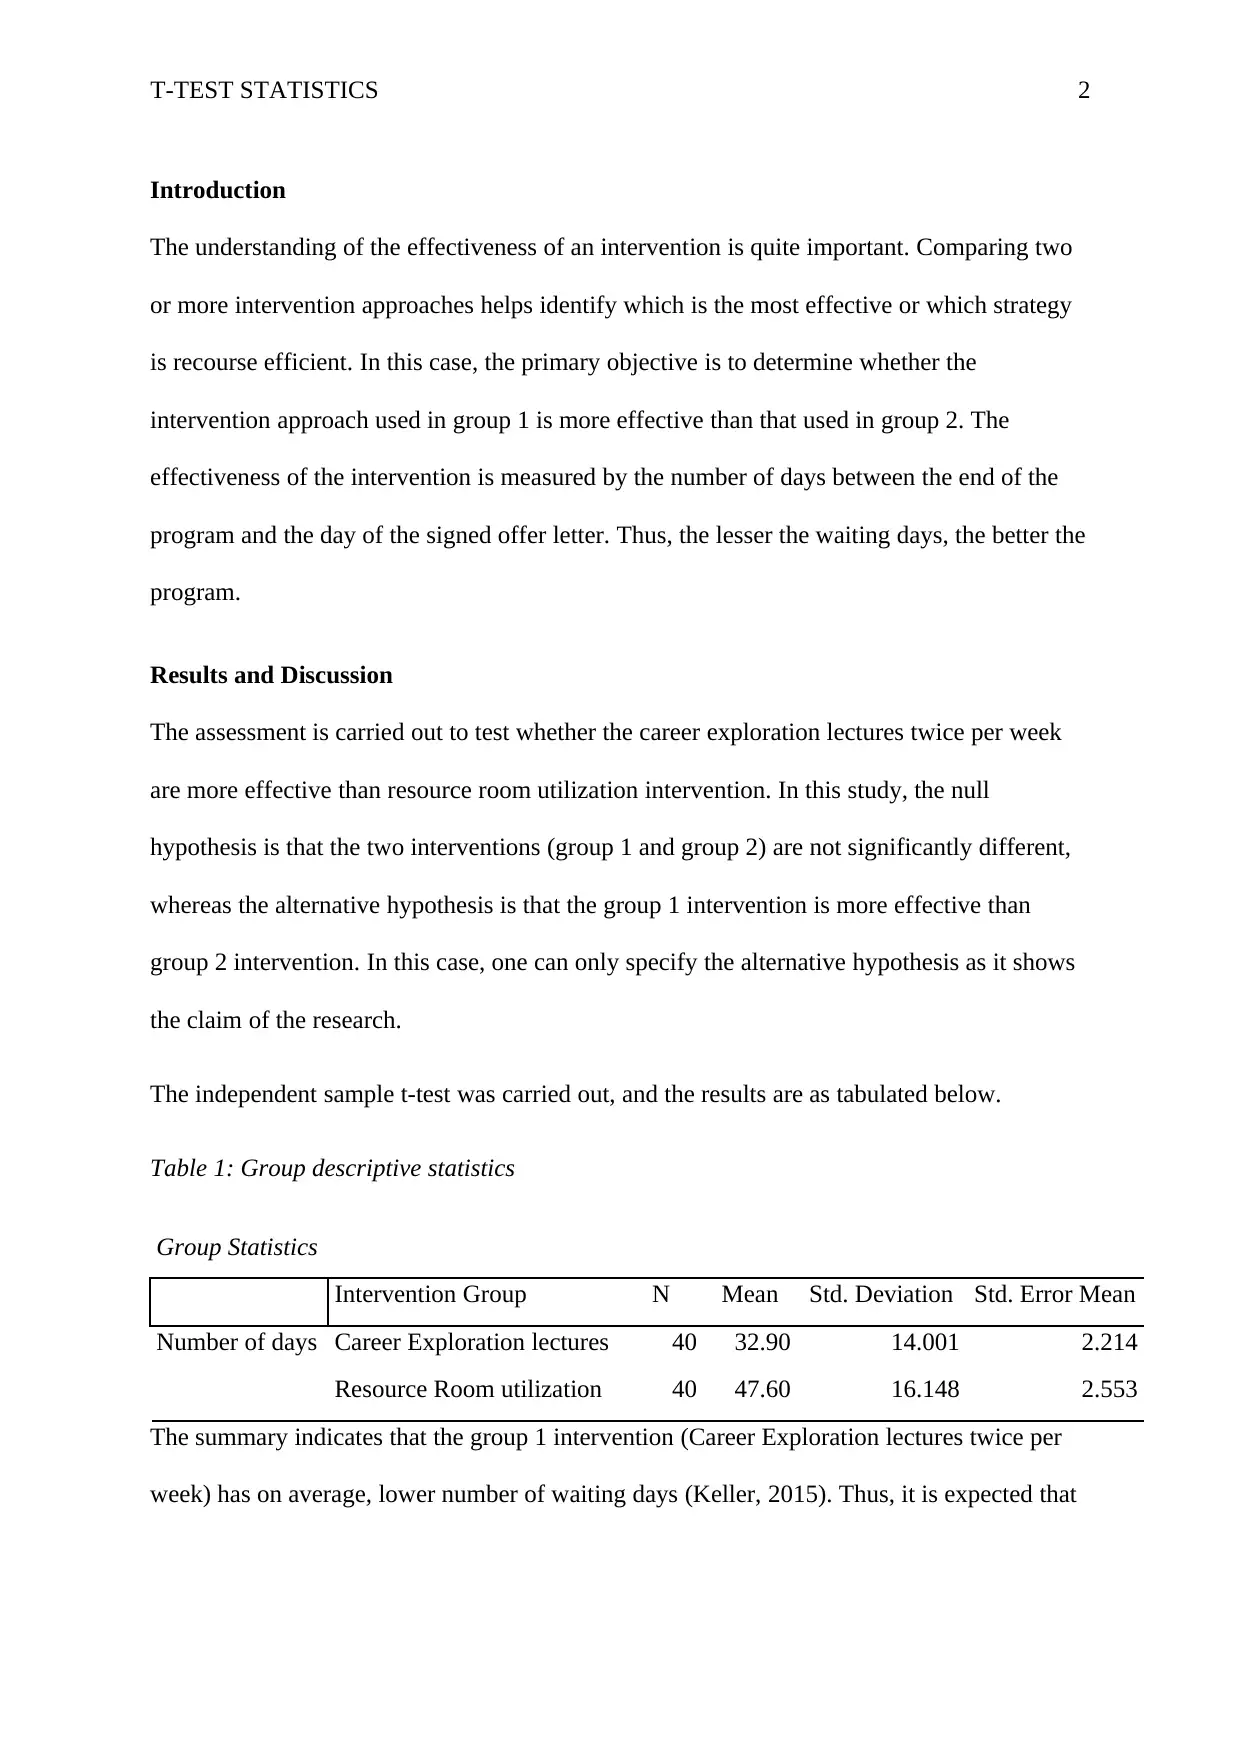
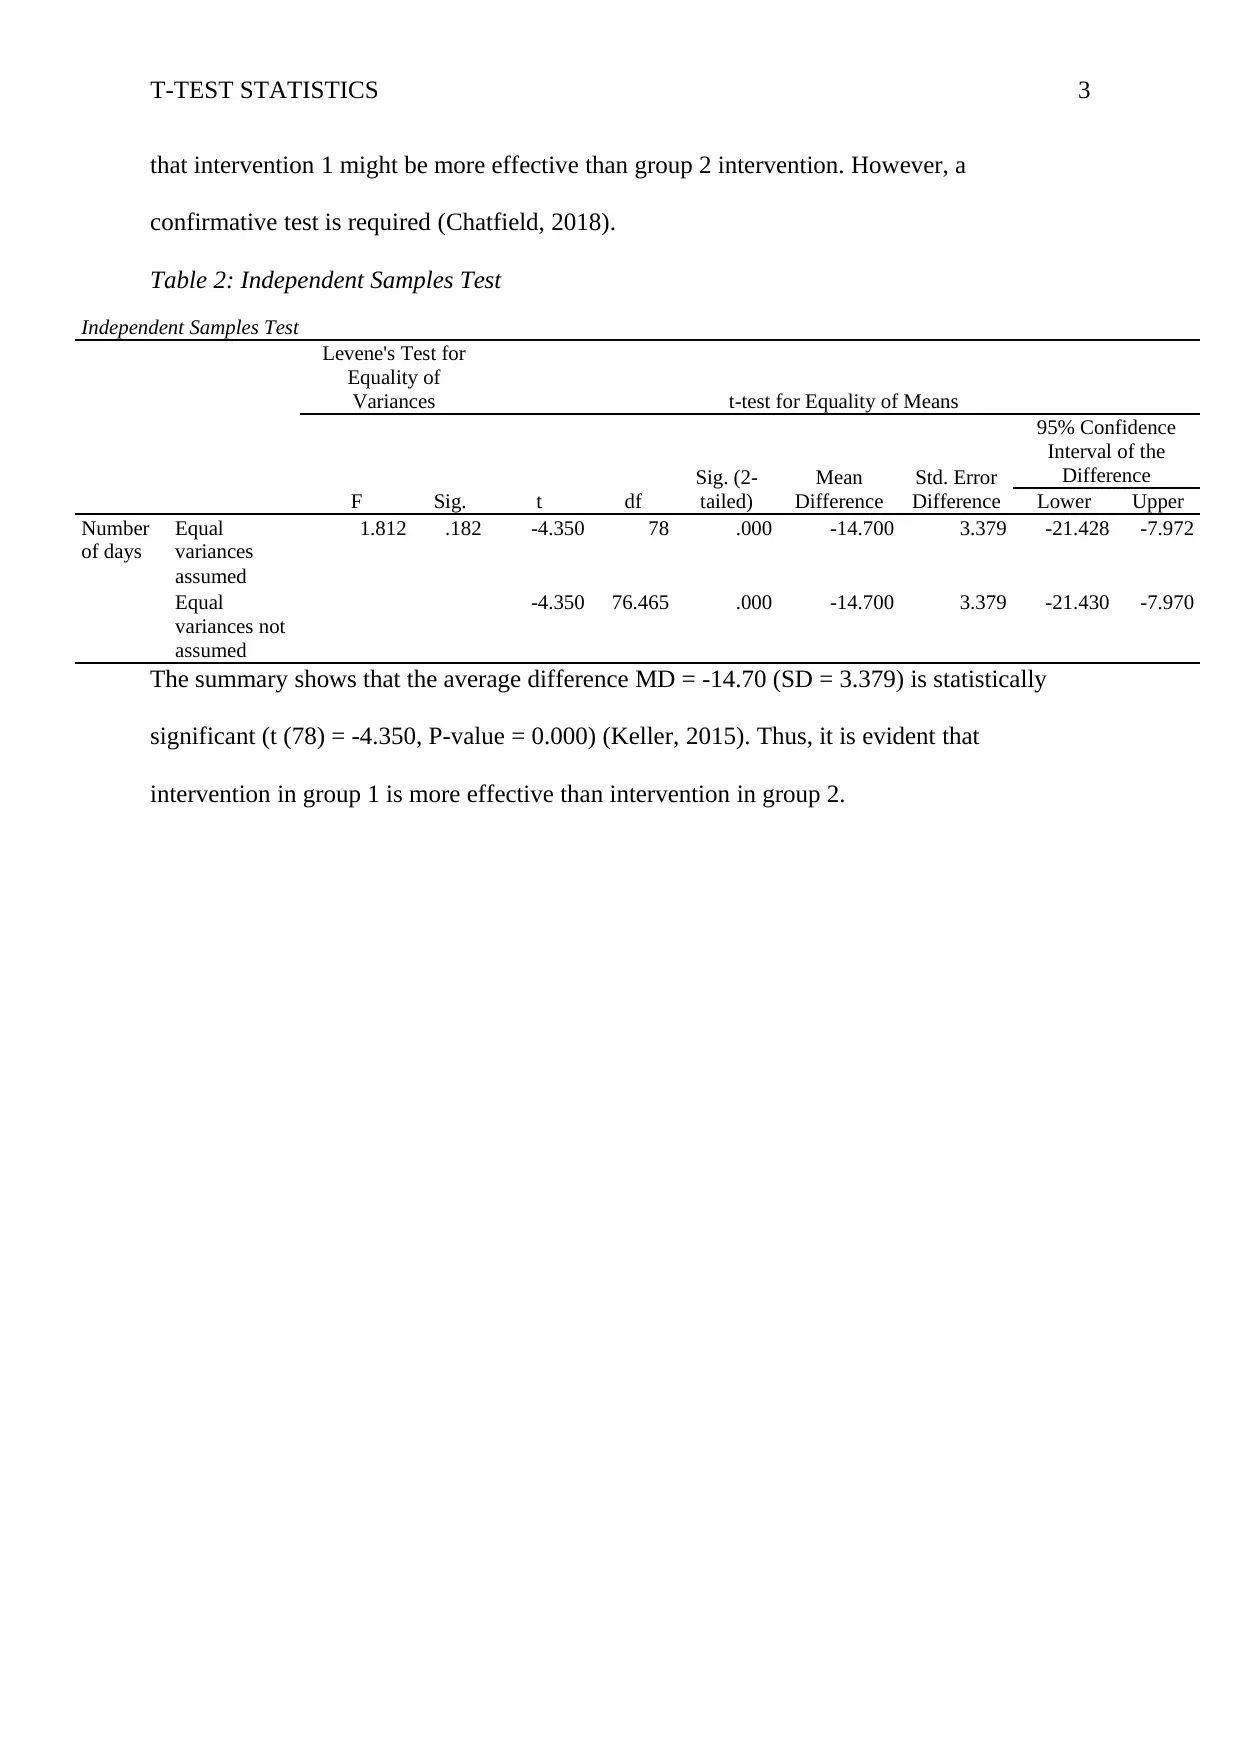
This report presents a comparative analysis of two intervention programs using the t-test statistical method. The study aims to determine the effectiveness of career exploration lectures compared to resource room utilization by analyzing the number of waiting days. The analysis includes descriptive statistics, independent samples t-tests, and a discussion of the results. The results indicate that the career exploration lectures are more effective, with a statistically significant mean difference (MD = -14.70, p-value = 0.000). The report discusses the implications of the findings, providing insights into the effectiveness of the interventions and the application of t-test statistics in program evaluation. The report includes tables summarizing the group statistics and the independent samples t-test results, along with references to relevant statistical resources.
Document Page
Running head: T-TEST STATISTICS 1
T-Test statistics
Name:
Institution:
tabler-icon-diamond-filled.svg

Paraphrase This Document

Need a fresh take? Get an instant paraphrase of this document with our AI Paraphraser
Document Page
T-TEST STATISTICS 2
Introduction
The understanding of the effectiveness of an intervention is quite important. Comparing two
or more intervention approaches helps identify which is the most effective or which strategy
is recourse efficient. In this case, the primary objective is to determine whether the
intervention approach used in group 1 is more effective than that used in group 2. The
effectiveness of the intervention is measured by the number of days between the end of the
program and the day of the signed offer letter. Thus, the lesser the waiting days, the better the
program.
Results and Discussion
The assessment is carried out to test whether the career exploration lectures twice per week
are more effective than resource room utilization intervention. In this study, the null
hypothesis is that the two interventions (group 1 and group 2) are not significantly different,
whereas the alternative hypothesis is that the group 1 intervention is more effective than
group 2 intervention. In this case, one can only specify the alternative hypothesis as it shows
the claim of the research.
The independent sample t-test was carried out, and the results are as tabulated below.
Table 1: Group descriptive statistics
Group Statistics
Intervention Group N Mean Std. Deviation Std. Error Mean
Number of days Career Exploration lectures 40 32.90 14.001 2.214
Resource Room utilization 40 47.60 16.148 2.553
The summary indicates that the group 1 intervention (Career Exploration lectures twice per
week) has on average, lower number of waiting days (Keller, 2015). Thus, it is expected that
Document Page
T-TEST STATISTICS 3
that intervention 1 might be more effective than group 2 intervention. However, a
confirmative test is required (Chatfield, 2018).
Table 2: Independent Samples Test
Independent Samples Test
Levene's Test for
Equality of
Variances t-test for Equality of Means
F Sig. t df
Sig. (2-
tailed)
Mean
Difference
Std. Error
Difference
95% Confidence
Interval of the
Difference
Lower Upper
Number
of days
Equal
variances
assumed
1.812 .182 -4.350 78 .000 -14.700 3.379 -21.428 -7.972
Equal
variances not
assumed
-4.350 76.465 .000 -14.700 3.379 -21.430 -7.970
The summary shows that the average difference MD = -14.70 (SD = 3.379) is statistically
significant (t (78) = -4.350, P-value = 0.000) (Keller, 2015). Thus, it is evident that
intervention in group 1 is more effective than intervention in group 2.
Document Page
T-TEST STATISTICS 4
References
Chatfield, C. (2018). Statistics for technology: a course in applied statistics (3rd Edition ed.).
New York: Routledge.
Keller, G. (2015). Statistics for Management and Economics, Abbreviated. Cengage
Learning.
chevron_up_icon
1 out of 4
circle_padding
hide_on_mobile
zoom_out_icon
[object Object]