MAT-250A: Statistical Inference and Hypothesis Testing using T-Tests

Verified

Added on  2022/09/26

|4
|570
|22
Homework Assignment
AI Summary
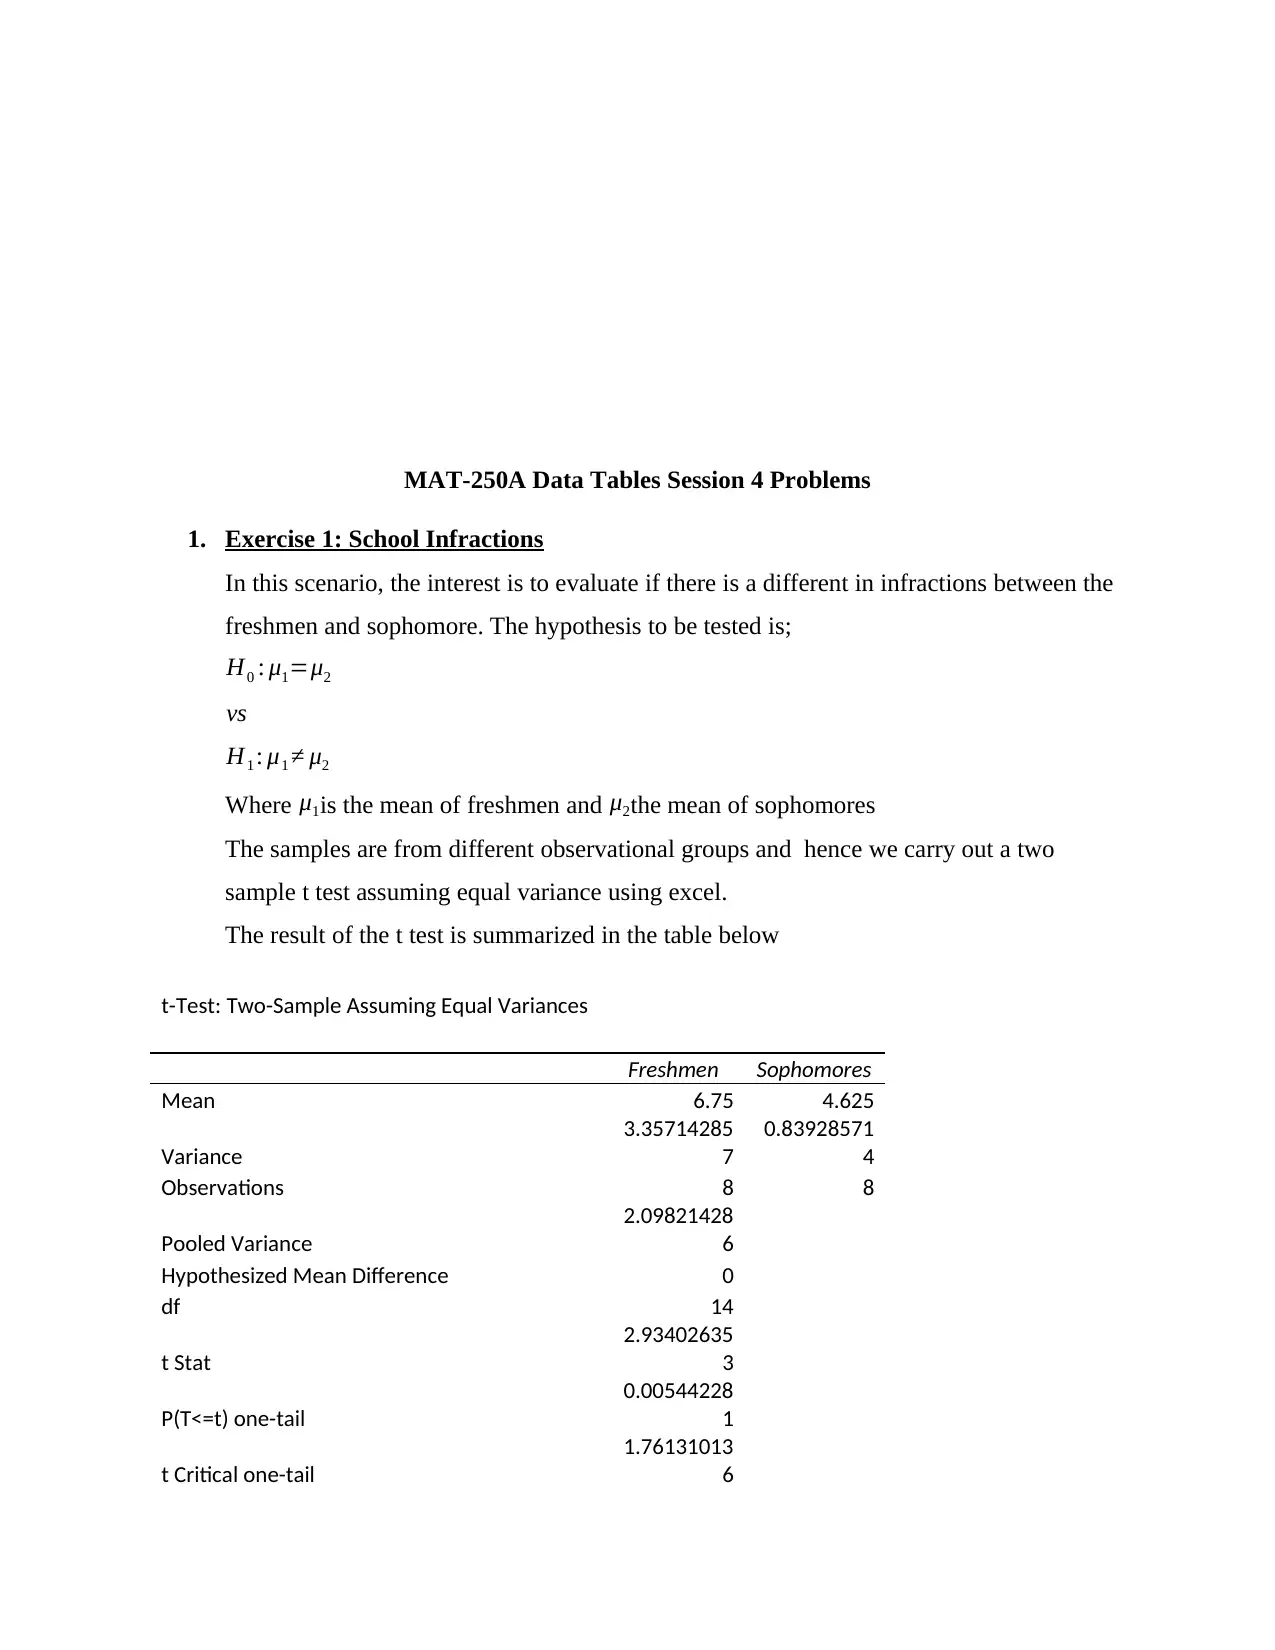
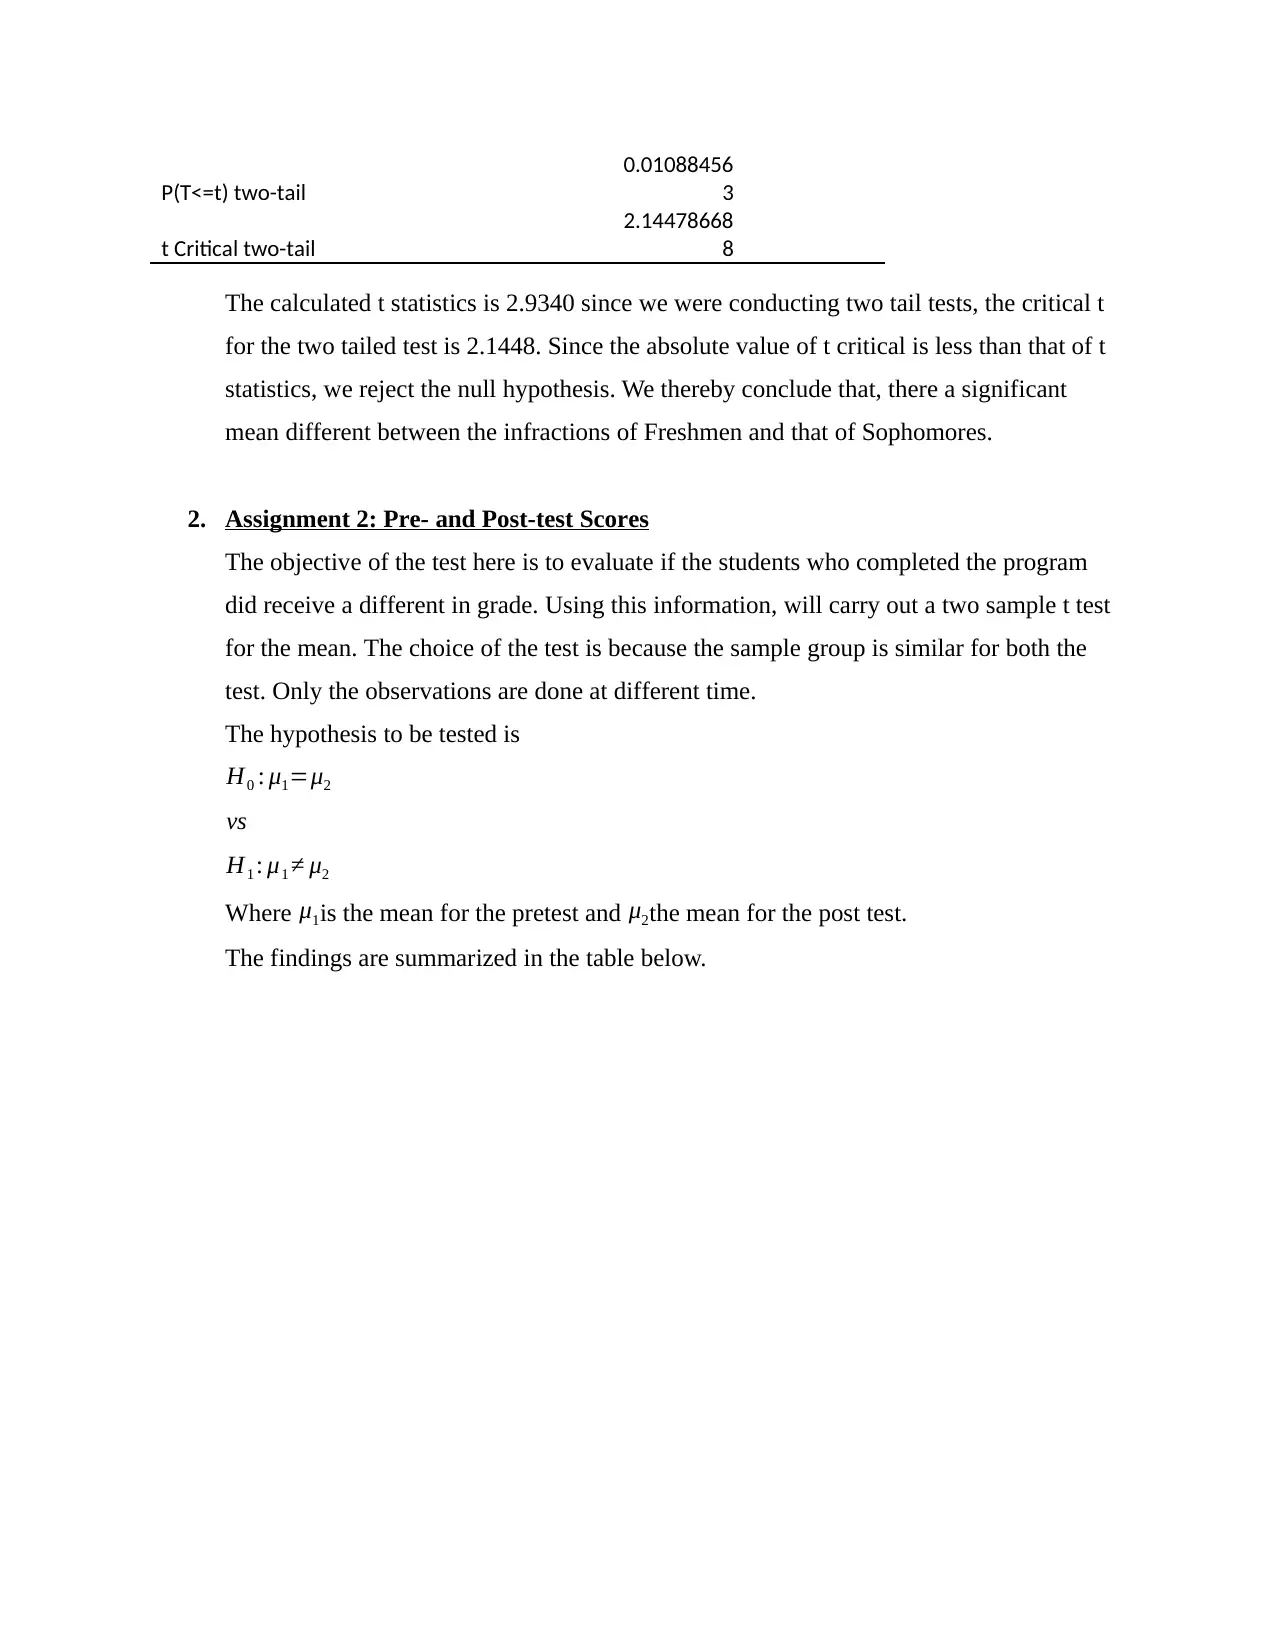
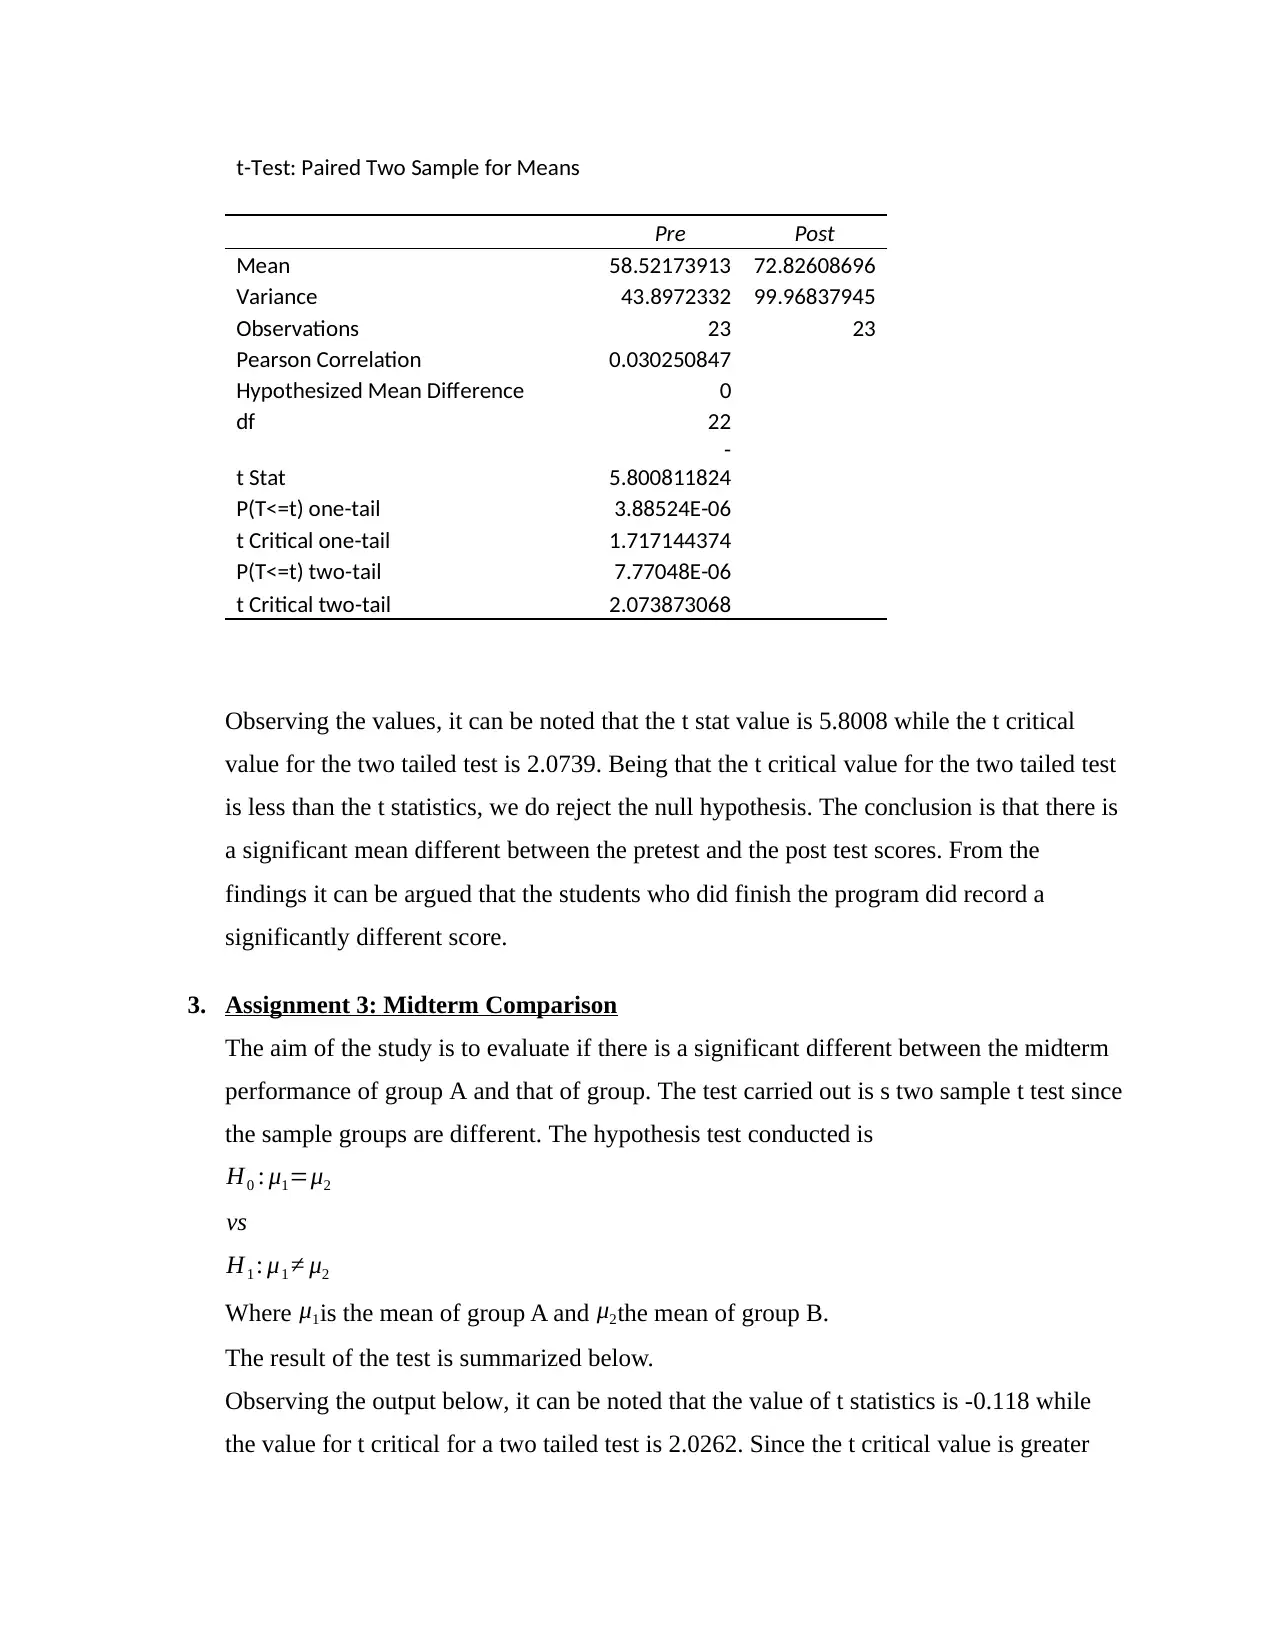
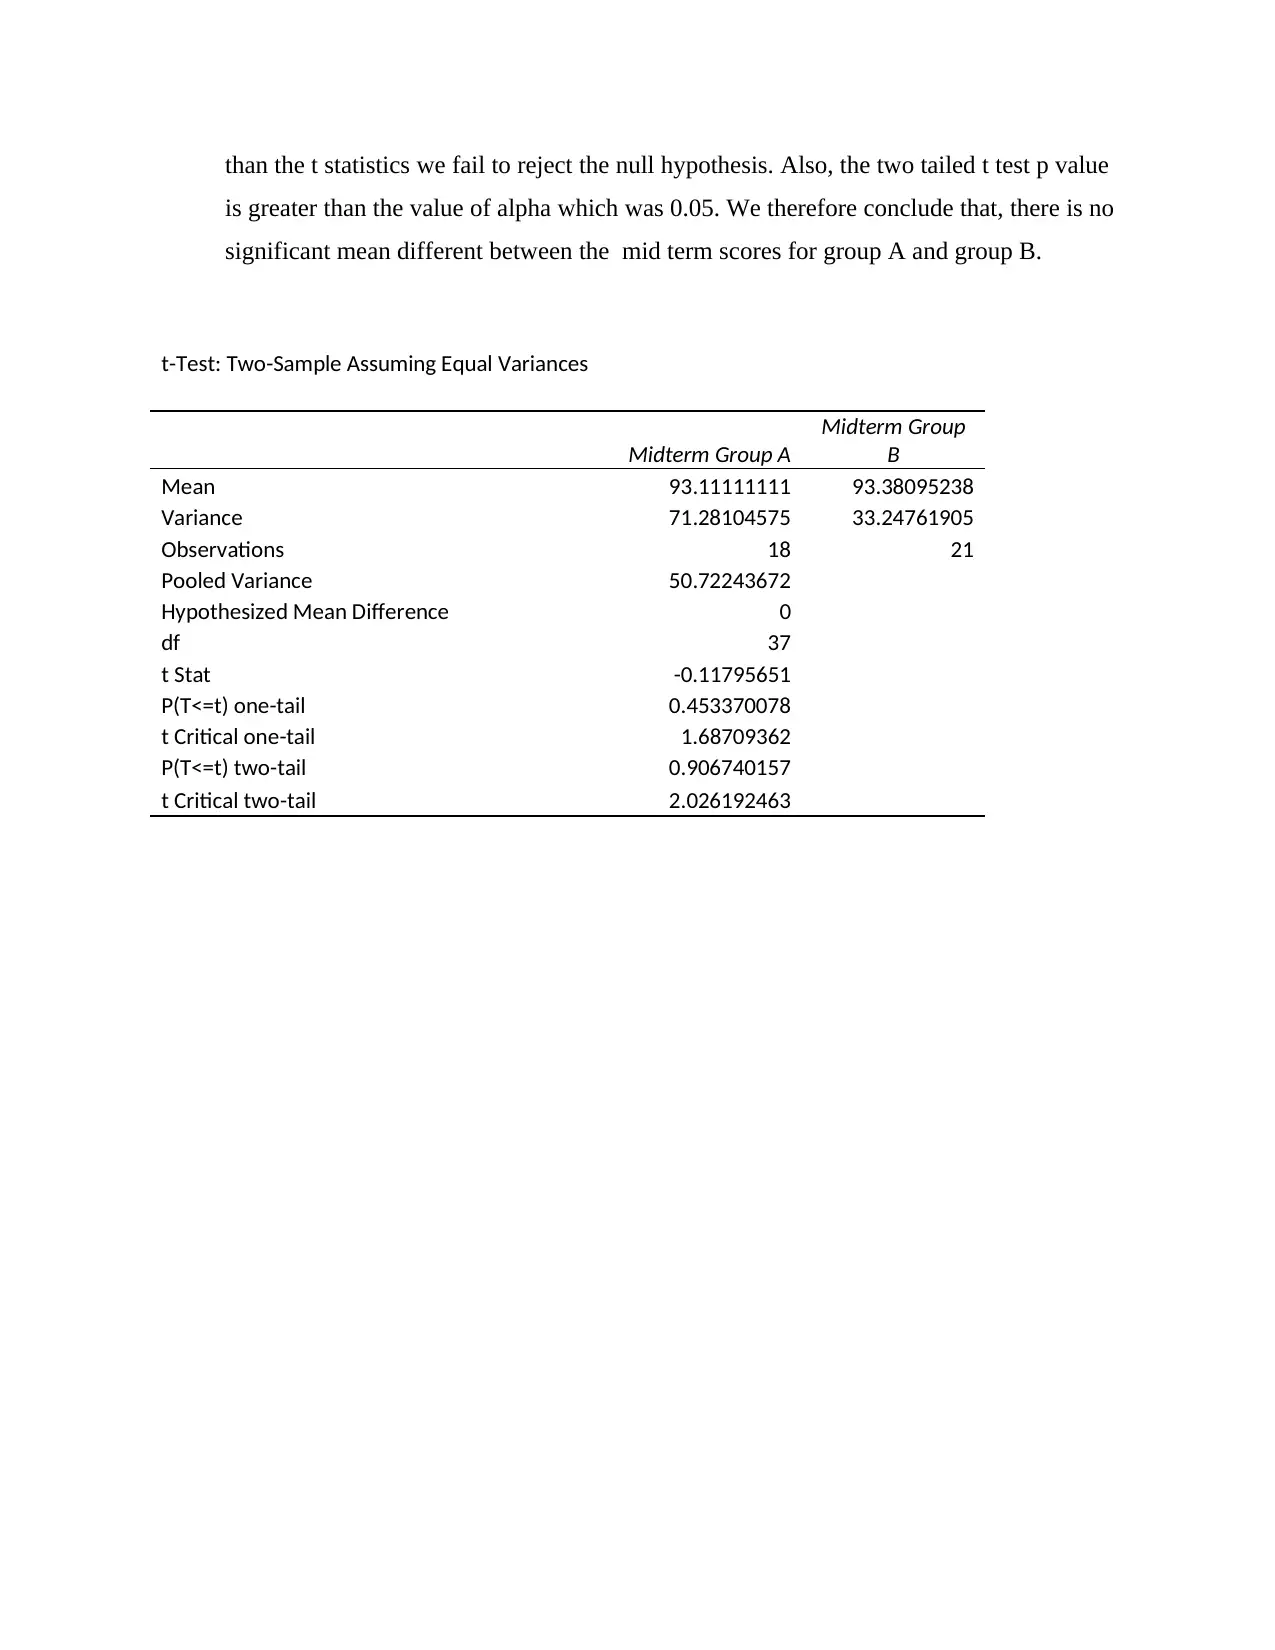
This assignment solution presents the analysis of three different scenarios using t-tests. The first problem examines the difference in school infractions between freshmen and sophomores using an independent samples t-test, concluding a significant difference exists. The second problem evaluates the impact of a program on student grades, utilizing a paired samples t-test to determine a significant difference between pre- and post-test scores. The final problem compares midterm performance between two groups, employing an independent samples t-test and concluding that there is no significant difference between the mean midterm scores of the two groups. The solutions include the t-test results, interpretations, and conclusions based on the calculated t-statistics and critical values.
Document Page
MAT-250A Data Tables Session 4 Problems
1. Exercise 1: School Infractions
In this scenario, the interest is to evaluate if there is a different in infractions between the
freshmen and sophomore. The hypothesis to be tested is;
H0 : μ1=μ2
vs
H1 : μ1 μ2
Where μ1is the mean of freshmen and μ2the mean of sophomores
The samples are from different observational groups and hence we carry out a two
sample t test assuming equal variance using excel.
The result of the t test is summarized in the table below
t-Test: Two-Sample Assuming Equal Variances
Freshmen Sophomores
Mean 6.75 4.625
Variance
3.35714285
7
0.83928571
4
Observations 8 8
Pooled Variance
2.09821428
6
Hypothesized Mean Difference 0
df 14
t Stat
2.93402635
3
P(T<=t) one-tail
0.00544228
1
t Critical one-tail
1.76131013
6
tabler-icon-diamond-filled.svg

Paraphrase This Document

Need a fresh take? Get an instant paraphrase of this document with our AI Paraphraser
Document Page
P(T<=t) two-tail
0.01088456
3
t Critical two-tail
2.14478668
8
The calculated t statistics is 2.9340 since we were conducting two tail tests, the critical t
for the two tailed test is 2.1448. Since the absolute value of t critical is less than that of t
statistics, we reject the null hypothesis. We thereby conclude that, there a significant
mean different between the infractions of Freshmen and that of Sophomores.
2. Assignment 2: Pre- and Post-test Scores
The objective of the test here is to evaluate if the students who completed the program
did receive a different in grade. Using this information, will carry out a two sample t test
for the mean. The choice of the test is because the sample group is similar for both the
test. Only the observations are done at different time.
The hypothesis to be tested is
H0 : μ1=μ2
vs
H1 : μ1 μ2
Where μ1is the mean for the pretest and μ2the mean for the post test.
The findings are summarized in the table below.
Document Page
t-Test: Paired Two Sample for Means
Pre Post
Mean 58.52173913 72.82608696
Variance 43.8972332 99.96837945
Observations 23 23
Pearson Correlation 0.030250847
Hypothesized Mean Difference 0
df 22
t Stat
-
5.800811824
P(T<=t) one-tail 3.88524E-06
t Critical one-tail 1.717144374
P(T<=t) two-tail 7.77048E-06
t Critical two-tail 2.073873068
Observing the values, it can be noted that the t stat value is 5.8008 while the t critical
value for the two tailed test is 2.0739. Being that the t critical value for the two tailed test
is less than the t statistics, we do reject the null hypothesis. The conclusion is that there is
a significant mean different between the pretest and the post test scores. From the
findings it can be argued that the students who did finish the program did record a
significantly different score.
3. Assignment 3: Midterm Comparison
The aim of the study is to evaluate if there is a significant different between the midterm
performance of group A and that of group. The test carried out is s two sample t test since
the sample groups are different. The hypothesis test conducted is
H0 : μ1=μ2
vs
H1 : μ1 μ2
Where μ1is the mean of group A and μ2the mean of group B.
The result of the test is summarized below.
Observing the output below, it can be noted that the value of t statistics is -0.118 while
the value for t critical for a two tailed test is 2.0262. Since the t critical value is greater
Document Page
than the t statistics we fail to reject the null hypothesis. Also, the two tailed t test p value
is greater than the value of alpha which was 0.05. We therefore conclude that, there is no
significant mean different between the mid term scores for group A and group B.
t-Test: Two-Sample Assuming Equal Variances
Midterm Group A
Midterm Group
B
Mean 93.11111111 93.38095238
Variance 71.28104575 33.24761905
Observations 18 21
Pooled Variance 50.72243672
Hypothesized Mean Difference 0
df 37
t Stat -0.11795651
P(T<=t) one-tail 0.453370078
t Critical one-tail 1.68709362
P(T<=t) two-tail 0.906740157
t Critical two-tail 2.026192463
chevron_up_icon
1 out of 4
circle_padding
hide_on_mobile
zoom_out_icon
[object Object]