Comprehensive Financial Analysis of JB Hi-Fi - TACC101 Assignment
VerifiedAdded on 2023/06/03
|11
|1259
|255
Homework Assignment
AI Summary
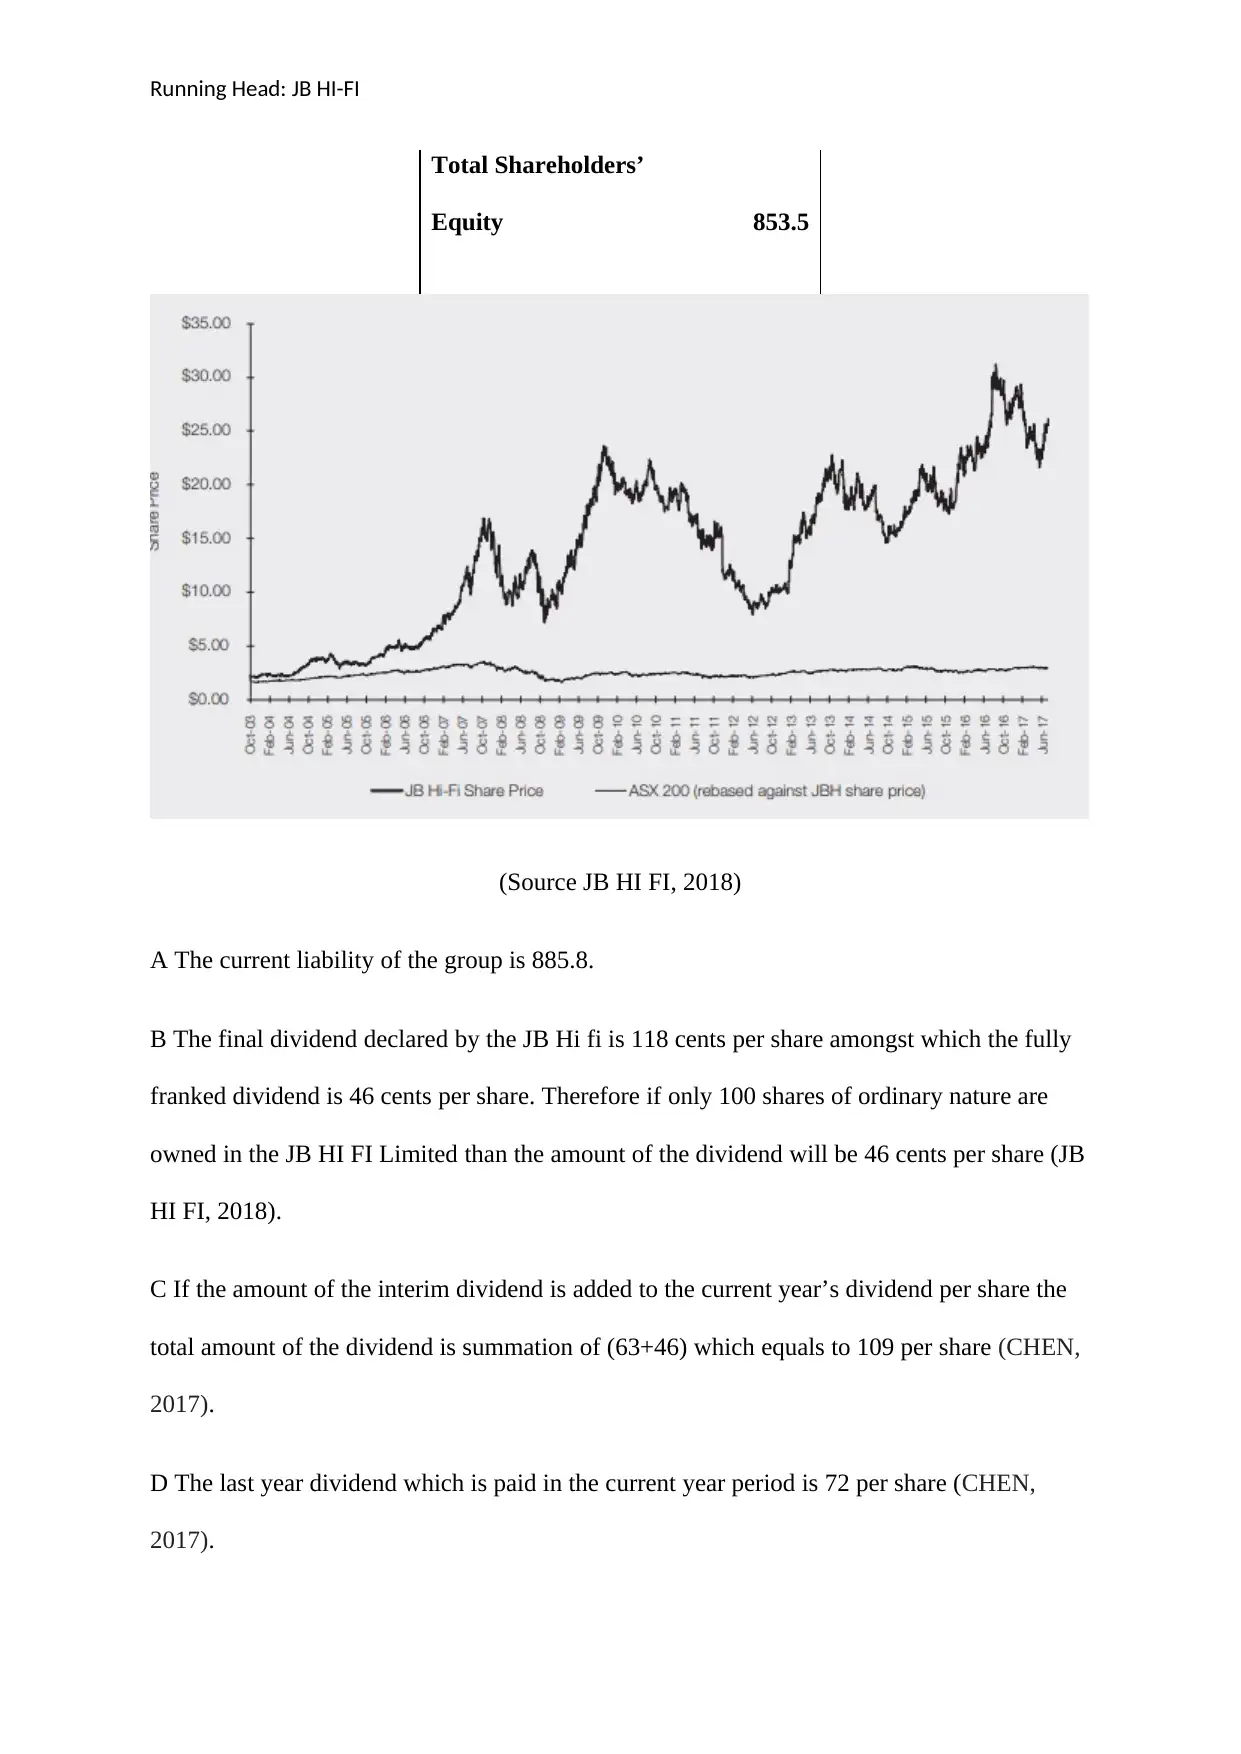
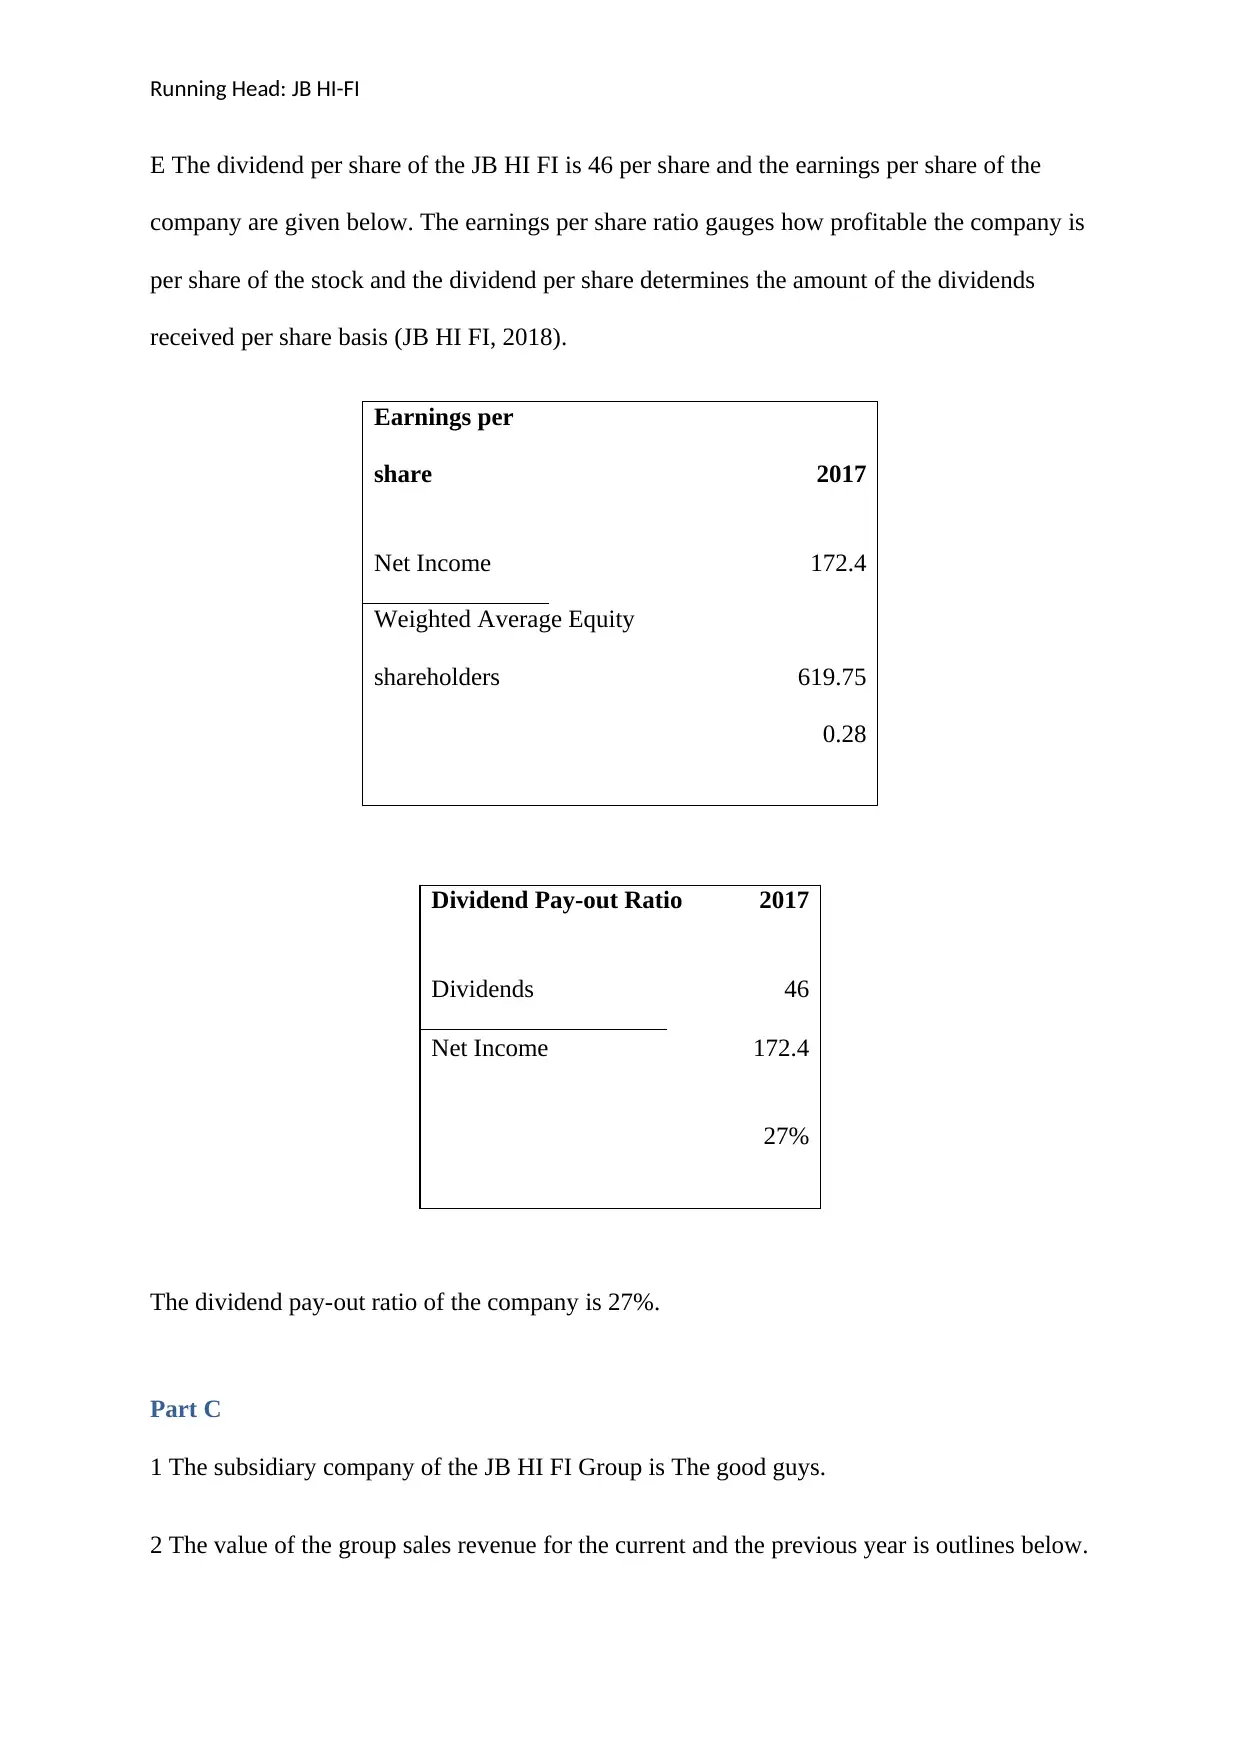
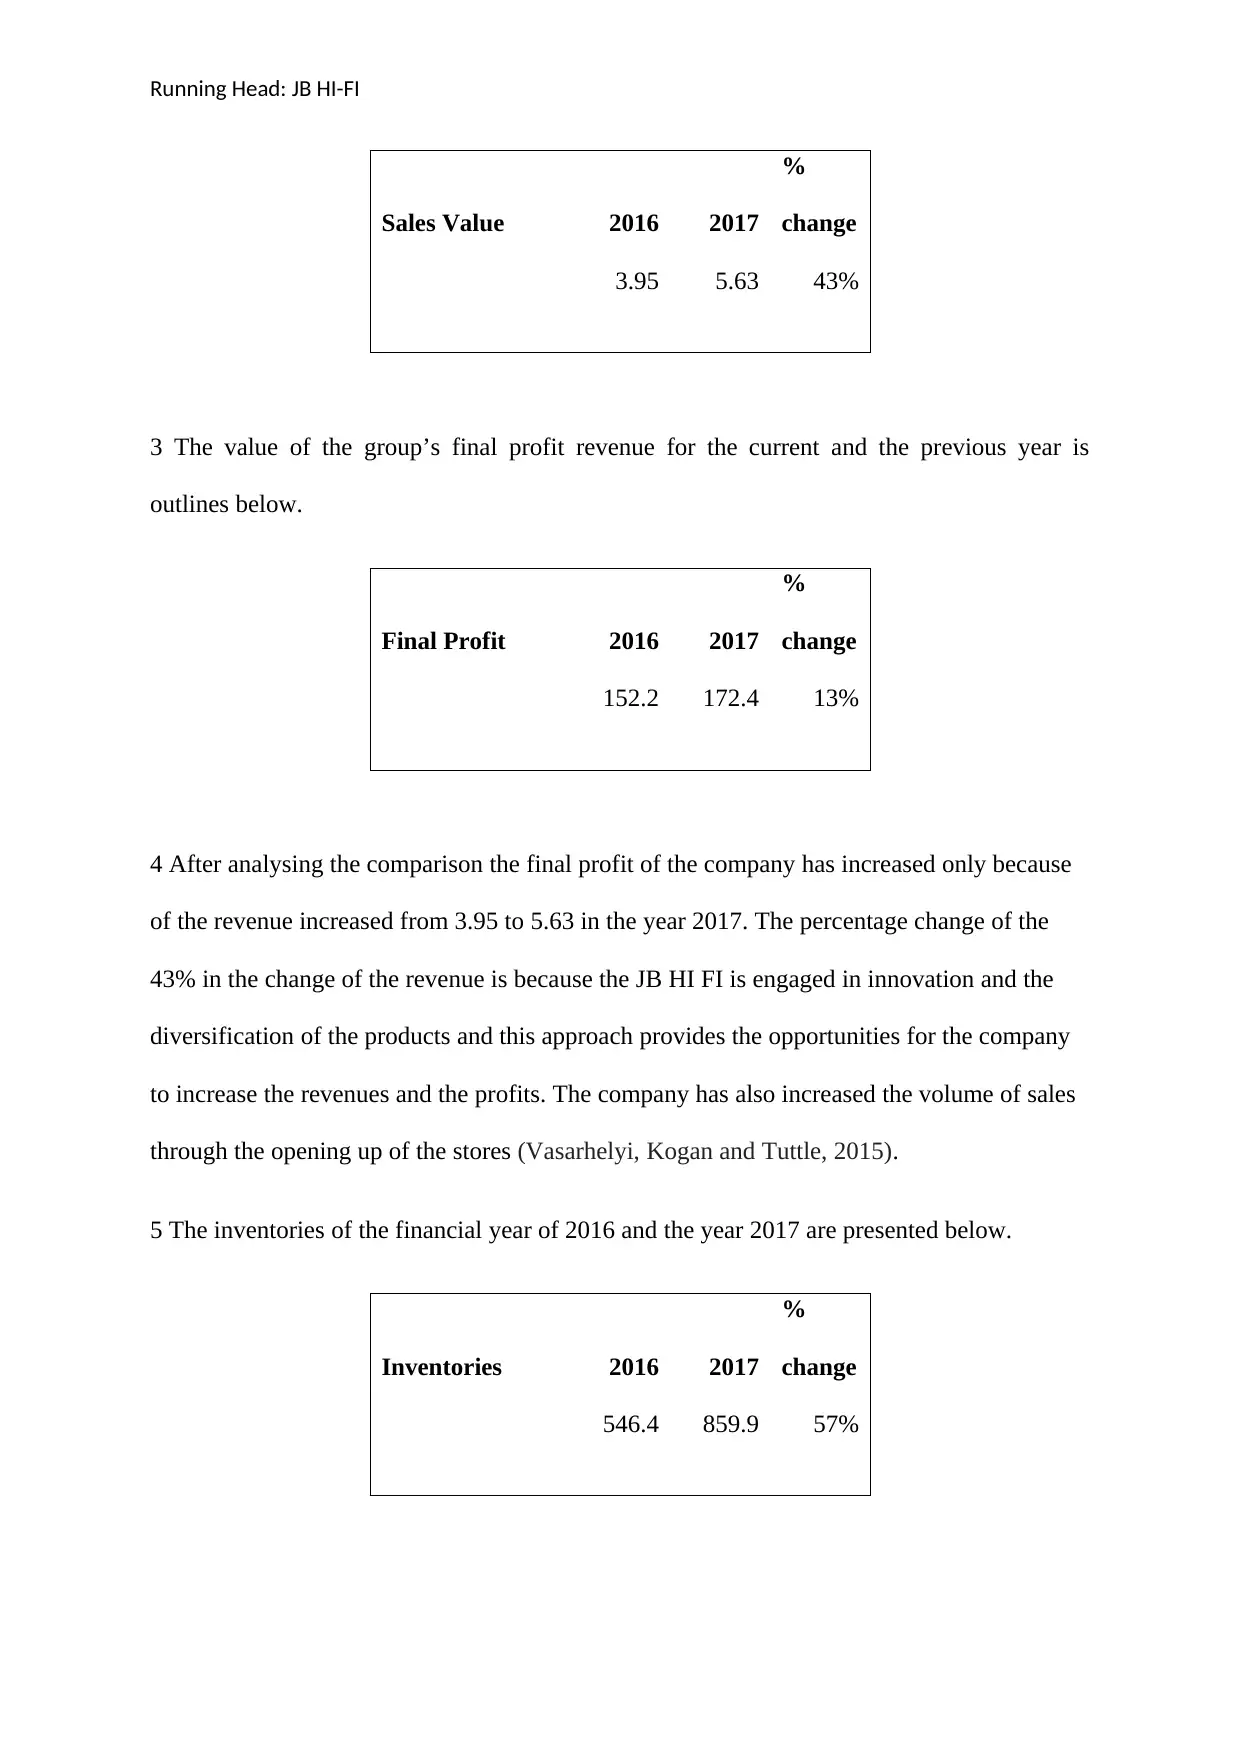
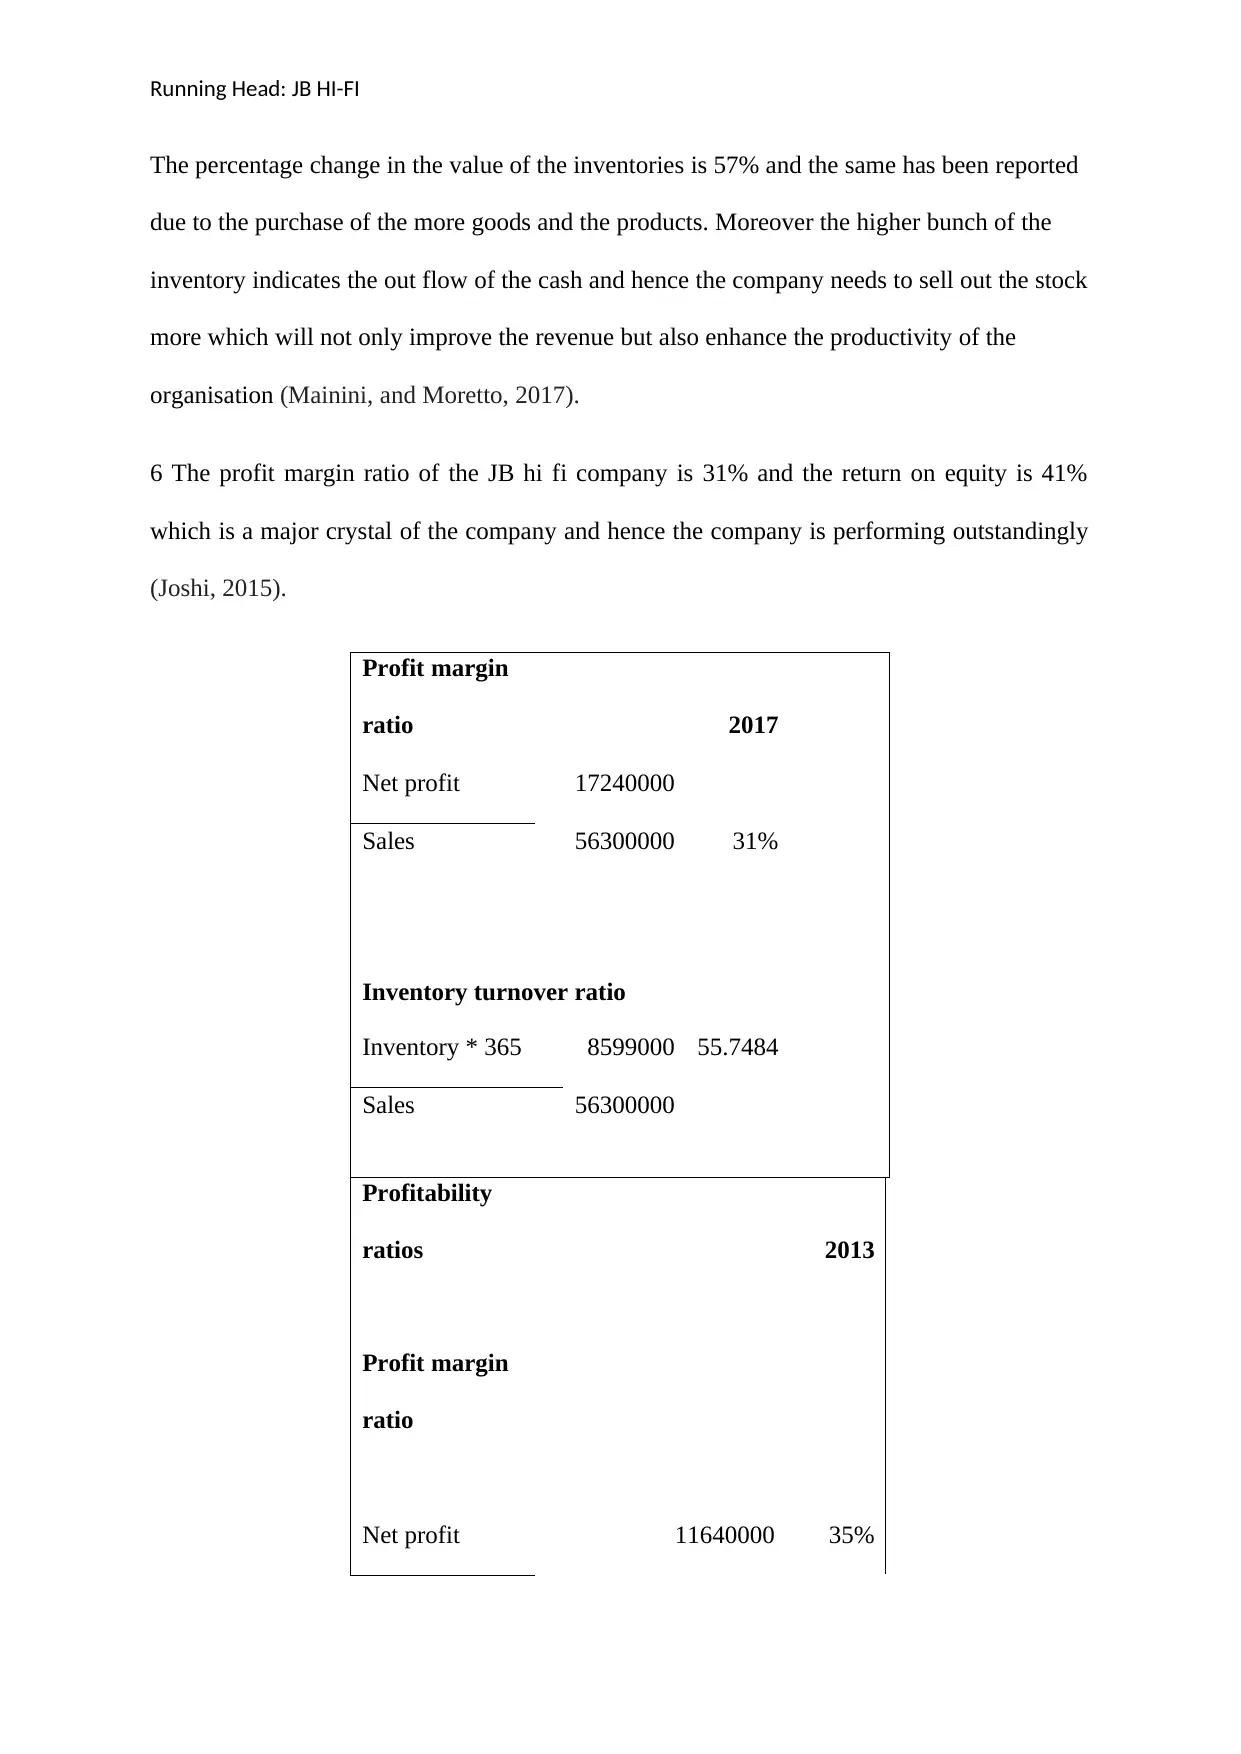
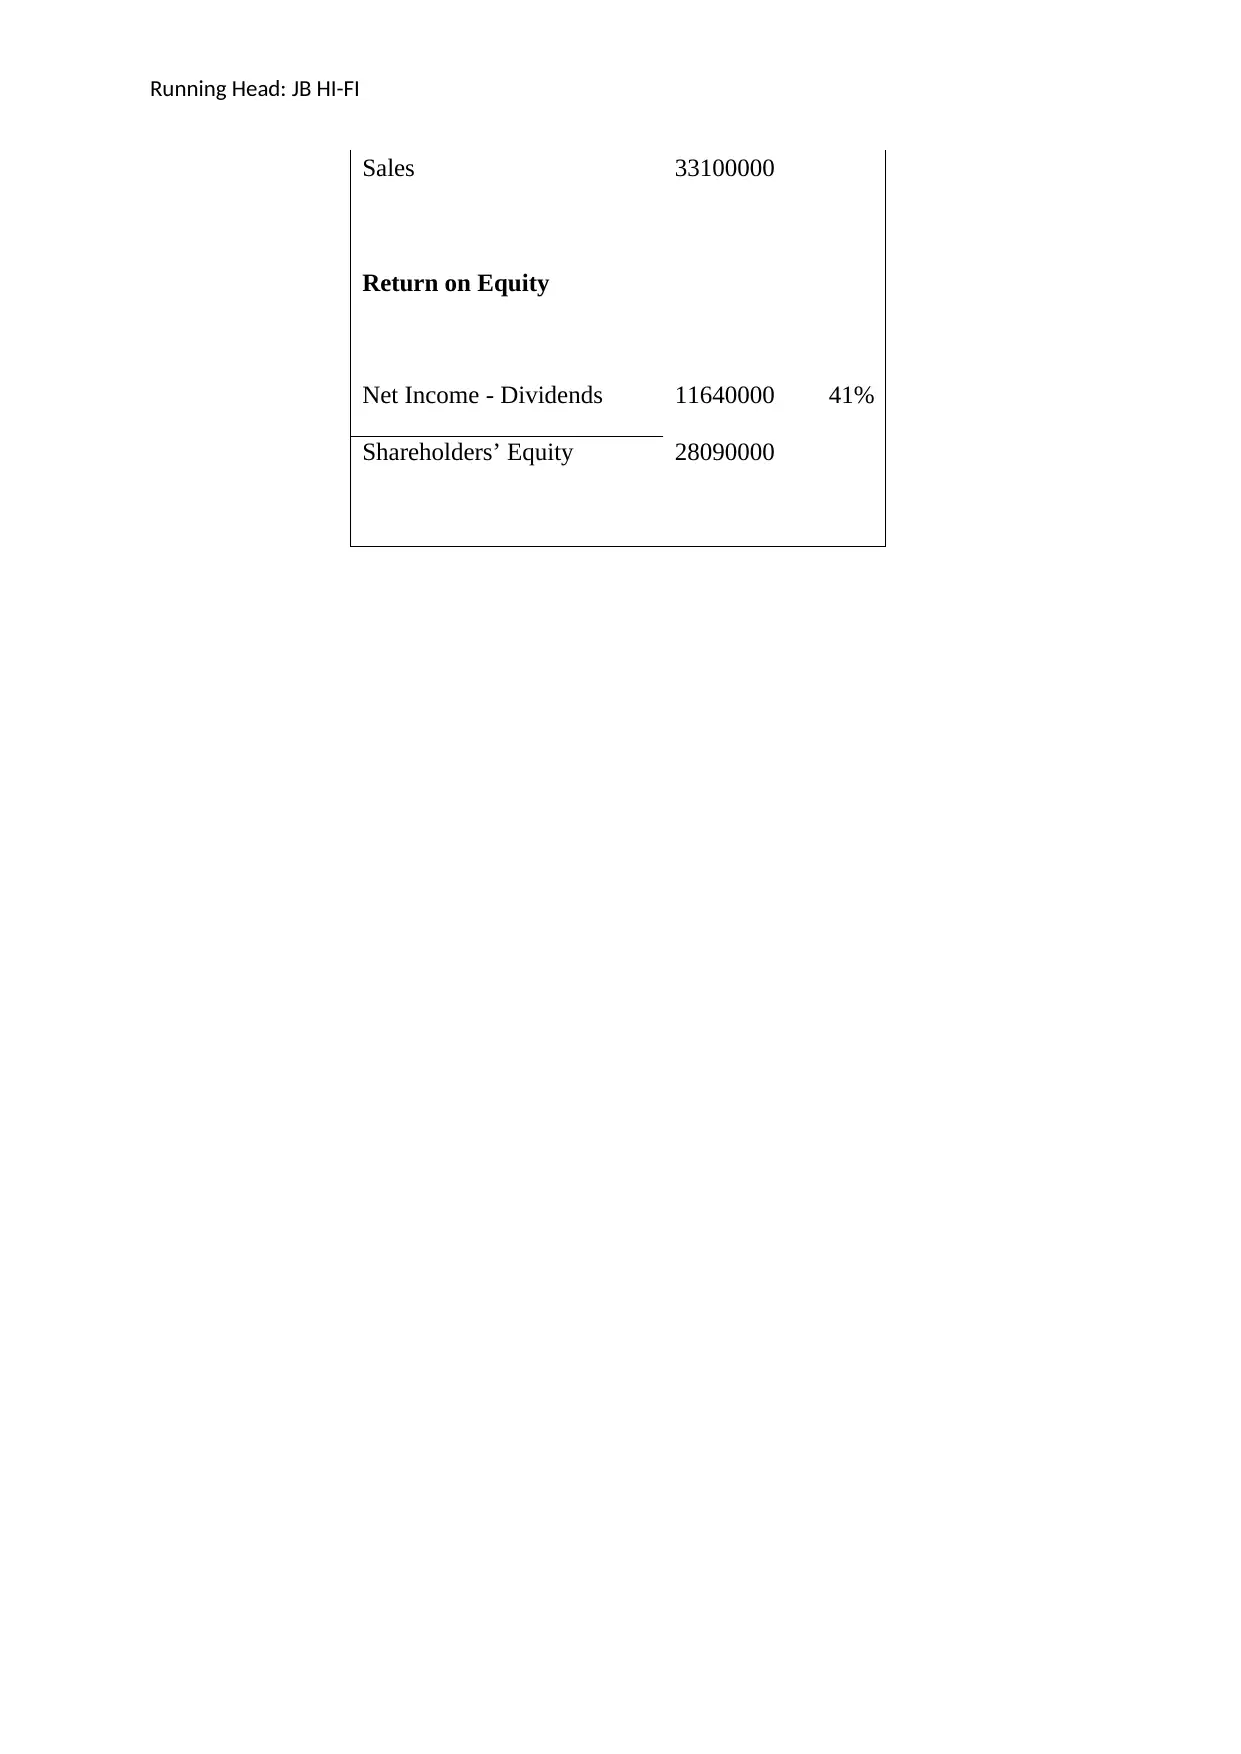
This assignment provides a comprehensive financial analysis of JB Hi-Fi, examining its revenue streams, asset classifications, and equity structure. Part A presents key financial figures including cash, inventories, sales revenue, and expenses. Part B delves into revenue types, asset bifurcation, and equity components. The assignment also explores dividend information, including interim and final dividends, and calculates the dividend pay-out ratio. Part C analyzes the company's subsidiary, sales revenue changes, and profit trends, highlighting the impact of innovation and diversification. Furthermore, it examines inventory changes, profit margin, return on equity, and inventory turnover ratios, offering a detailed overview of JB Hi-Fi's financial performance and providing key insights into the company's profitability and operational efficiency. The analysis is based on the provided financial data, including the annual report for 2017 and other relevant sources.

Running Head: JB HI-FI 0
JB HI-FI
JB HI-FI
Paraphrase This Document
Need a fresh take? Get an instant paraphrase of this document with our AI Paraphraser

Running Head: JB HI-FI
Table of Contents
Part A.........................................................................................................................................2
Part B..........................................................................................................................................2
Part C..........................................................................................................................................3
References..................................................................................................................................6

Running Head: JB HI-FI
Part A
1
Sr no. Particulars Amount
1 Cash and cash equivalents 72.8
2 Inventories 859.9
3 Sales revenue 562.8
4 Other income 2.0
5 Plant and Equipment 208.2
6 Interest Expense (finance
costs)
10.7
7 Sales and marketing expense 580.1
8 Occupancy expenses 248.6
9 Trade and other payables 647.8
10 Borrowings (non-current) 558.8
2
Sr no. Particulars Normal Balance Effect due to
decrease
1 Cash and cash
equivalents
23.5 DEBIT
2 Inventories 257.2 DEBIT
3 Sales revenue 4383.2 CREDIT
4 Other income 6.4 CREDIT
5 Plant and Equipment 35.2 DEBIT
⊘ This is a preview!⊘
Do you want full access?
Subscribe today to unlock all pages.

Trusted by 1+ million students worldwide

Running Head: JB HI-FI
6 Interest Expense
(finance costs)
10.5 DEBIT
7 Sales and marketing
expense
546.6 DEBIT
8 Occupancy expenses 183.5 DEBIT
9 Trade and other
payables
322.6 CREDIT
10 Borrowings (non-
current)
7.9 CREDIT
(Source: JB HI FI, 2018)
Part B
1 The different types of revenues generated by the consolidated group are through the sale of
the goods and the services, commissions made by the group and rendering of the services to
the clients and the customers. The current value of these types of the revenues is 5628 and the
other income includes the amount of the 1230.5 (JB HI FI, 2018).
2 The group assets are classified as current assets and the non-current assets. The bifurcation
of the assets is outlined below with respect to its current values (Frino, Hill and Chen, 2015).
BIFURCATION OF
THE ASSETS 2017
Current assets
Paraphrase This Document
Need a fresh take? Get an instant paraphrase of this document with our AI Paraphraser

Running Head: JB HI-FI
Cash and the Cash equivalents 72.8
Trade and other receivables 196.6
Inventories 859.9
Other current assets 41.4
1170.7
Non-current
assets
Plant and Equipment 208.2
Differed tax
Assets -
Intangible assets 1026.6
Other non-current assets 46.8
1281.6
3 The major categories that are listed among the group’s equity are as follows. The ordinary
shares of the JB hi-fi Limited at the end of the financial year are $105572 which is fully paid
ordinary shares and the executive share options $322105.
Shareholders’ Equity
Amoun
t
Contributed Equity 438.7
Reserves 33.2
Retained Earnings 381.6

Running Head: JB HI-FI
Total Shareholders’
Equity 853.5
(Source JB HI FI, 2018)
A The current liability of the group is 885.8.
B The final dividend declared by the JB Hi fi is 118 cents per share amongst which the fully
franked dividend is 46 cents per share. Therefore if only 100 shares of ordinary nature are
owned in the JB HI FI Limited than the amount of the dividend will be 46 cents per share (JB
HI FI, 2018).
C If the amount of the interim dividend is added to the current year’s dividend per share the
total amount of the dividend is summation of (63+46) which equals to 109 per share (CHEN,
2017).
D The last year dividend which is paid in the current year period is 72 per share (CHEN,
2017).
⊘ This is a preview!⊘
Do you want full access?
Subscribe today to unlock all pages.

Trusted by 1+ million students worldwide

Running Head: JB HI-FI
E The dividend per share of the JB HI FI is 46 per share and the earnings per share of the
company are given below. The earnings per share ratio gauges how profitable the company is
per share of the stock and the dividend per share determines the amount of the dividends
received per share basis (JB HI FI, 2018).
Earnings per
share 2017
Net Income 172.4
Weighted Average Equity
shareholders 619.75
0.28
Dividend Pay-out Ratio 2017
Dividends 46
Net Income 172.4
27%
The dividend pay-out ratio of the company is 27%.
Part C
1 The subsidiary company of the JB HI FI Group is The good guys.
2 The value of the group sales revenue for the current and the previous year is outlines below.
Paraphrase This Document
Need a fresh take? Get an instant paraphrase of this document with our AI Paraphraser

Running Head: JB HI-FI
Sales Value 2016 2017
%
change
3.95 5.63 43%
3 The value of the group’s final profit revenue for the current and the previous year is
outlines below.
Final Profit 2016 2017
%
change
152.2 172.4 13%
4 After analysing the comparison the final profit of the company has increased only because
of the revenue increased from 3.95 to 5.63 in the year 2017. The percentage change of the
43% in the change of the revenue is because the JB HI FI is engaged in innovation and the
diversification of the products and this approach provides the opportunities for the company
to increase the revenues and the profits. The company has also increased the volume of sales
through the opening up of the stores (Vasarhelyi, Kogan and Tuttle, 2015).
5 The inventories of the financial year of 2016 and the year 2017 are presented below.
Inventories 2016 2017
%
change
546.4 859.9 57%

Running Head: JB HI-FI
The percentage change in the value of the inventories is 57% and the same has been reported
due to the purchase of the more goods and the products. Moreover the higher bunch of the
inventory indicates the out flow of the cash and hence the company needs to sell out the stock
more which will not only improve the revenue but also enhance the productivity of the
organisation (Mainini, and Moretto, 2017).
6 The profit margin ratio of the JB hi fi company is 31% and the return on equity is 41%
which is a major crystal of the company and hence the company is performing outstandingly
(Joshi, 2015).
Profit margin
ratio 2017
Net profit 17240000
Sales 56300000 31%
Inventory turnover ratio
Inventory * 365 8599000 55.7484
Sales 56300000
Profitability
ratios 2013
Profit margin
ratio
Net profit 11640000 35%
⊘ This is a preview!⊘
Do you want full access?
Subscribe today to unlock all pages.

Trusted by 1+ million students worldwide

Running Head: JB HI-FI
Sales 33100000
Return on Equity
Net Income - Dividends 11640000 41%
Shareholders’ Equity 28090000
Sales 33100000
Return on Equity
Net Income - Dividends 11640000 41%
Shareholders’ Equity 28090000
Paraphrase This Document
Need a fresh take? Get an instant paraphrase of this document with our AI Paraphraser

Running Head: JB HI-FI
References
Benson, P., (2014) Sharing is caring. Electrical Connection, (Autumn 2014), p.132.
CHEN, Y., (2017) Estimation of Stock Price: A Case Study of JB Hi-Fi Limited. DEStech
Transactions on Social Science, Education and Human Science, (msie). pp. 36-42.
Frino, A., Hill, A. and Chen, Z., (2015) Introduction to corporate finance. London: Pearson
Higher Education AU.
JB HI FI, (2018) Annual report [Online] Available from
file:///C:/Users/Manita/Downloads/2666012_1244948281_Annual-Report-2017%20(2).pdf
[Accessed on 27th September 2018]
Joshi, M., (2015) Divergence between Operating Profit and EBIT. United States: John Wiley
& sons
Mainini, A. and Moretto, E., (2017) Extending Yagil exchange ratio determination model to
the case of stochastic dividends. New York: Springer
Vasarhelyi, M.A., Kogan, A. and Tuttle, B.M., (2015) Big Data in accounting: An
overview. Accounting Horizons, 29(2), pp.381-396.
1 out of 11
Related Documents

Your All-in-One AI-Powered Toolkit for Academic Success.
+13062052269
info@desklib.com
Available 24*7 on WhatsApp / Email
Unlock your academic potential
Copyright © 2020–2025 A2Z Services. All Rights Reserved. Developed and managed by ZUCOL.