Disciplined Entrepreneurship Workbook Step 4: TAM Calculation Analysis
VerifiedAdded on 2022/09/27
|6
|1714
|48
Homework Assignment
AI Summary
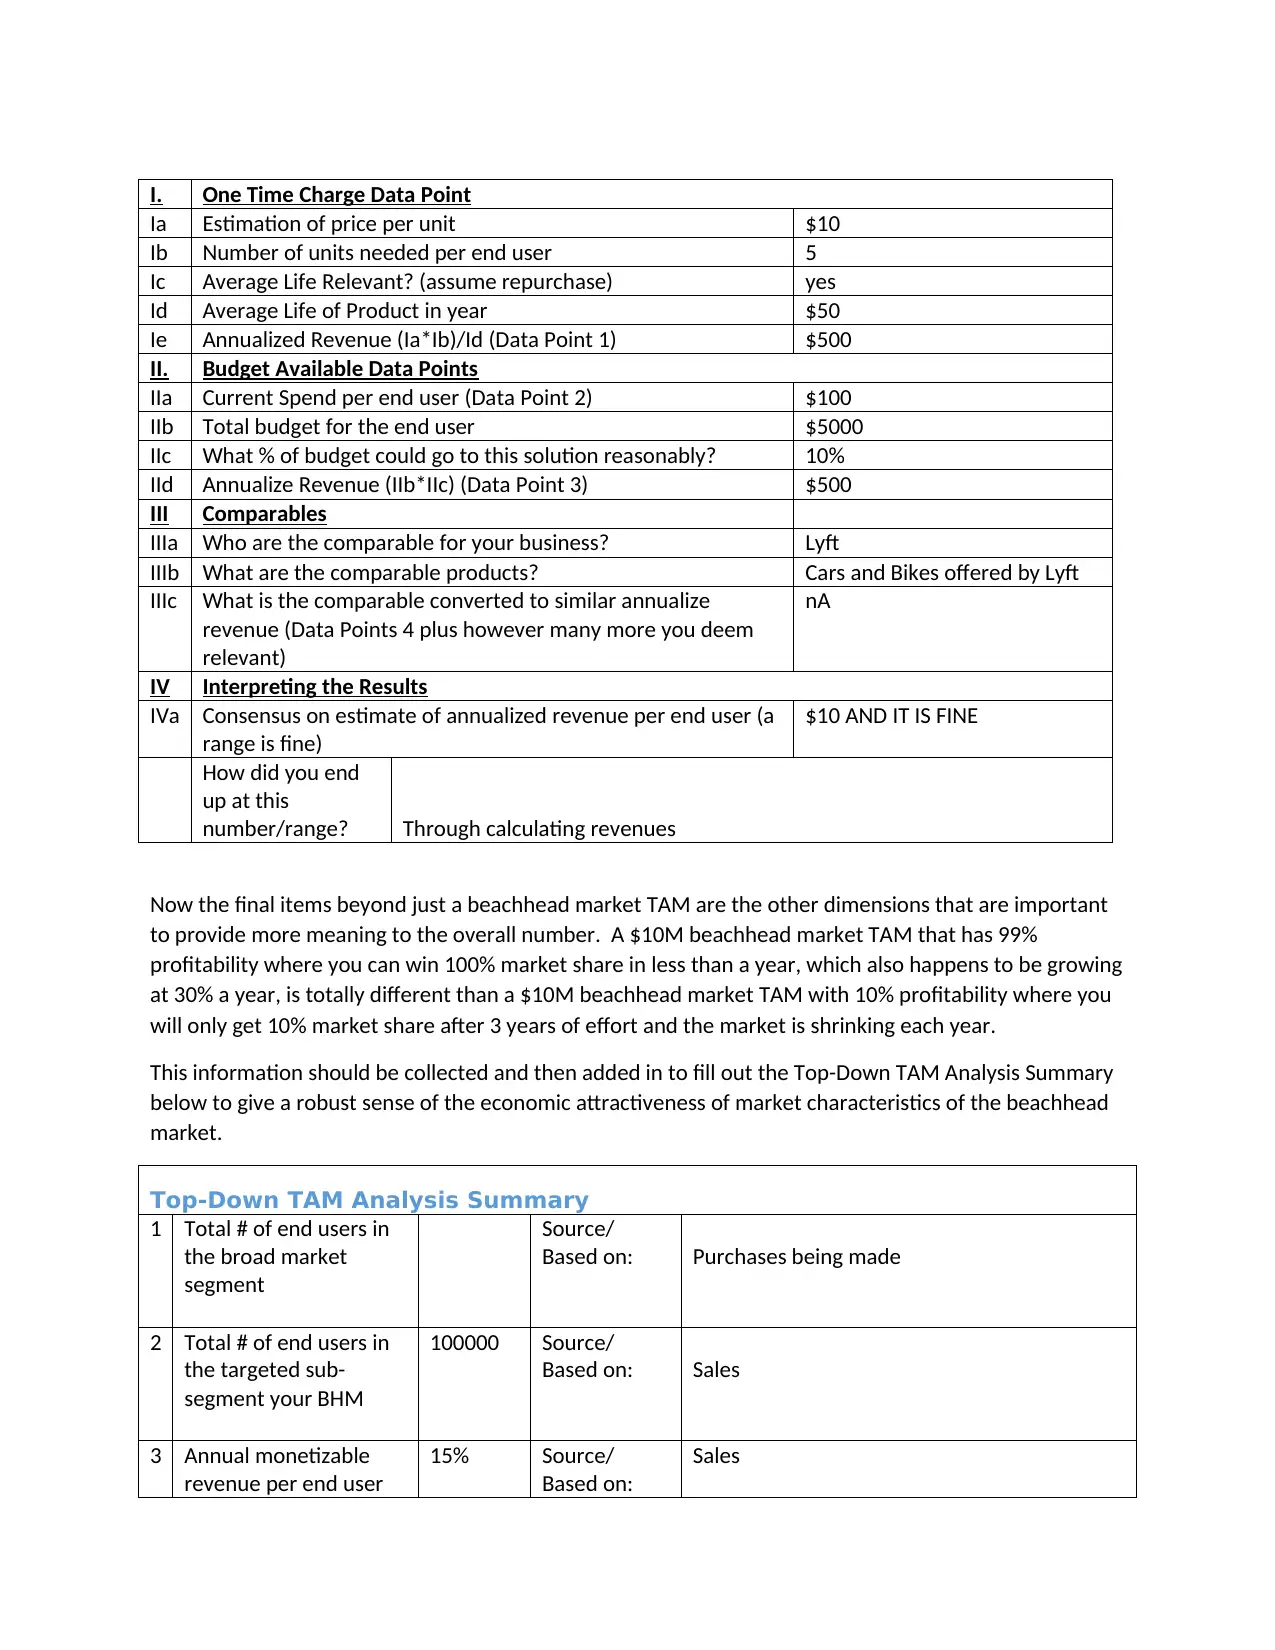
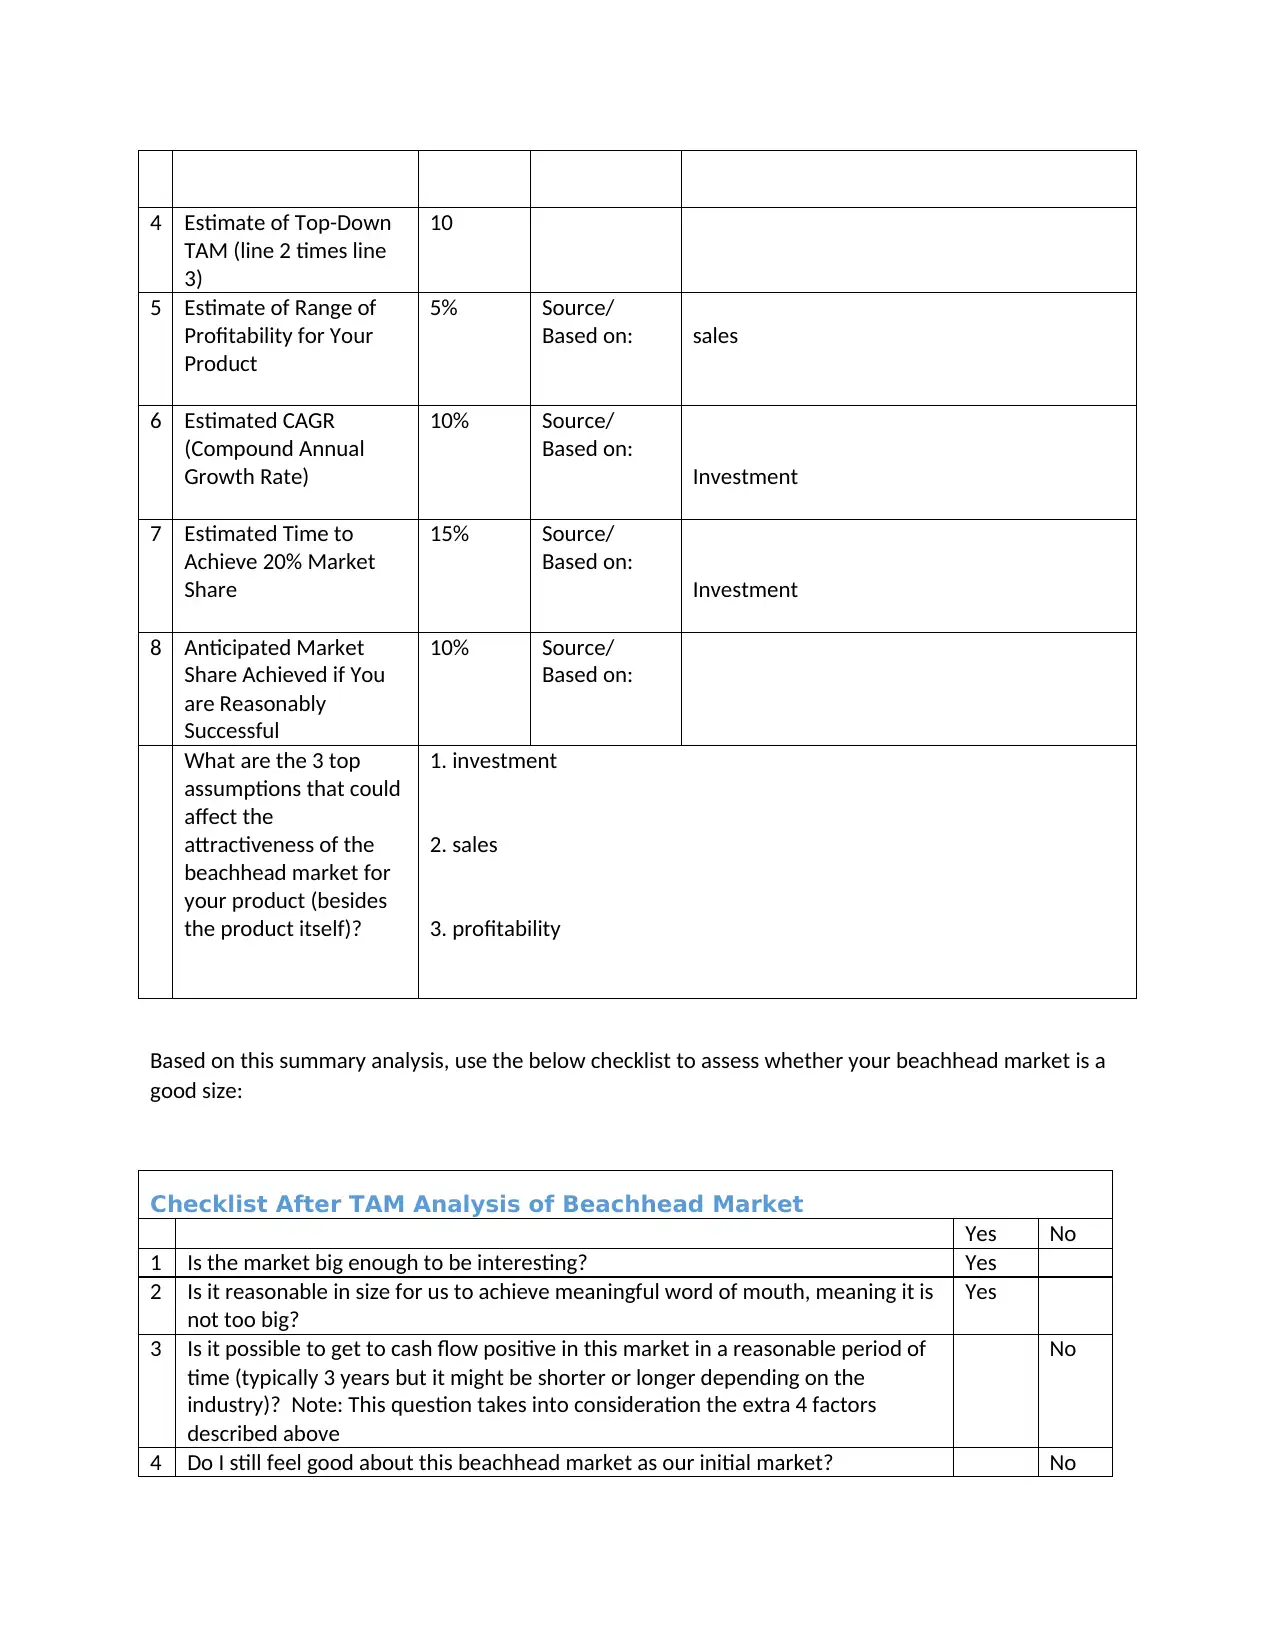
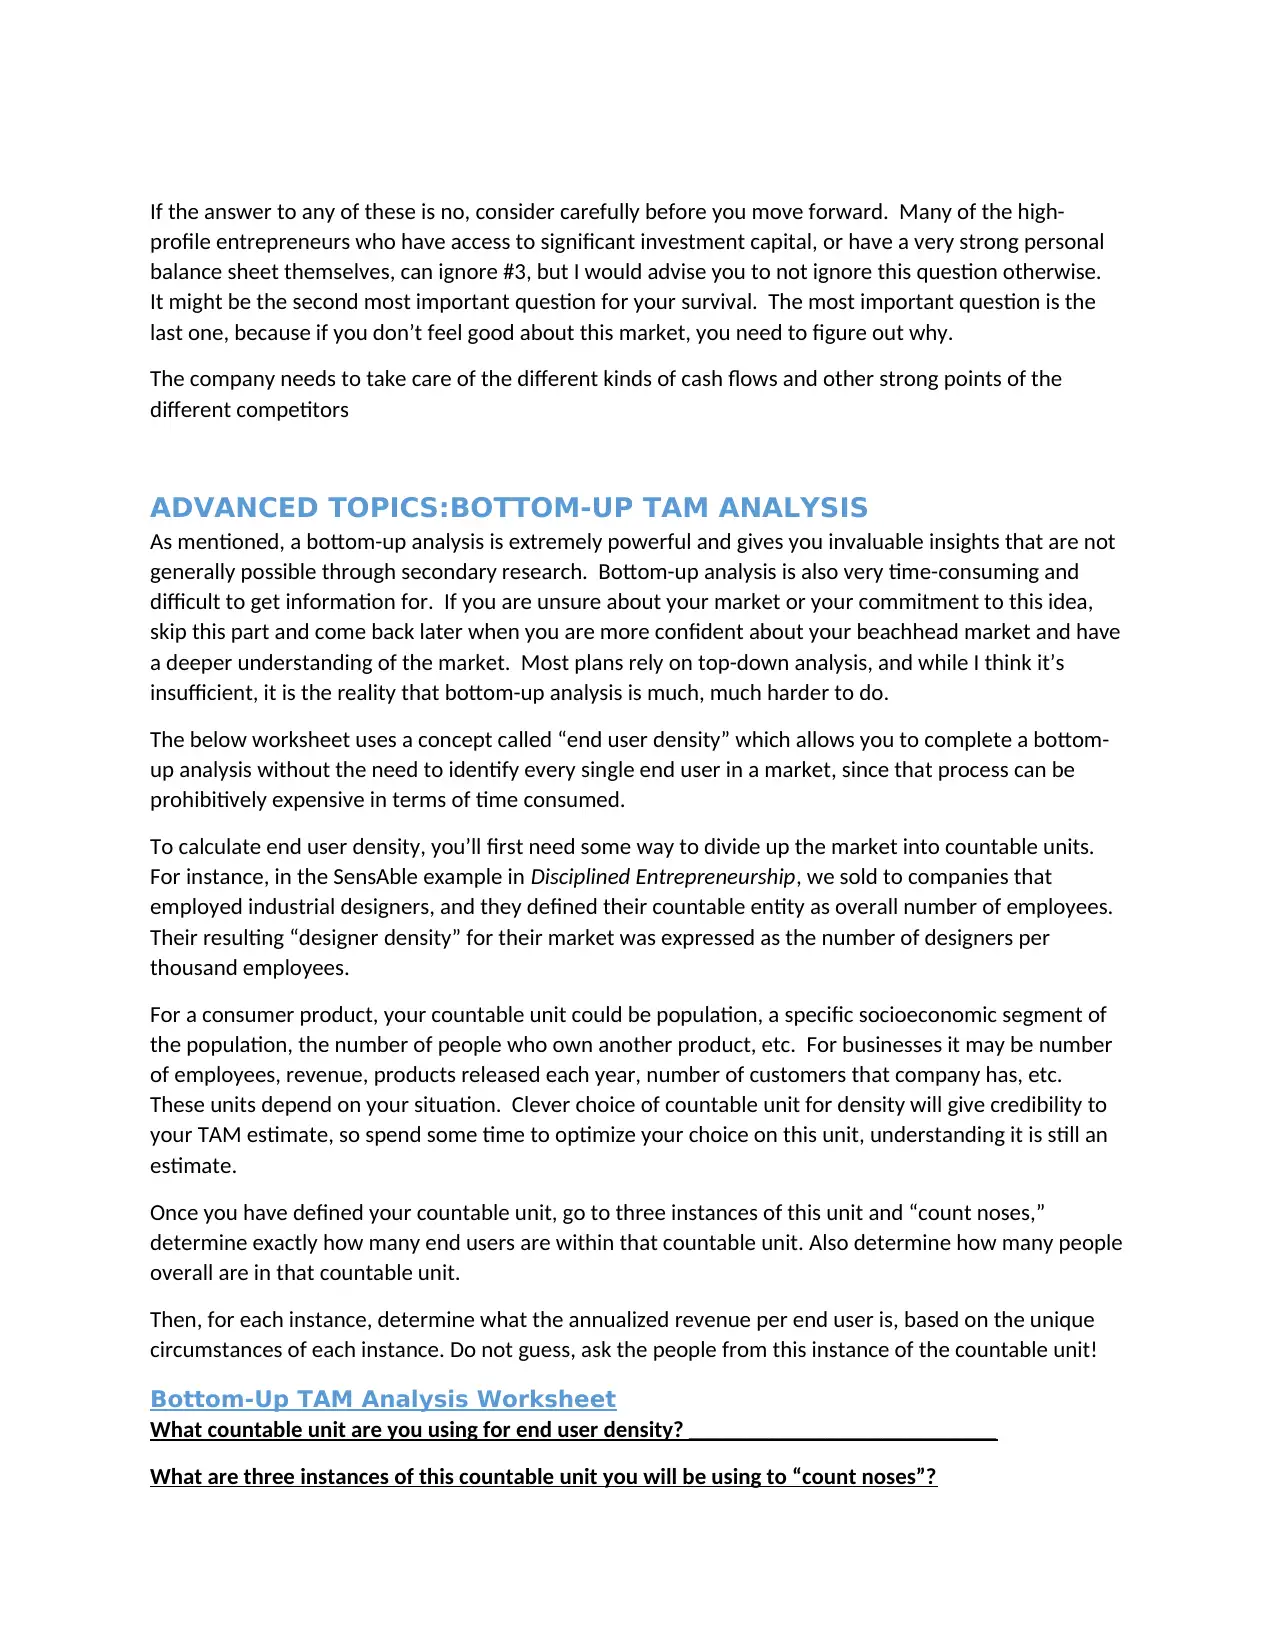
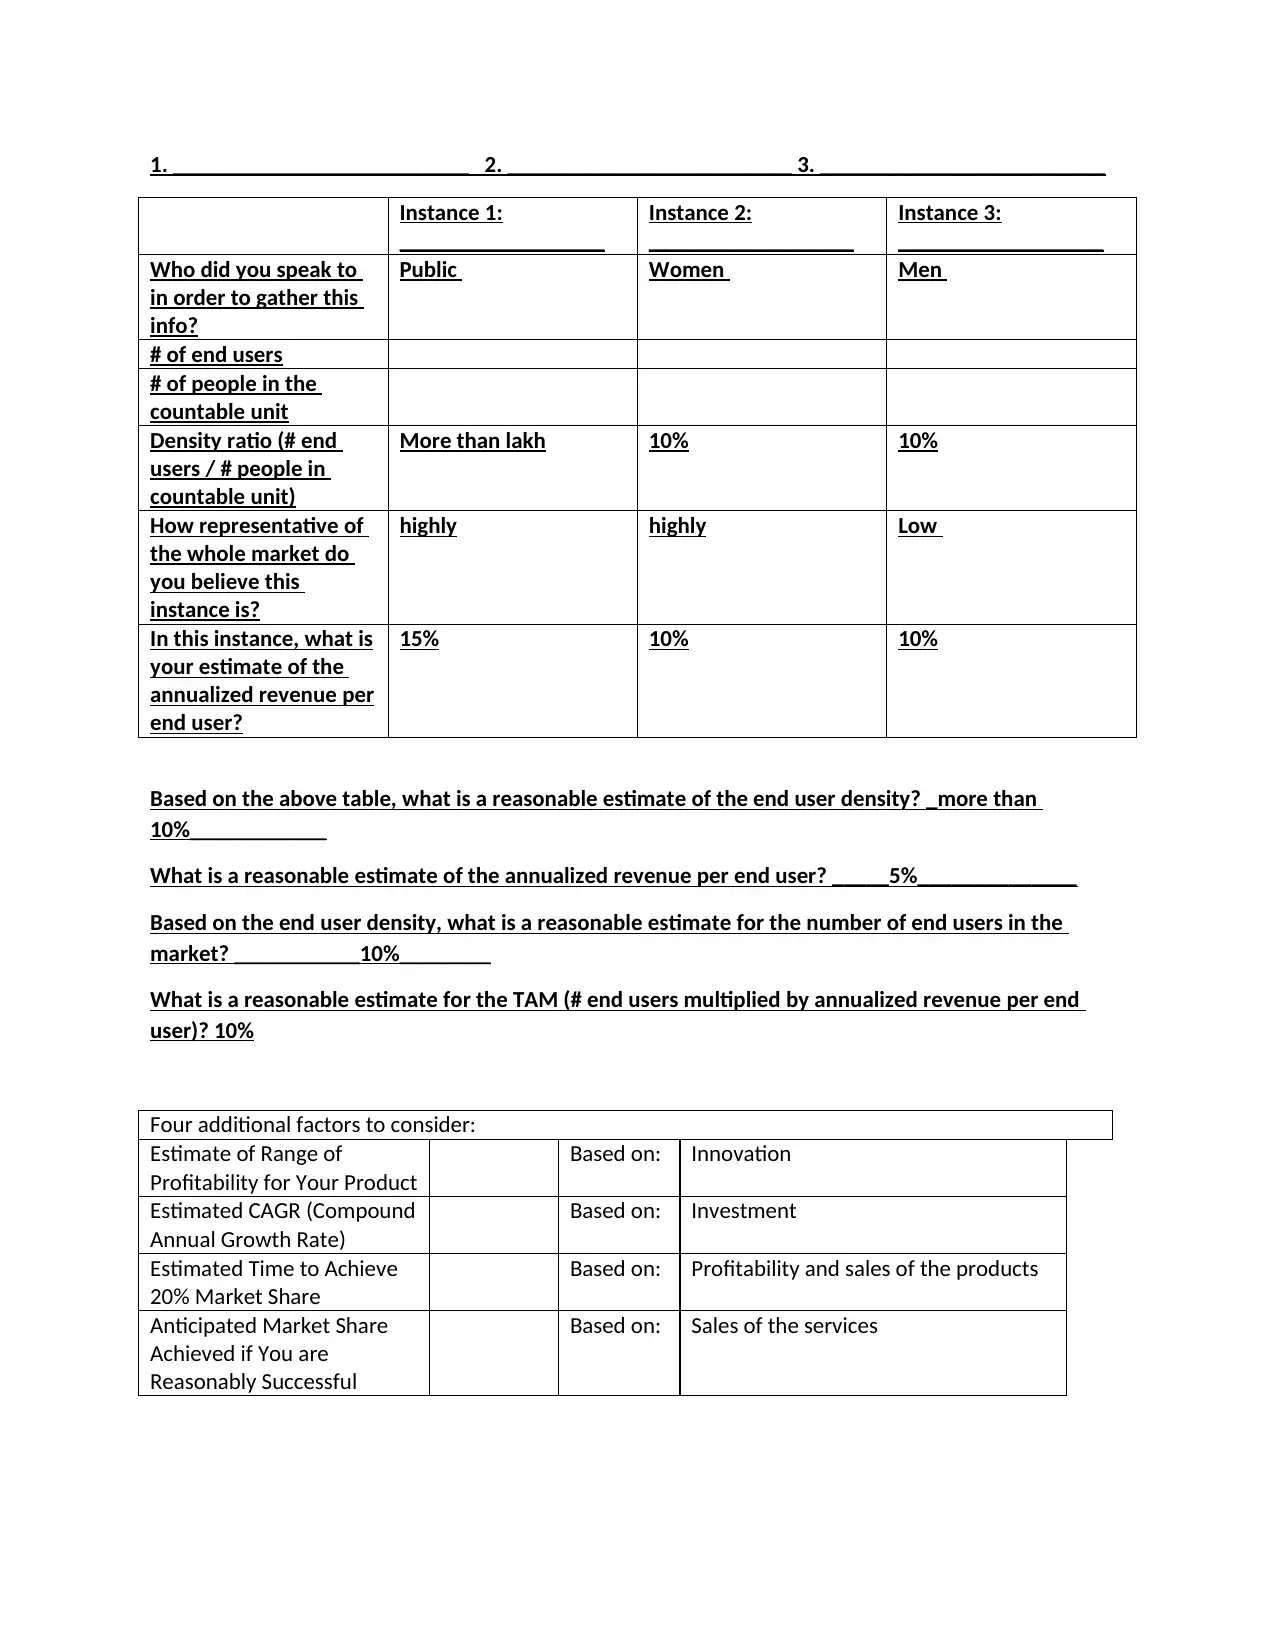
This assignment solution focuses on calculating the Total Addressable Market (TAM) size for a beachhead market, following the Disciplined Entrepreneurship framework. It includes general exercises to understand TAM concepts, such as estimating the TAM for toothbrushes and high-quality electric toothbrushes in the USA, along with the assumptions made. The solution incorporates worksheets for calculating annualized revenue per end user, considering data points like price per unit, number of units needed, and average product life. It also involves analyzing budget data and comparable products. Furthermore, the assignment delves into Top-Down TAM Analysis, including the number of end-users, annual revenue, profitability, and growth rate, followed by a checklist to assess market attractiveness. The solution also explores Bottom-Up TAM Analysis, utilizing end-user density and countable units to estimate market size. Finally, it compares top-down and bottom-up analyses, discusses factors affecting TAM size, and provides a comprehensive understanding of market analysis within an entrepreneurial context. This solution is contributed by a student and is available on Desklib.

Disciplined Entrepreneurship Workbook
Step 4: Calculate the Total Addressable Market
(TAM) Size for the Beachhead Market
General Exercises to Understand Concept
1. What do you think the TAM is for toothbrushes in the USA? What assumptions did you make in
calculating it?
_it is the entire population and the main assumptions include that everyone needs to brush
teeth and it is the mandatory aspect which is needed to be followed
2. Now what would you estimate as the TAM for high-quality electric toothbrushes that cost $150
in the USA? What assumptions did you make in calculating it?
__It will be less than half of the population as everyone cannot afford the same to purchase for
$150 as it is not affordable in nature
3. What are the biggest unknowns in your assumptions that you would need to research further?
The calculation of the percentage of the population who uses the electric toothbrush
Worksheets
Paraphrase This Document
Need a fresh take? Get an instant paraphrase of this document with our AI Paraphraser

I. One Time Charge Data Point
Ia Estimation of price per unit $10
Ib Number of units needed per end user 5
Ic Average Life Relevant? (assume repurchase) yes
Id Average Life of Product in year $50
Ie Annualized Revenue (Ia*Ib)/Id (Data Point 1) $500
II. Budget Available Data Points
IIa Current Spend per end user (Data Point 2) $100
IIb Total budget for the end user $5000
IIc What % of budget could go to this solution reasonably? 10%
IId Annualize Revenue (IIb*IIc) (Data Point 3) $500
III Comparables
IIIa Who are the comparable for your business? Lyft
IIIb What are the comparable products? Cars and Bikes offered by Lyft
IIIc What is the comparable converted to similar annualize
revenue (Data Points 4 plus however many more you deem
relevant)
nA
IV Interpreting the Results
IVa Consensus on estimate of annualized revenue per end user (a
range is fine)
$10 AND IT IS FINE
How did you end
up at this
number/range? Through calculating revenues
Now the final items beyond just a beachhead market TAM are the other dimensions that are important
to provide more meaning to the overall number. A $10M beachhead market TAM that has 99%
profitability where you can win 100% market share in less than a year, which also happens to be growing
at 30% a year, is totally different than a $10M beachhead market TAM with 10% profitability where you
will only get 10% market share after 3 years of effort and the market is shrinking each year.
This information should be collected and then added in to fill out the Top-Down TAM Analysis Summary
below to give a robust sense of the economic attractiveness of market characteristics of the beachhead
market.
Top-Down TAM Analysis Summary
1 Total # of end users in
the broad market
segment
Source/
Based on: Purchases being made
2 Total # of end users in
the targeted sub-
segment your BHM
100000 Source/
Based on: Sales
3 Annual monetizable
revenue per end user
15% Source/
Based on:
Sales

4 Estimate of Top-Down
TAM (line 2 times line
3)
10
5 Estimate of Range of
Profitability for Your
Product
5% Source/
Based on: sales
6 Estimated CAGR
(Compound Annual
Growth Rate)
10% Source/
Based on:
Investment
7 Estimated Time to
Achieve 20% Market
Share
15% Source/
Based on:
Investment
8 Anticipated Market
Share Achieved if You
are Reasonably
Successful
10% Source/
Based on:
What are the 3 top
assumptions that could
affect the
attractiveness of the
beachhead market for
your product (besides
the product itself)?
1. investment
2. sales
3. profitability
Based on this summary analysis, use the below checklist to assess whether your beachhead market is a
good size:
Checklist After TAM Analysis of Beachhead Market
Yes No
1 Is the market big enough to be interesting? Yes
2 Is it reasonable in size for us to achieve meaningful word of mouth, meaning it is
not too big?
Yes
3 Is it possible to get to cash flow positive in this market in a reasonable period of
time (typically 3 years but it might be shorter or longer depending on the
industry)? Note: This question takes into consideration the extra 4 factors
described above
No
4 Do I still feel good about this beachhead market as our initial market? No
⊘ This is a preview!⊘
Do you want full access?
Subscribe today to unlock all pages.

Trusted by 1+ million students worldwide

If the answer to any of these is no, consider carefully before you move forward. Many of the high-
profile entrepreneurs who have access to significant investment capital, or have a very strong personal
balance sheet themselves, can ignore #3, but I would advise you to not ignore this question otherwise.
It might be the second most important question for your survival. The most important question is the
last one, because if you don’t feel good about this market, you need to figure out why.
The company needs to take care of the different kinds of cash flows and other strong points of the
different competitors
ADVANCED TOPICS:BOTTOM-UP TAM ANALYSIS
As mentioned, a bottom-up analysis is extremely powerful and gives you invaluable insights that are not
generally possible through secondary research. Bottom-up analysis is also very time-consuming and
difficult to get information for. If you are unsure about your market or your commitment to this idea,
skip this part and come back later when you are more confident about your beachhead market and have
a deeper understanding of the market. Most plans rely on top-down analysis, and while I think it’s
insufficient, it is the reality that bottom-up analysis is much, much harder to do.
The below worksheet uses a concept called “end user density” which allows you to complete a bottom-
up analysis without the need to identify every single end user in a market, since that process can be
prohibitively expensive in terms of time consumed.
To calculate end user density, you’ll first need some way to divide up the market into countable units.
For instance, in the SensAble example in Disciplined Entrepreneurship, we sold to companies that
employed industrial designers, and they defined their countable entity as overall number of employees.
Their resulting “designer density” for their market was expressed as the number of designers per
thousand employees.
For a consumer product, your countable unit could be population, a specific socioeconomic segment of
the population, the number of people who own another product, etc. For businesses it may be number
of employees, revenue, products released each year, number of customers that company has, etc.
These units depend on your situation. Clever choice of countable unit for density will give credibility to
your TAM estimate, so spend some time to optimize your choice on this unit, understanding it is still an
estimate.
Once you have defined your countable unit, go to three instances of this unit and “count noses,”
determine exactly how many end users are within that countable unit. Also determine how many people
overall are in that countable unit.
Then, for each instance, determine what the annualized revenue per end user is, based on the unique
circumstances of each instance. Do not guess, ask the people from this instance of the countable unit!
Bottom-Up TAM Analysis Worksheet
What countable unit are you using for end user density? ___________________________
What are three instances of this countable unit you will be using to “count noses”?
Paraphrase This Document
Need a fresh take? Get an instant paraphrase of this document with our AI Paraphraser

1. __________________________ 2. _________________________ 3. _________________________
Instance 1:
__________________
Instance 2:
__________________
Instance 3:
__________________
Who did you speak to
in order to gather this
info?
Public Women Men
# of end users
# of people in the
countable unit
Density ratio (# end
users / # people in
countable unit)
More than lakh 10% 10%
How representative of
the whole market do
you believe this
instance is?
highly highly Low
In this instance, what is
your estimate of the
annualized revenue per
end user?
15% 10% 10%
Based on the above table, what is a reasonable estimate of the end user density? _more than
10%____________
What is a reasonable estimate of the annualized revenue per end user? _____5%______________
Based on the end user density, what is a reasonable estimate for the number of end users in the
market? ___________10%________
What is a reasonable estimate for the TAM (# end users multiplied by annualized revenue per end
user)? 10%
Four additional factors to consider:
Estimate of Range of
Profitability for Your Product
Based on: Innovation
Estimated CAGR (Compound
Annual Growth Rate)
Based on: Investment
Estimated Time to Achieve
20% Market Share
Based on: Profitability and sales of the products
Anticipated Market Share
Achieved if You are
Reasonably Successful
Based on: Sales of the services

1. Comparing yourtop-down and bottom-up analyses, which do you believe has more credibility?
Why?
The top down analysis has more credibility as it is determined with the determination of total market
and estimating the share of the respective market
2. If you blend the two estimations, what is your final TAM size? What factors would make the TAM
lower than you calculated? What are the factors that would drive the TAM much higher?
It will be lower in nature and in order to increase the TAM, the bottom up analysis is highly necessary
that will be effective in improving the progress
⊘ This is a preview!⊘
Do you want full access?
Subscribe today to unlock all pages.

Trusted by 1+ million students worldwide
1 out of 6
Your All-in-One AI-Powered Toolkit for Academic Success.
+13062052269
info@desklib.com
Available 24*7 on WhatsApp / Email
Unlock your academic potential
Copyright © 2020–2025 A2Z Services. All Rights Reserved. Developed and managed by ZUCOL.


