University Finance Report: Performance of Tas Foods Ltd
VerifiedAdded on 2020/05/16
|13
|2932
|432
Report
AI Summary
This report presents a comprehensive financial analysis of Tas Foods Ltd. It begins with a description of the company and its organizational structure, followed by the computation and trend analysis of key performance ratios, including ROA, ROE, and debt ratios, from 2013 to 2016. The report includes a graphical representation of the company's stock price movement and identifies significant factors influencing its share price. It also calculates the company's beta and required rate of return, providing a rationale for conservative investment. Furthermore, the report assesses the weighted average cost of capital (WACC) and its implications on prospective investment projects. Debt and gearing ratios are analyzed, and the company's dividend policy is discussed. The report concludes with a letter of recommendation, summarizing the findings and providing investment advice. This report is a valuable resource for understanding Tas Foods Ltd's financial health and investment potential.
Running head: FINANCE
Finance
Name of the Student
Name of the University
Authors Note
Course ID
Finance
Name of the Student
Name of the University
Authors Note
Course ID
Paraphrase This Document
Need a fresh take? Get an instant paraphrase of this document with our AI Paraphraser
1FINANCE
Table of Contents
Description of the Company:.....................................................................................................2
Organization structure of ownership and governance:...............................................................2
Computation of the Performance Ratios:...................................................................................3
Graphical representation of the results:......................................................................................4
Significant factor influencing the share price of Tas Food Ltd:................................................5
Computation of Beta and required rate of return:......................................................................5
Rationale for Conservative Investment:.....................................................................................6
Weighted average of cost of capital:..........................................................................................6
Implication of the WACC on Prospective investment projects:................................................7
Debt ratios for the last two years:..............................................................................................7
Gearing ratio:.............................................................................................................................8
Dividend policy:.........................................................................................................................8
Letter of recommendation:.........................................................................................................8
Reference List:.........................................................................................................................10

2FINANCE
Description of the Company:
The Tasmania food company is regarded as the brand endorser with the help of which
the artisan of the company promotes the brand to the wider group of audience. The
Tasmanian food company endorses those brands that falls within the business meeting the
promise of brand and value that is represented by the company (TasFoods Ltd 2018). The
sub-brands under the Tasmanian Food Company will have their effect on their own set of the
unique attributes which would meet the needs of the target market. This would enable the
Tasmania food company to tell the story of the provenance of their products. It enables the
company in developing the new and exciting range of goods categories namely the ethical
free range chicken which meet the changing anticipations of the customers.
Tasmania usually commands the premium brand in the form of place of origin for the
food and beverage products (TasFoods Ltd 2018). Tas food limited has positioned the
company having head office in Tasmania with senior management team that is connected
with the Tasmanian agricultural and food industry in order to obtain the advantage of the
brand.
Organization structure of ownership and governance:
The management team of the Tas Food Ltd is accountable for the strategic direction
of the organization. The organization structure is so designed that the team works closely to
make sure that the Tas Food Ltd meets the demand of the shareholders however provides the
positive, innovative and better working environment for the employees (TasFoods Ltd 2018).
The organization structure of the Tas Food Ltd comprises of the non-executive chairman,
managing director, non-executive director, chief operating officer, chief financial officer and
company secretary. Additionally, the new food production business of the company has the
strong quality assurance team responsible for quality assurance management system that
⊘ This is a preview!⊘
Do you want full access?
Subscribe today to unlock all pages.
Trusted by 1+ million students worldwide
3FINANCE
provides consistency of system and procedure across the business. Additionally, the
organizational structure comprises of the food and quality assurance management system that
are subjected to numerous regular audits by the independent certification bodies and
regulations.
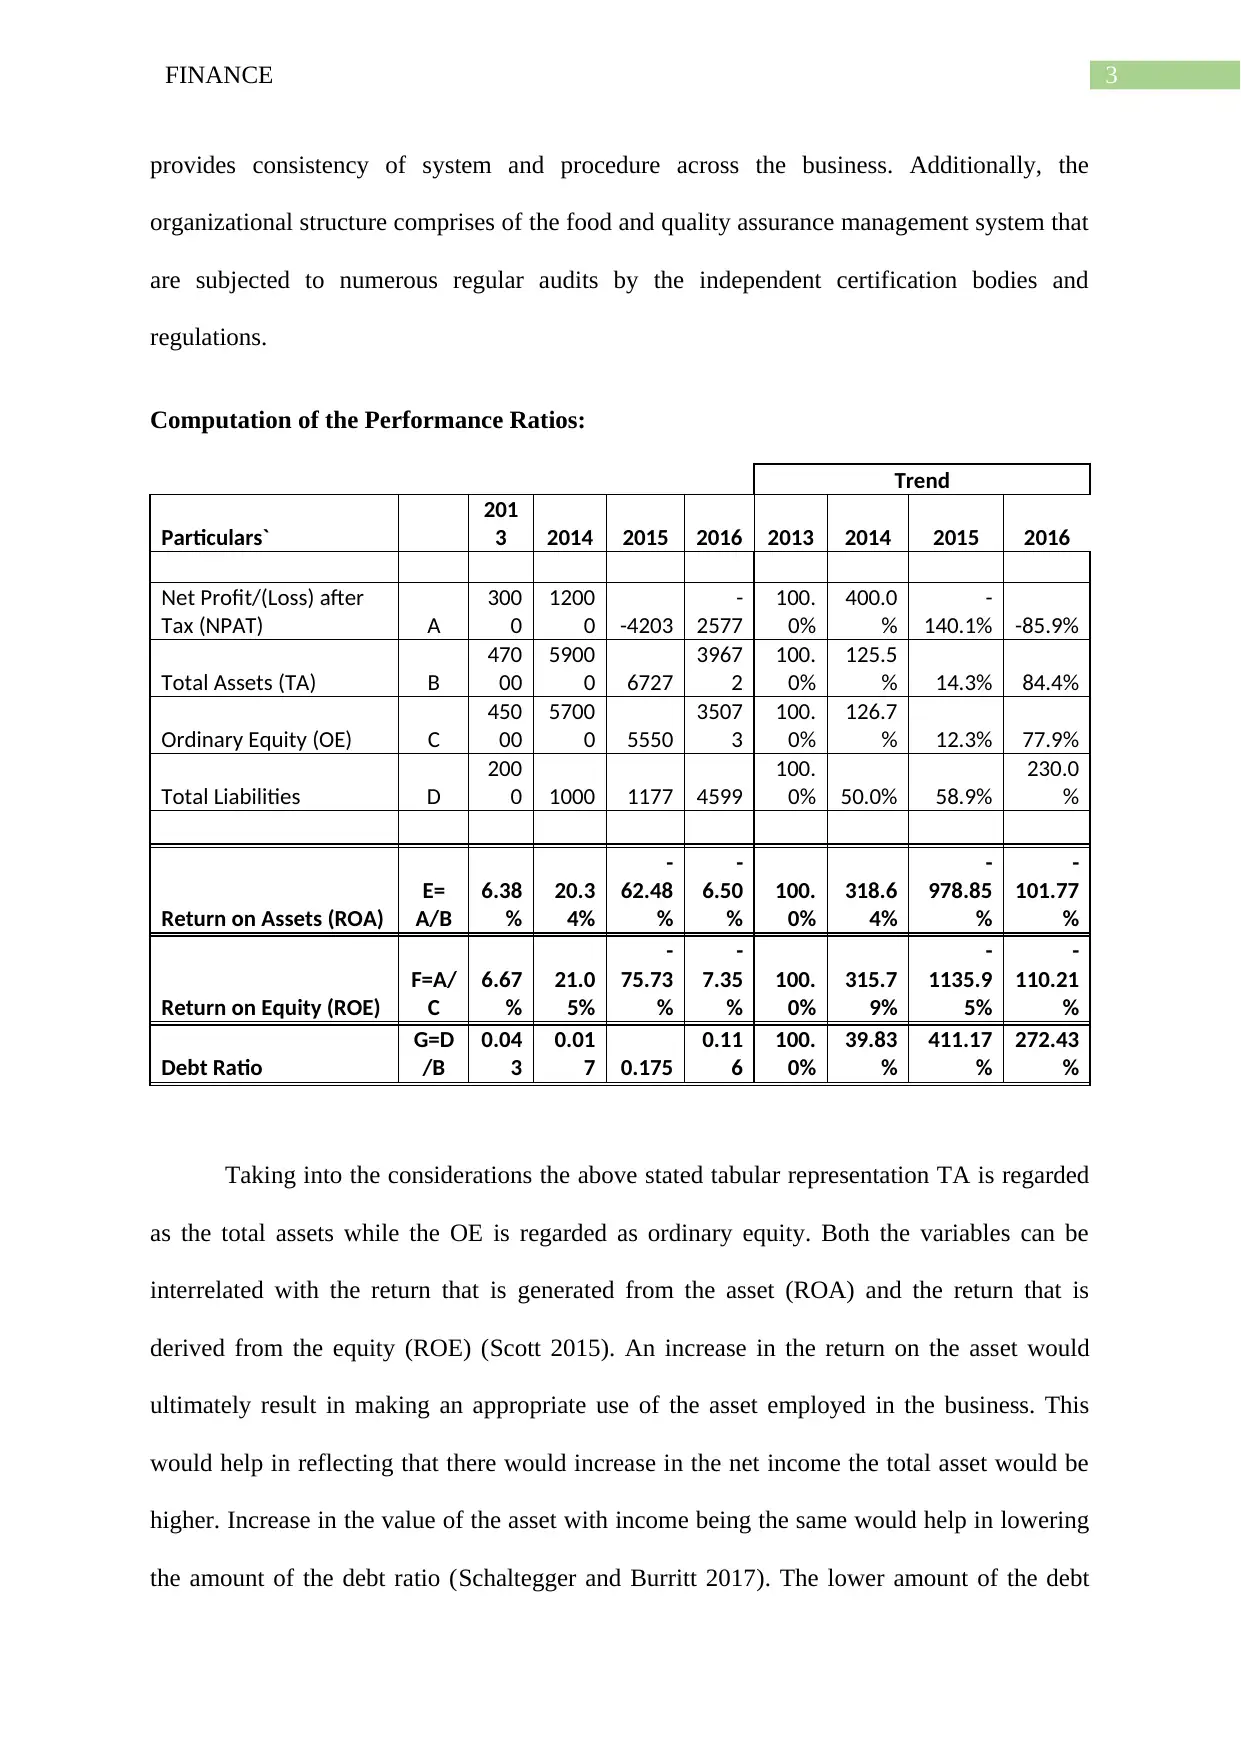
Computation of the Performance Ratios:
Trend
Particulars`
201
3 2014 2015 2016 2013 2014 2015 2016
Net Profit/(Loss) after
Tax (NPAT) A
300
0
1200
0 -4203
-
2577
100.
0%
400.0
%
-
140.1% -85.9%
Total Assets (TA) B
470
00
5900
0 6727
3967
2
100.
0%
125.5
% 14.3% 84.4%
Ordinary Equity (OE) C
450
00
5700
0 5550
3507
3
100.
0%
126.7
% 12.3% 77.9%
Total Liabilities D
200
0 1000 1177 4599
100.
0% 50.0% 58.9%
230.0
%
Return on Assets (ROA)
E=
A/B
6.38
%
20.3
4%
-
62.48
%
-
6.50
%
100.
0%
318.6
4%
-
978.85
%
-
101.77
%
Return on Equity (ROE)
F=A/
C
6.67
%
21.0
5%
-
75.73
%
-
7.35
%
100.
0%
315.7
9%
-
1135.9
5%
-
110.21
%
Debt Ratio
G=D
/B
0.04
3
0.01
7 0.175
0.11
6
100.
0%
39.83
%
411.17
%
272.43
%
Taking into the considerations the above stated tabular representation TA is regarded
as the total assets while the OE is regarded as ordinary equity. Both the variables can be
interrelated with the return that is generated from the asset (ROA) and the return that is
derived from the equity (ROE) (Scott 2015). An increase in the return on the asset would
ultimately result in making an appropriate use of the asset employed in the business. This
would help in reflecting that there would increase in the net income the total asset would be
higher. Increase in the value of the asset with income being the same would help in lowering
the amount of the debt ratio (Schaltegger and Burritt 2017). The lower amount of the debt
provides consistency of system and procedure across the business. Additionally, the
organizational structure comprises of the food and quality assurance management system that
are subjected to numerous regular audits by the independent certification bodies and
regulations.
Computation of the Performance Ratios:
Trend
Particulars`
201
3 2014 2015 2016 2013 2014 2015 2016
Net Profit/(Loss) after
Tax (NPAT) A
300
0
1200
0 -4203
-
2577
100.
0%
400.0
%
-
140.1% -85.9%
Total Assets (TA) B
470
00
5900
0 6727
3967
2
100.
0%
125.5
% 14.3% 84.4%
Ordinary Equity (OE) C
450
00
5700
0 5550
3507
3
100.
0%
126.7
% 12.3% 77.9%
Total Liabilities D
200
0 1000 1177 4599
100.
0% 50.0% 58.9%
230.0
%
Return on Assets (ROA)
E=
A/B
6.38
%
20.3
4%
-
62.48
%
-
6.50
%
100.
0%
318.6
4%
-
978.85
%
-
101.77
%
Return on Equity (ROE)
F=A/
C
6.67
%
21.0
5%
-
75.73
%
-
7.35
%
100.
0%
315.7
9%
-
1135.9
5%
-
110.21
%
Debt Ratio
G=D
/B
0.04
3
0.01
7 0.175
0.11
6
100.
0%
39.83
%
411.17
%
272.43
%
Taking into the considerations the above stated tabular representation TA is regarded
as the total assets while the OE is regarded as ordinary equity. Both the variables can be
interrelated with the return that is generated from the asset (ROA) and the return that is
derived from the equity (ROE) (Scott 2015). An increase in the return on the asset would
ultimately result in making an appropriate use of the asset employed in the business. This
would help in reflecting that there would increase in the net income the total asset would be
higher. Increase in the value of the asset with income being the same would help in lowering
the amount of the debt ratio (Schaltegger and Burritt 2017). The lower amount of the debt
Paraphrase This Document
Need a fresh take? Get an instant paraphrase of this document with our AI Paraphraser
4FINANCE
ratio would help in higher amount of return on equity. Therefore, the value of the return on
equity and return on asset is determined with the help of total amount of asset and equity.
The computation that has been done above represents that the return on equity that is
reported during the year 2014 stood 315.79% while in the subsequent year of 2015 and 2016
have declined significantly with -1135.95 and -110.21% respectively. This helps in reflecting
that the proficiency of the firm has declined significantly and insufficient use of the asset
employed in the firm (Warren and Jones 2018). For a healthy organization the amount of the
total assets generally continues to remain higher than the total amount of equity. This is
because the value of the assets that is reported by the firm is higher than the amount of equity
when the liabilities of the firm have declined significantly (Robson, Young and Power 2017).
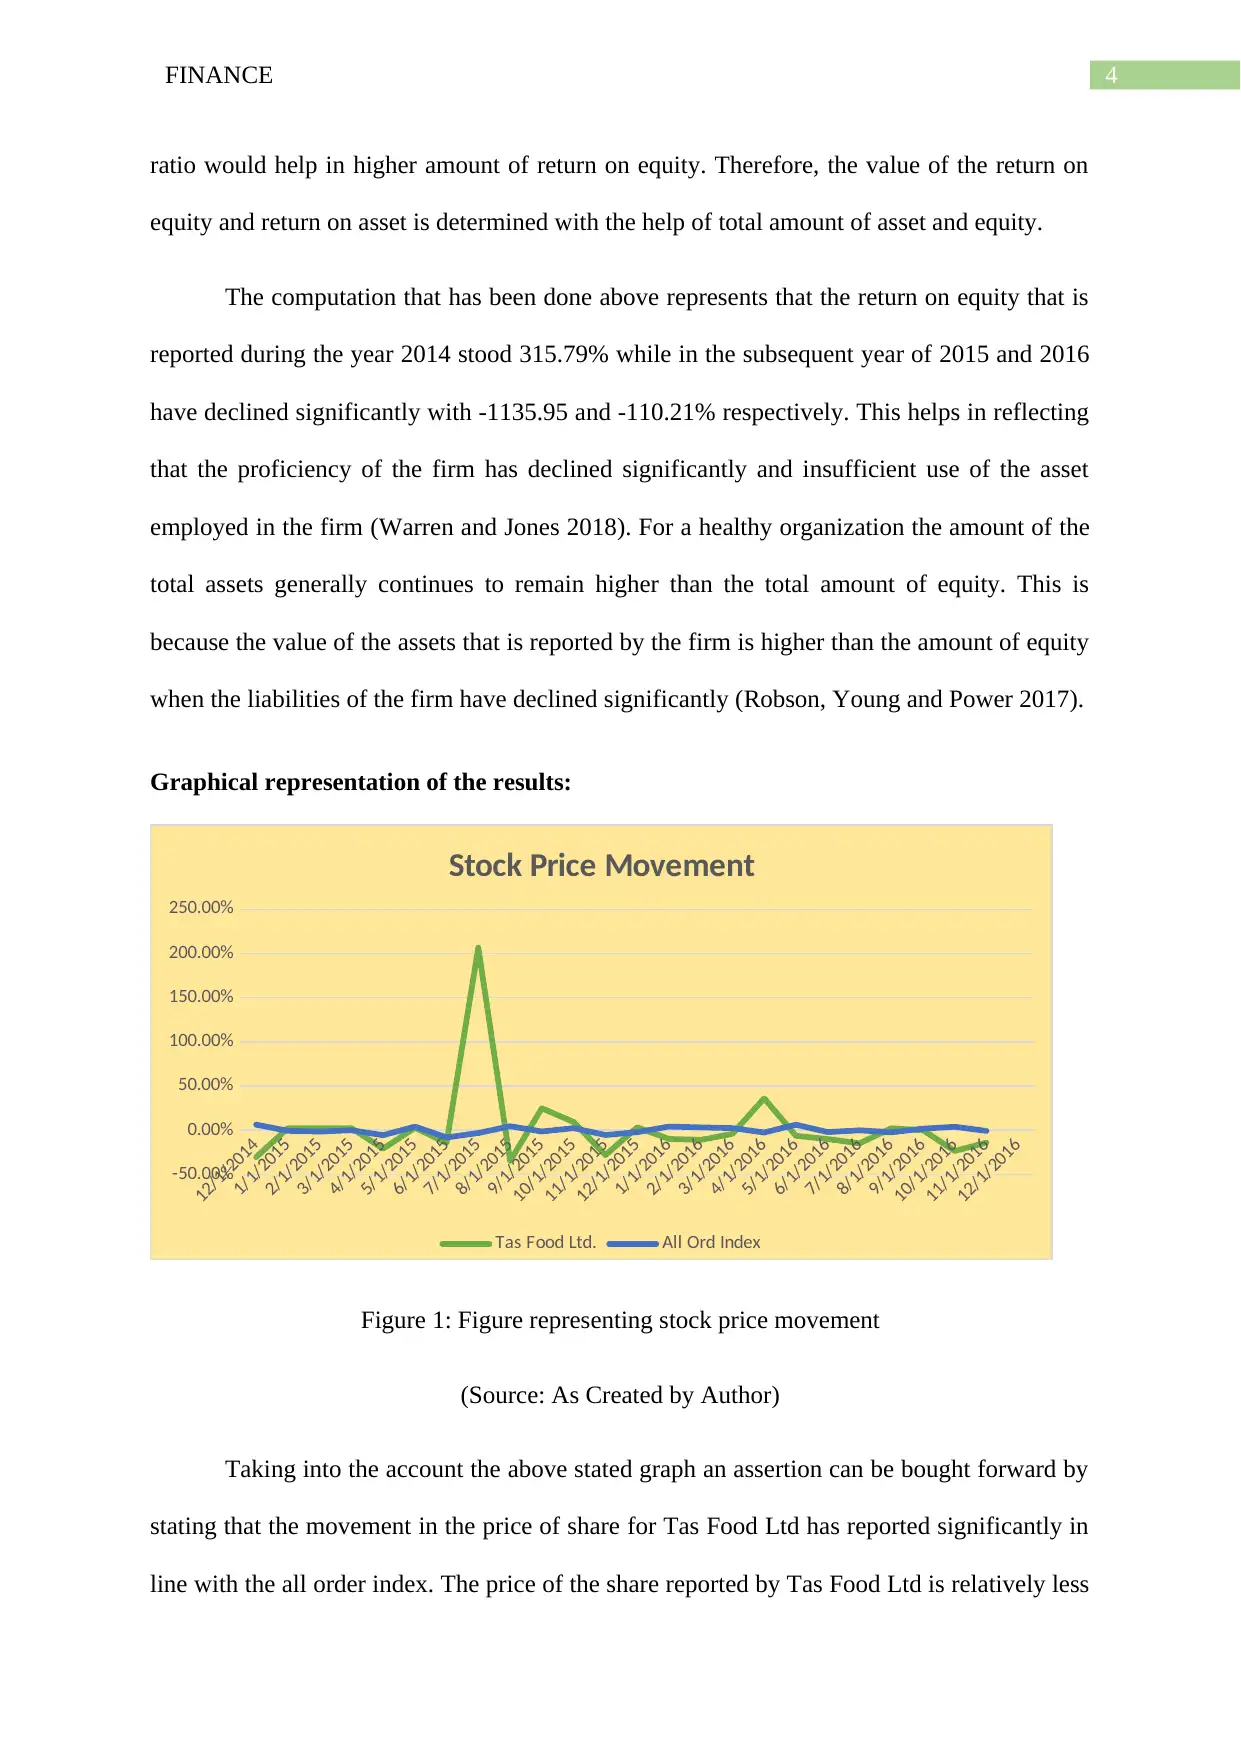
Graphical representation of the results:
12/1/2014
1/1/2015
2/1/2015
3/1/2015
4/1/2015
5/1/2015
6/1/2015
7/1/2015
8/1/2015
9/1/2015
10/1/2015
11/1/2015
12/1/2015
1/1/2016
2/1/2016
3/1/2016
4/1/2016
5/1/2016
6/1/2016
7/1/2016
8/1/2016
9/1/2016
10/1/2016
11/1/2016
12/1/2016
-50.00%
0.00%
50.00%
100.00%
150.00%
200.00%
250.00%
Stock Price Movement
Tas Food Ltd. All Ord Index
Figure 1: Figure representing stock price movement
(Source: As Created by Author)
Taking into the account the above stated graph an assertion can be bought forward by
stating that the movement in the price of share for Tas Food Ltd has reported significantly in
line with the all order index. The price of the share reported by Tas Food Ltd is relatively less
ratio would help in higher amount of return on equity. Therefore, the value of the return on
equity and return on asset is determined with the help of total amount of asset and equity.
The computation that has been done above represents that the return on equity that is
reported during the year 2014 stood 315.79% while in the subsequent year of 2015 and 2016
have declined significantly with -1135.95 and -110.21% respectively. This helps in reflecting
that the proficiency of the firm has declined significantly and insufficient use of the asset
employed in the firm (Warren and Jones 2018). For a healthy organization the amount of the
total assets generally continues to remain higher than the total amount of equity. This is
because the value of the assets that is reported by the firm is higher than the amount of equity
when the liabilities of the firm have declined significantly (Robson, Young and Power 2017).
Graphical representation of the results:
12/1/2014
1/1/2015
2/1/2015
3/1/2015
4/1/2015
5/1/2015
6/1/2015
7/1/2015
8/1/2015
9/1/2015
10/1/2015
11/1/2015
12/1/2015
1/1/2016
2/1/2016
3/1/2016
4/1/2016
5/1/2016
6/1/2016
7/1/2016
8/1/2016
9/1/2016
10/1/2016
11/1/2016
12/1/2016
-50.00%
0.00%
50.00%
100.00%
150.00%
200.00%
250.00%
Stock Price Movement
Tas Food Ltd. All Ord Index
Figure 1: Figure representing stock price movement
(Source: As Created by Author)
Taking into the account the above stated graph an assertion can be bought forward by
stating that the movement in the price of share for Tas Food Ltd has reported significantly in
line with the all order index. The price of the share reported by Tas Food Ltd is relatively less
5FINANCE
volatile except during the month of June and July where the company reported higher stock
price movement (Beatty and Liao 2014). The evidences that has been presented from the
stock price of Tas Food Ltd suggest that stock price on most of the circumstances have been
moderate. Opposing the higher amount of stock price there has been circumstances where the
company has reported fall in the stock price and at times it has declined below the all
ordinary index (Mullinova 2016).
Significant factor influencing the share price of Tas Food Ltd:
The share considerations for the Tas Food Ltd comprises of the issue of share of 9.2
million of ordinary shares that are valued at $2.3 million. Having the large market
capitalization the investors places the company at the category of the small cap and tends to
possess higher amount of beta in respect of the large companies (Macve 2015). One of the
most important factor that is associated with the creation of influence on the price of stock is
that the company deals in food and of late have strongly faced a wider market shocks. As
evident from the above stated analysis an assertion can be bought forward by stating that the
fixed asset of the firm have stood negatively which represents that the firm has been
insufficient in generating higher return from the assets (Reid and Myddelton 2017). This
significantly results in negative amount of beta with -1.27. This represents that the lower
amount of fixed assets will be reported on the balance sheet. The reported by the company is
significantly on the negative amount.
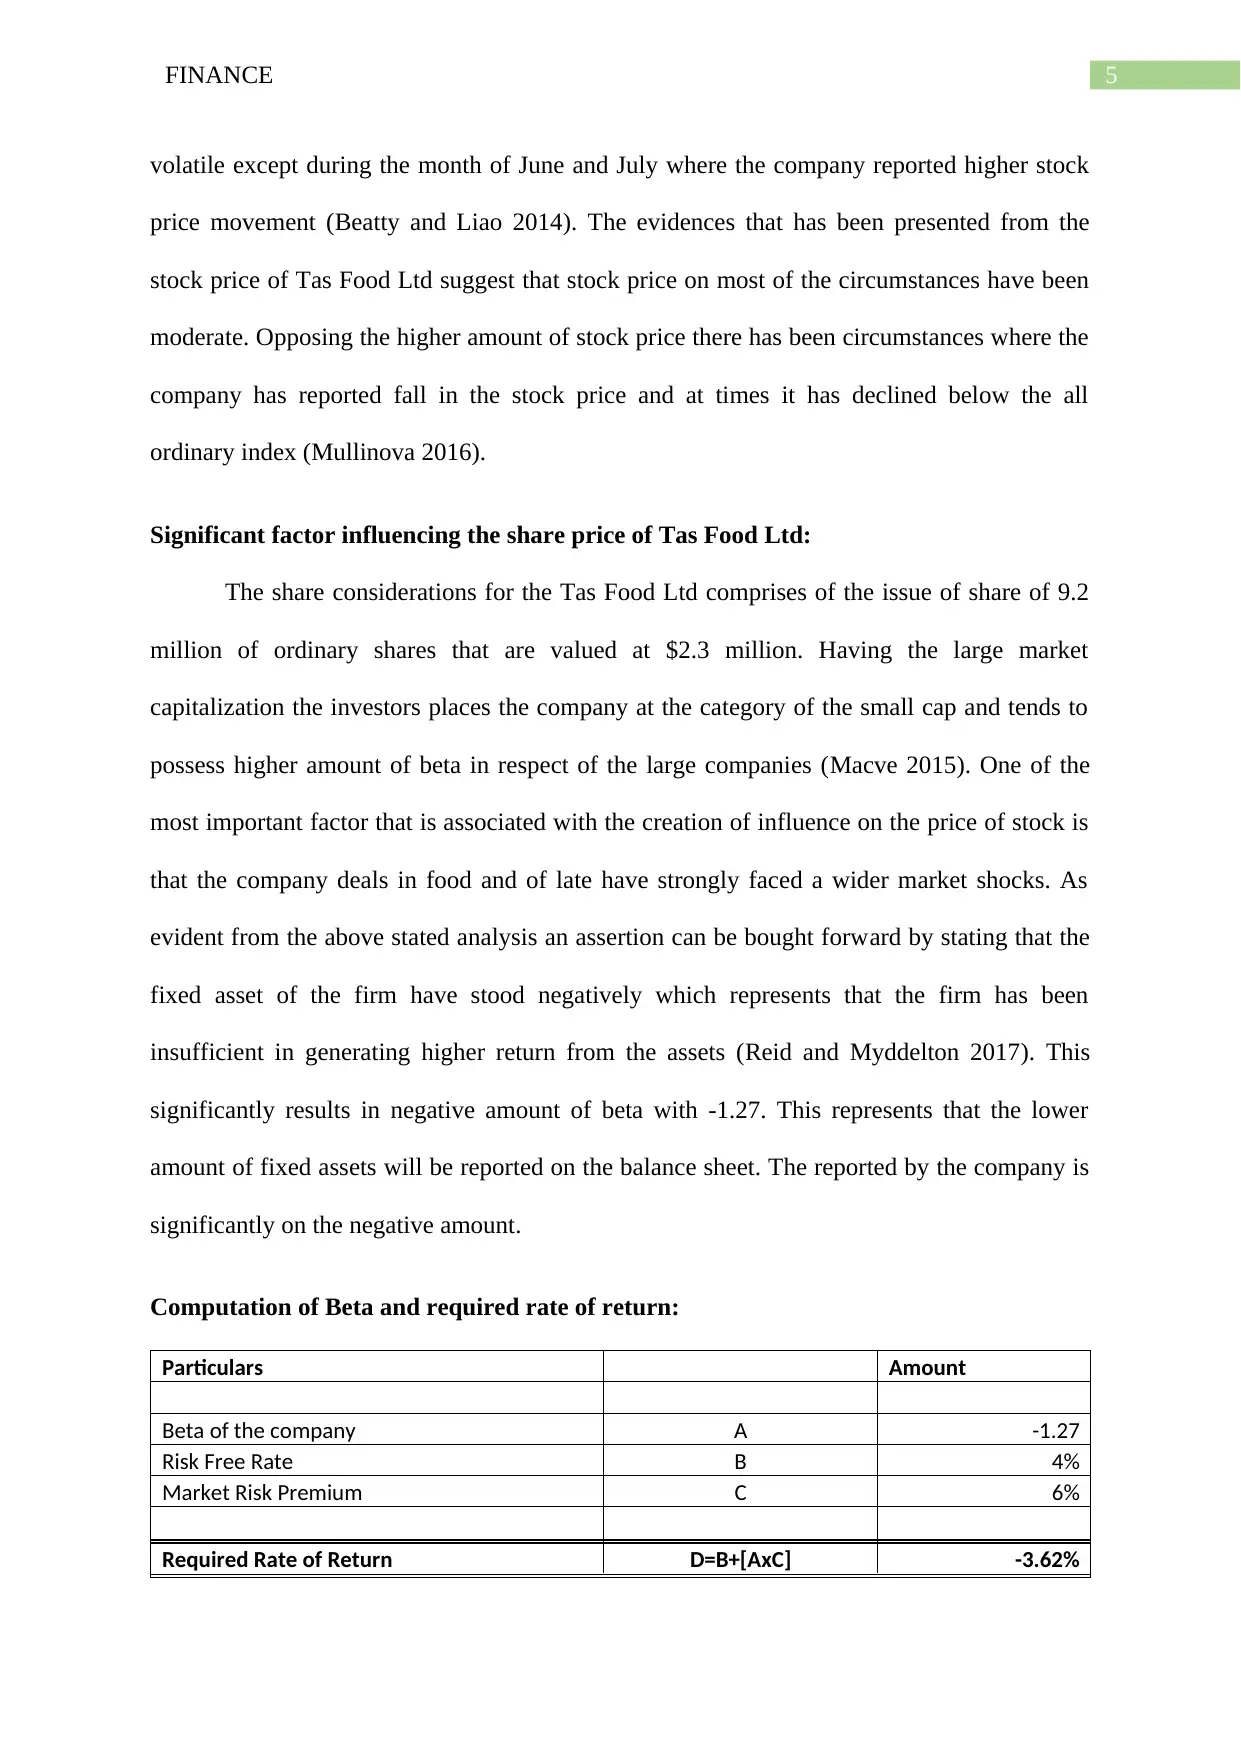
Computation of Beta and required rate of return:
Particulars Amount
Beta of the company A -1.27
Risk Free Rate B 4%
Market Risk Premium C 6%
Required Rate of Return D=B+[AxC] -3.62%
volatile except during the month of June and July where the company reported higher stock
price movement (Beatty and Liao 2014). The evidences that has been presented from the
stock price of Tas Food Ltd suggest that stock price on most of the circumstances have been
moderate. Opposing the higher amount of stock price there has been circumstances where the
company has reported fall in the stock price and at times it has declined below the all
ordinary index (Mullinova 2016).
Significant factor influencing the share price of Tas Food Ltd:
The share considerations for the Tas Food Ltd comprises of the issue of share of 9.2
million of ordinary shares that are valued at $2.3 million. Having the large market
capitalization the investors places the company at the category of the small cap and tends to
possess higher amount of beta in respect of the large companies (Macve 2015). One of the
most important factor that is associated with the creation of influence on the price of stock is
that the company deals in food and of late have strongly faced a wider market shocks. As
evident from the above stated analysis an assertion can be bought forward by stating that the
fixed asset of the firm have stood negatively which represents that the firm has been
insufficient in generating higher return from the assets (Reid and Myddelton 2017). This
significantly results in negative amount of beta with -1.27. This represents that the lower
amount of fixed assets will be reported on the balance sheet. The reported by the company is
significantly on the negative amount.
Computation of Beta and required rate of return:
Particulars Amount
Beta of the company A -1.27
Risk Free Rate B 4%
Market Risk Premium C 6%
Required Rate of Return D=B+[AxC] -3.62%
⊘ This is a preview!⊘
Do you want full access?
Subscribe today to unlock all pages.
Trusted by 1+ million students worldwide
6FINANCE
Trend
Particulars`
201
3
201
4 2015
201
6 2013 2014 2015 2016
EBIT A
300
0
180
00
-
2096
-
261
1
100.0
0%
600.0
0%
-
69.87
%
-
87.03
%
Total Assets B
470
00
590
00 6727
396
72
100.0
0%
125.5
3%
14.31
%
84.41
%
Net Profit/(Loss) after
Tax (NPAT) C
300
0
120
00
-
4203
-
257
7
100.0
0%
400.0
0%
-
140.10
%
-
85.90
%
Owner's Equity D
450
00
570
00 5550
350
73
100.0
0%
126.6
7%
12.33
%
77.94
%
Return on Equity
E=(A/
B)x(C/A)x
(B/D)
6.6
7%
21.0
5%
-
75.7
3%
-
7.35
%
100.0
0%
315.7
9%
-
1135.9
5%
-
110.2
1%
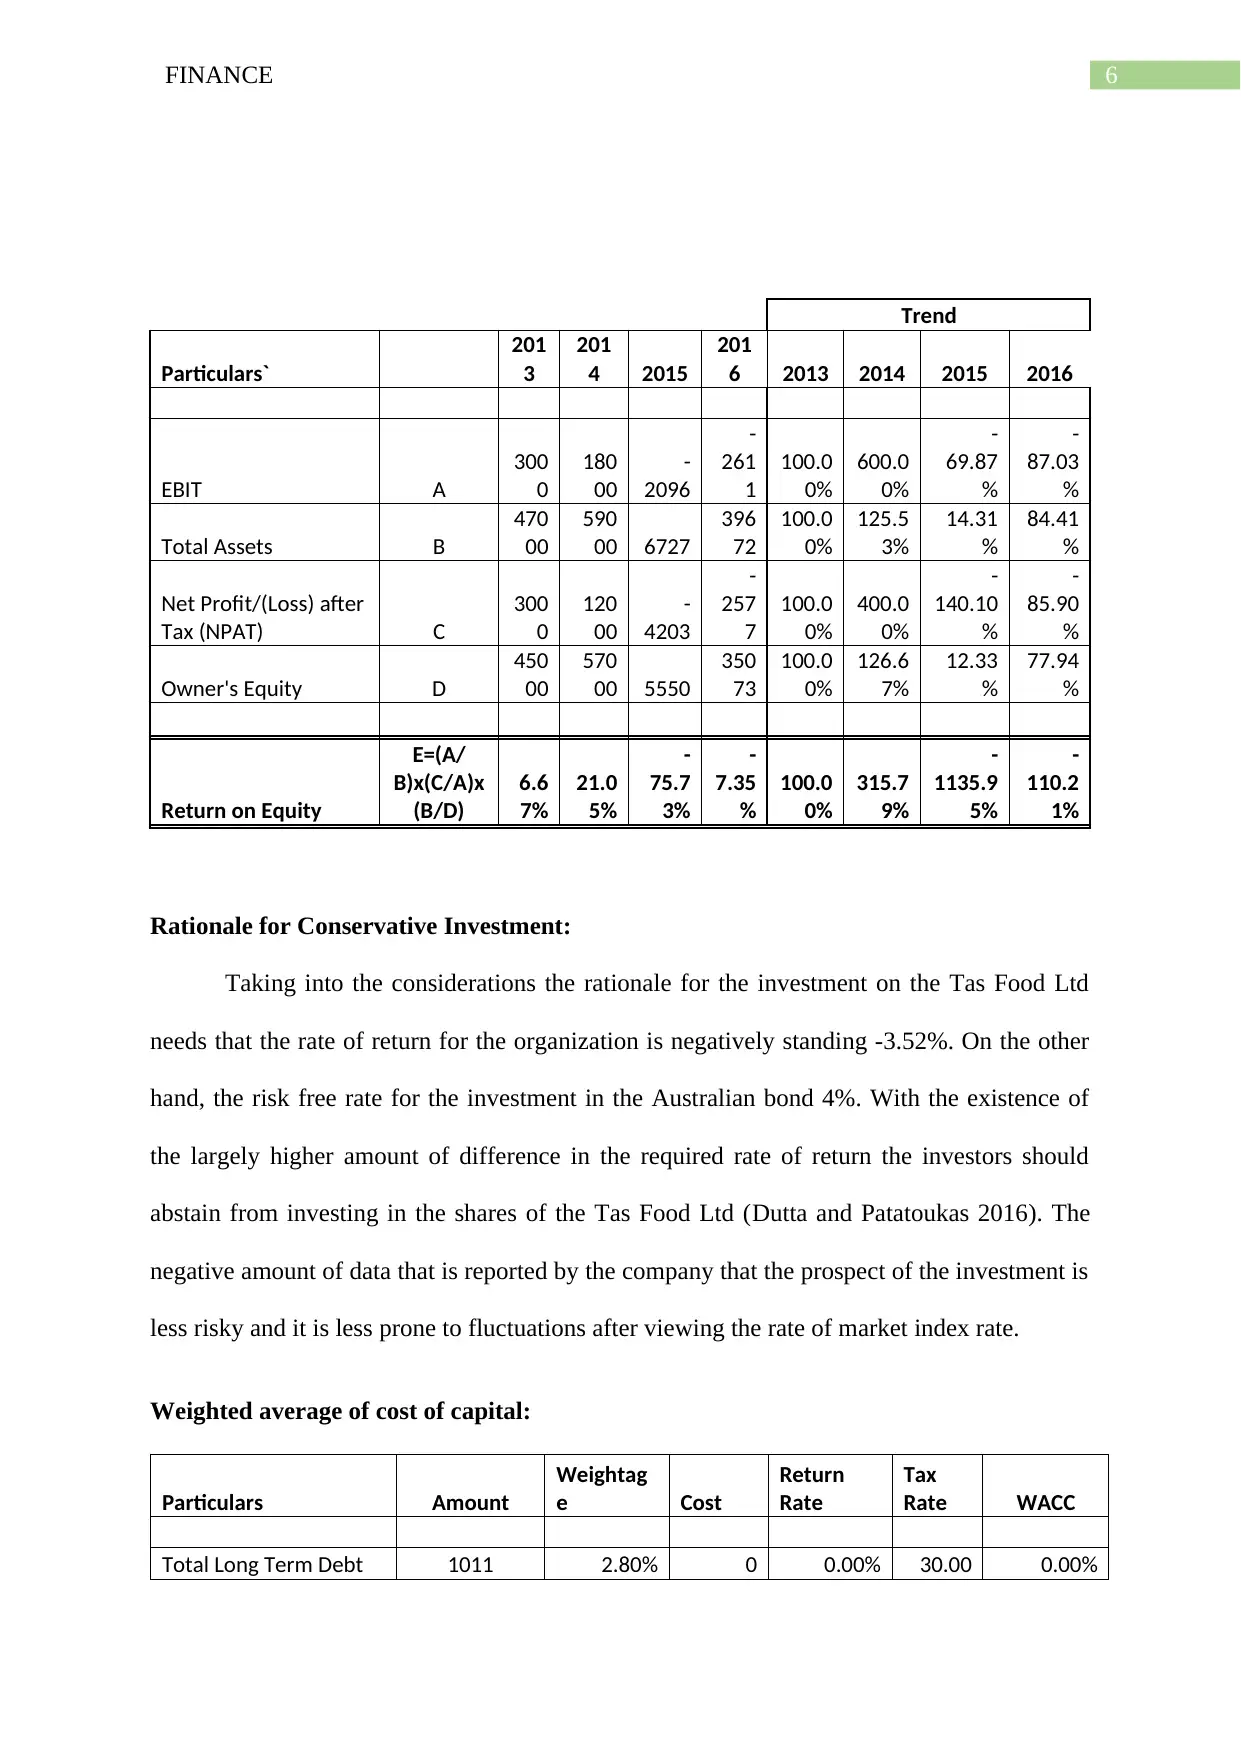
Rationale for Conservative Investment:
Taking into the considerations the rationale for the investment on the Tas Food Ltd
needs that the rate of return for the organization is negatively standing -3.52%. On the other
hand, the risk free rate for the investment in the Australian bond 4%. With the existence of
the largely higher amount of difference in the required rate of return the investors should
abstain from investing in the shares of the Tas Food Ltd (Dutta and Patatoukas 2016). The
negative amount of data that is reported by the company that the prospect of the investment is
less risky and it is less prone to fluctuations after viewing the rate of market index rate.
Weighted average of cost of capital:
Particulars Amount
Weightag
e Cost
Return
Rate
Tax
Rate WACC
Total Long Term Debt 1011 2.80% 0 0.00% 30.00 0.00%
Trend
Particulars`
201
3
201
4 2015
201
6 2013 2014 2015 2016
EBIT A
300
0
180
00
-
2096
-
261
1
100.0
0%
600.0
0%
-
69.87
%
-
87.03
%
Total Assets B
470
00
590
00 6727
396
72
100.0
0%
125.5
3%
14.31
%
84.41
%
Net Profit/(Loss) after
Tax (NPAT) C
300
0
120
00
-
4203
-
257
7
100.0
0%
400.0
0%
-
140.10
%
-
85.90
%
Owner's Equity D
450
00
570
00 5550
350
73
100.0
0%
126.6
7%
12.33
%
77.94
%
Return on Equity
E=(A/
B)x(C/A)x
(B/D)
6.6
7%
21.0
5%
-
75.7
3%
-
7.35
%
100.0
0%
315.7
9%
-
1135.9
5%
-
110.2
1%
Rationale for Conservative Investment:
Taking into the considerations the rationale for the investment on the Tas Food Ltd
needs that the rate of return for the organization is negatively standing -3.52%. On the other
hand, the risk free rate for the investment in the Australian bond 4%. With the existence of
the largely higher amount of difference in the required rate of return the investors should
abstain from investing in the shares of the Tas Food Ltd (Dutta and Patatoukas 2016). The
negative amount of data that is reported by the company that the prospect of the investment is
less risky and it is less prone to fluctuations after viewing the rate of market index rate.
Weighted average of cost of capital:
Particulars Amount
Weightag
e Cost
Return
Rate
Tax
Rate WACC
Total Long Term Debt 1011 2.80% 0 0.00% 30.00 0.00%
Paraphrase This Document
Need a fresh take? Get an instant paraphrase of this document with our AI Paraphraser
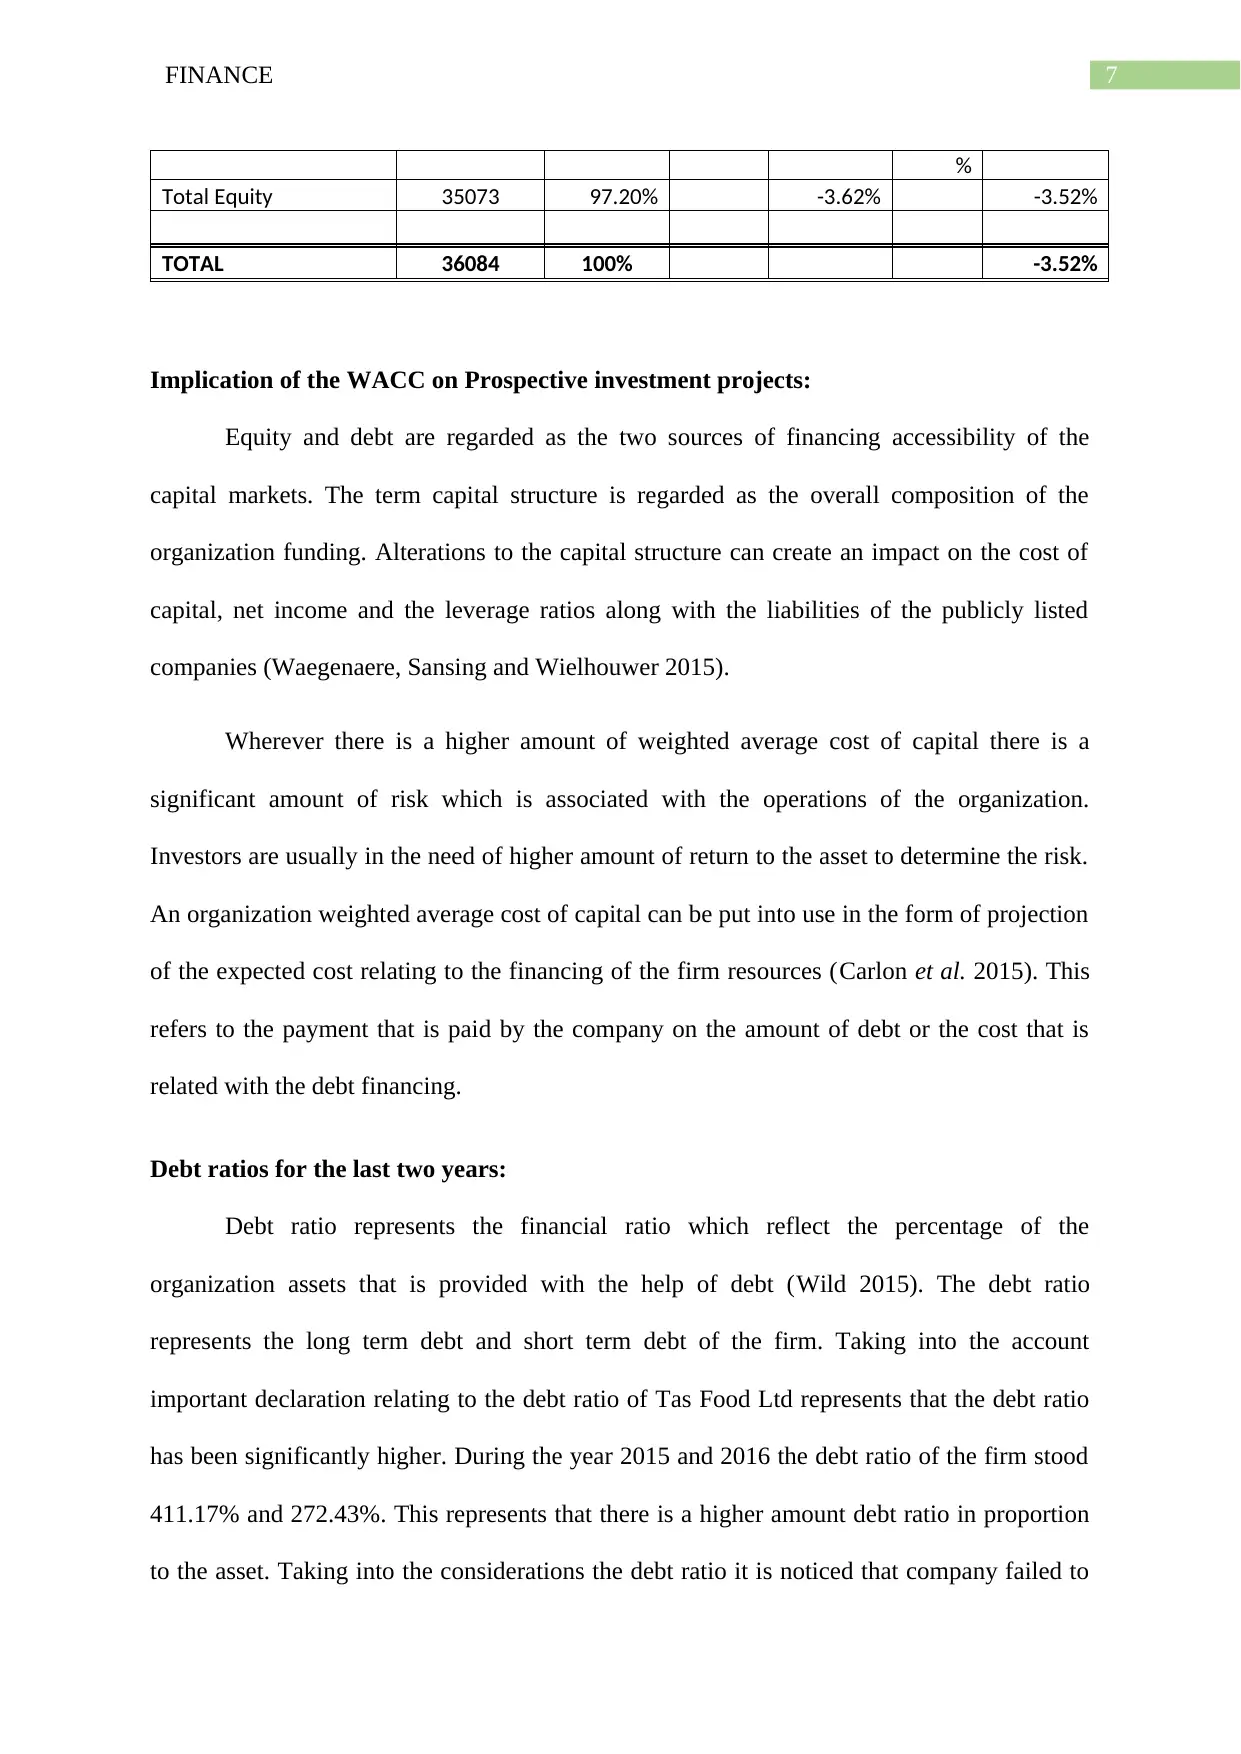
7FINANCE
%
Total Equity 35073 97.20% -3.62% -3.52%
TOTAL 36084 100% -3.52%
Implication of the WACC on Prospective investment projects:
Equity and debt are regarded as the two sources of financing accessibility of the
capital markets. The term capital structure is regarded as the overall composition of the
organization funding. Alterations to the capital structure can create an impact on the cost of
capital, net income and the leverage ratios along with the liabilities of the publicly listed
companies (Waegenaere, Sansing and Wielhouwer 2015).
Wherever there is a higher amount of weighted average cost of capital there is a
significant amount of risk which is associated with the operations of the organization.
Investors are usually in the need of higher amount of return to the asset to determine the risk.
An organization weighted average cost of capital can be put into use in the form of projection
of the expected cost relating to the financing of the firm resources (Carlon et al. 2015). This
refers to the payment that is paid by the company on the amount of debt or the cost that is
related with the debt financing.
Debt ratios for the last two years:
Debt ratio represents the financial ratio which reflect the percentage of the
organization assets that is provided with the help of debt (Wild 2015). The debt ratio
represents the long term debt and short term debt of the firm. Taking into the account
important declaration relating to the debt ratio of Tas Food Ltd represents that the debt ratio
has been significantly higher. During the year 2015 and 2016 the debt ratio of the firm stood
411.17% and 272.43%. This represents that there is a higher amount debt ratio in proportion
to the asset. Taking into the considerations the debt ratio it is noticed that company failed to
8FINANCE
take any positive initiative of lowering its debt and as a result of this the debt ratio reported
by the firm stood on the higher side (Barberis, et al. 2015).
Gearing ratio:
During the year 2016 in the month of February Tas food ltd issued 22,232,000
ordinary shares at $0.25 per share to the investors. Additionally, taking into the account the
gearing ratio for the Tas food ltd it can be stated that the company during the year 2016
reported a gearing ratio of 11.8%. Based on the gearing ratio of the firm an important
assertion can be stated that large portion of the capital for the firm comprises of the debt and
share capital (Ghosh, Julliard and Taylor 2016). As a result of this there is a higher amount of
debt ratio for the firm.
Dividend policy:
During the financial year of 2016 the company did not report any dividend to its
shareholders.
Letter of recommendation:
Dear ABC,
Queensland
Australia
Respected Sir,
I would like to draw your kind attention towards my recommendations that the
performance of the Tas food limited has been very poor in the financial year of 2016.
Additionally, it has been understood from the analysis that the company has reported a
negative figures of beta this represents that investing in this firm would result the investor
suffer losses. The beta of the company stood -1.27 with negative amount of required rate of
⊘ This is a preview!⊘
Do you want full access?
Subscribe today to unlock all pages.
Trusted by 1+ million students worldwide
9FINANCE
return standing -3.62. The company reported downturn in the price of share and with highly
risky profile the investors faces the risk of suffering heavy amount of loss. The prices of the
shares have been on the declining trend and this might not yield a higher return for the
investors.
I hope that the above stated analysis and recommendations has been successful in providing
the required information to the investors. It would be wise for the investors for abstaining
from making an investment in the Tas Food Ltd. I hope that the information that is provided
has helped in serving you with the required information relating to the investment decision.
Thanking you,
ABC
Investment Company
Paraphrase This Document
Need a fresh take? Get an instant paraphrase of this document with our AI Paraphraser
10FINANCE
Reference List:
Barberis, N., Greenwood, R., Jin, L. and Shleifer, A., 2015. X-CAPM: An extrapolative
capital asset pricing model. Journal of financial economics, 115(1), pp.1-24.
Beatty, A. and Liao, S., 2014. Financial accounting in the banking industry: A review of the
empirical literature. Journal of Accounting and Economics, 58(2-3), pp.339-383.
Callen, J.L., 2015. A selective critical review of financial accounting research. Critical
Perspectives on Accounting, 26, pp.157-167.
Campbell, J.Y., Giglio, S., Polk, C. and Turley, R., 2016. Appendix to an intertemporal
CAPM with stochastic volatility.
Carlon, S., McAlpine-Mladenovic, R., Palm, C., Mitrione, L., Kirk, N. and Wong, L.,
2015. Financial Accounting: Reporting, Analysis and Decision Making. John Wiley and Sons
Australia.
Dufour, J.M., 2017. Time series and financial econometrics Multivariate linear linear
regression and CAPM Exercises.
Dutta, S. and Patatoukas, P.N., 2016. Identifying Conditional Conservatism in Financial
Accounting Data: Theory and Evidence. The Accounting Review, 92(4), pp.191-216.
Editorial, R. (2018). Market Indices | Reuters.com. [online] U.S. Available at:
https://www.reuters.com/finance/markets/indices [Accessed 30 Jan. 2018].
Fernandez, P., 2015. CAPM: an absurd model. Business Valuation Review, 34(1), pp.4-23.
Fernandez, P., 2017. CAPM: The Model and 307 Comments About It.
11FINANCE
Ghosh, A., Julliard, C. and Taylor, A.P., 2016. What is the consumption-CAPM missing? An
information-theoretic framework for the analysis of asset pricing models. The Review of
Financial Studies, 30(2), pp.442-504.
Macve, R., 2015. A Conceptual Framework for Financial Accounting and Reporting: Vision,
Tool, Or Threat?. Routledge.
Mullinova, S., 2016. Use of the principles of IFRS (IAS) 39" Financial instruments:
recognition and assessment" for bank financial accounting. Modern European Researches,
(1), pp.60-64.
Reid, W. and Myddelton, D.R., 2017. The meaning of company accounts. Routledge.
Robson, K., Young, J. and Power, M., 2017. Themed section on financial accounting as
social and organizational practice: exploring the work of financial reporting. Accounting,
Organizations and Society, 56, pp.35-37.
Schaltegger, S. and Burritt, R., 2017. Contemporary environmental accounting: issues,
concepts and practice. Routledge.
Scott, W.R., 2015. Financial accounting theory (Vol. 2, No. 0, p. 0). Prentice Hall.
TasFoods Ltd. (2018). Home. [online] Available at: http://www.tasfoods.com.au/ [Accessed
30 Jan. 2018].
Waegenaere, A., Sansing, R. and Wielhouwer, J.L., 2015. Financial accounting effects of tax
aggressiveness: Contracting and measurement. Contemporary Accounting Research, 32(1),
pp.223-242.
Warren, C.S. and Jones, J., 2018. Corporate financial accounting. Cengage Learning.
Wild, J., 2015. Financial accounting fundamentals. McGraw-Hill Higher Education.
⊘ This is a preview!⊘
Do you want full access?
Subscribe today to unlock all pages.
Trusted by 1+ million students worldwide
1 out of 13
Related Documents


![Strategic Management Analysis of Bellamy's Organic - [University]](/_next/image/?url=https%3A%2F%2Fdesklib.com%2Fmedia%2Fimages%2Fdx%2F9ae26af63ac84162bd7d7d39e54e2da9.jpg&w=256&q=75)
Your All-in-One AI-Powered Toolkit for Academic Success.
+13062052269
info@desklib.com
Available 24*7 on WhatsApp / Email
![[object Object]](/_next/static/media/star-bottom.7253800d.svg)
Unlock your academic potential
Copyright © 2020–2026 A2Z Services. All Rights Reserved. Developed and managed by ZUCOL.