Financial Analysis and Business Valuation Report: Tassal Group Limited
VerifiedAdded on 2023/06/11
|27
|7432
|424
Report
AI Summary
This report presents a comprehensive business valuation and financial analysis of Tassal Group Limited, an Australian company engaged in farming, processing, and marketing Atlantic salmon. The analysis includes forecasting sales growth, asset turnover, profit margins, cost of equity, and dividend payout ratios based on the company's historical financial data. The report employs various valuation models, including the dividend discount model, residual income model, residual operating income model, and free cash flow model, to determine the company's worth. Sensitivity analysis is conducted to assess the impact of key assumptions on the valuation results. Furthermore, the report provides management consulting advice, identifying potential opportunities, challenges, and recommended remedies for Tassal Group. The forecasting is done on the basis of the annual report and final financial statement of the company to measure that what are the upcoming changes into the financial items in the upcoming years. The report concludes with an overall assessment of the company's financial performance and valuation.
Running Head: Business Valuation and Financial Analysis 1
Project Report: Business valuation and analysis
Project Report: Business valuation and analysis
Paraphrase This Document
Need a fresh take? Get an instant paraphrase of this document with our AI Paraphraser
Business Valuation and Financial Analysis 2
Contents
Introduction ...................................................................................................................... 3
Forecasting ....................................................................................................................... 3
Sales growth: ................................................................................................................ 4
Asset turnover ratio: ..................................................................................................... 6
Profit Margin: ............................................................................................................... 7
Net dividend payout ratio: ............................................................................................ 8
Cost of debt: ................................................................................................................. 9
Cost of equity: ............................................................................................................ 10
Valuation ........................................................................................................................ 11
Dividend discount model:........................................................................................... 12
Residual income model: ............................................................................................. 13
Residual operating income model: ............................................................................. 15
Free cash flow: ........................................................................................................... 16
Sensitivity analysis ......................................................................................................... 19
Management consulting advice ...................................................................................... 20
Potential opportunities: ............................................................................................... 21
Challenges: ................................................................................................................. 21
Remedies: ................................................................................................................... 21
Conclusion ...................................................................................................................... 22
References ...................................................................................................................... 23
Appendix ........................................................................................................................ 26
Business Valuation and Financial Analysis 3
Introduction:
Evaluating the worth of an organization is one of the crucial parts of a business. It is a
systematic procedure which is conducted by the professionals and the financial officer of the
company to evaluate the exact worth and the capitalization of the business. It evaluates the
financial items and the value of the company to generate an idea about the overall price and
worth of the company. This process is used when an organization is trying to buy a company
or sell their company. This process is also useful to measure the investment position of the
company (Ward, 2012). investors who are looking for long term investment, takes the help
of business valuation method to analyze that whether the firm would offer great returns to the
investors or not.
Tassal group limited is an Australian company which is operating its business through
various subsidiary companies. The company mainly engages in the farming, hatching, selling,
processing and marketing Atlantic salmon in Australian market. The main product of the
company, Atlantic salmon, is sold by the company in various categories such as canned,
smoked, fresh and frozen. The name of the brands of the company is Tassal superior gold, De
Costi Seafood, Tasmanian smokehouse etc through its wholesale and retail channels.
Forecasting:
Forecasting is a process which projects the future performance and place of the
business on the basis of the historical data of the business (Weston and Brigham, 2015). the
forecasting process measures the changes into the final financial statement of the company in
last few years and on the basis of that, it is measured that what changes would take place in
the company in upcoming years. In the report, the forecasting has been done on the basis of
the annual report and final financial statement of the company to measure that what are the
upcoming changes into the financial items in the upcoming years.
The forecasting process has mainly be done on the sales growth (SG), profit margin
(PM), asset turnover ratio (ATO), cost of equity (Ke), dividend payout, cost of debt etc. the
forecasting of these item have been done on the basis of the last 5 years financial
performance and position of Tassal Group. The focus has been done on each activity as every
activity mainly affects on the total worth of the company. In case of Tassal group plc, it has
been measured that the performance and the position of the business is continuously
enhancing. The stock price of the company has also been enhanced from $ 1.94 to $ 4.10
from 30 June 2013 to 2nd June 2018 (Yahoo Finance, 2018). The changes into the financial
⊘ This is a preview!⊘
Do you want full access?
Subscribe today to unlock all pages.
Trusted by 1+ million students worldwide
Business Valuation and Financial Analysis 4
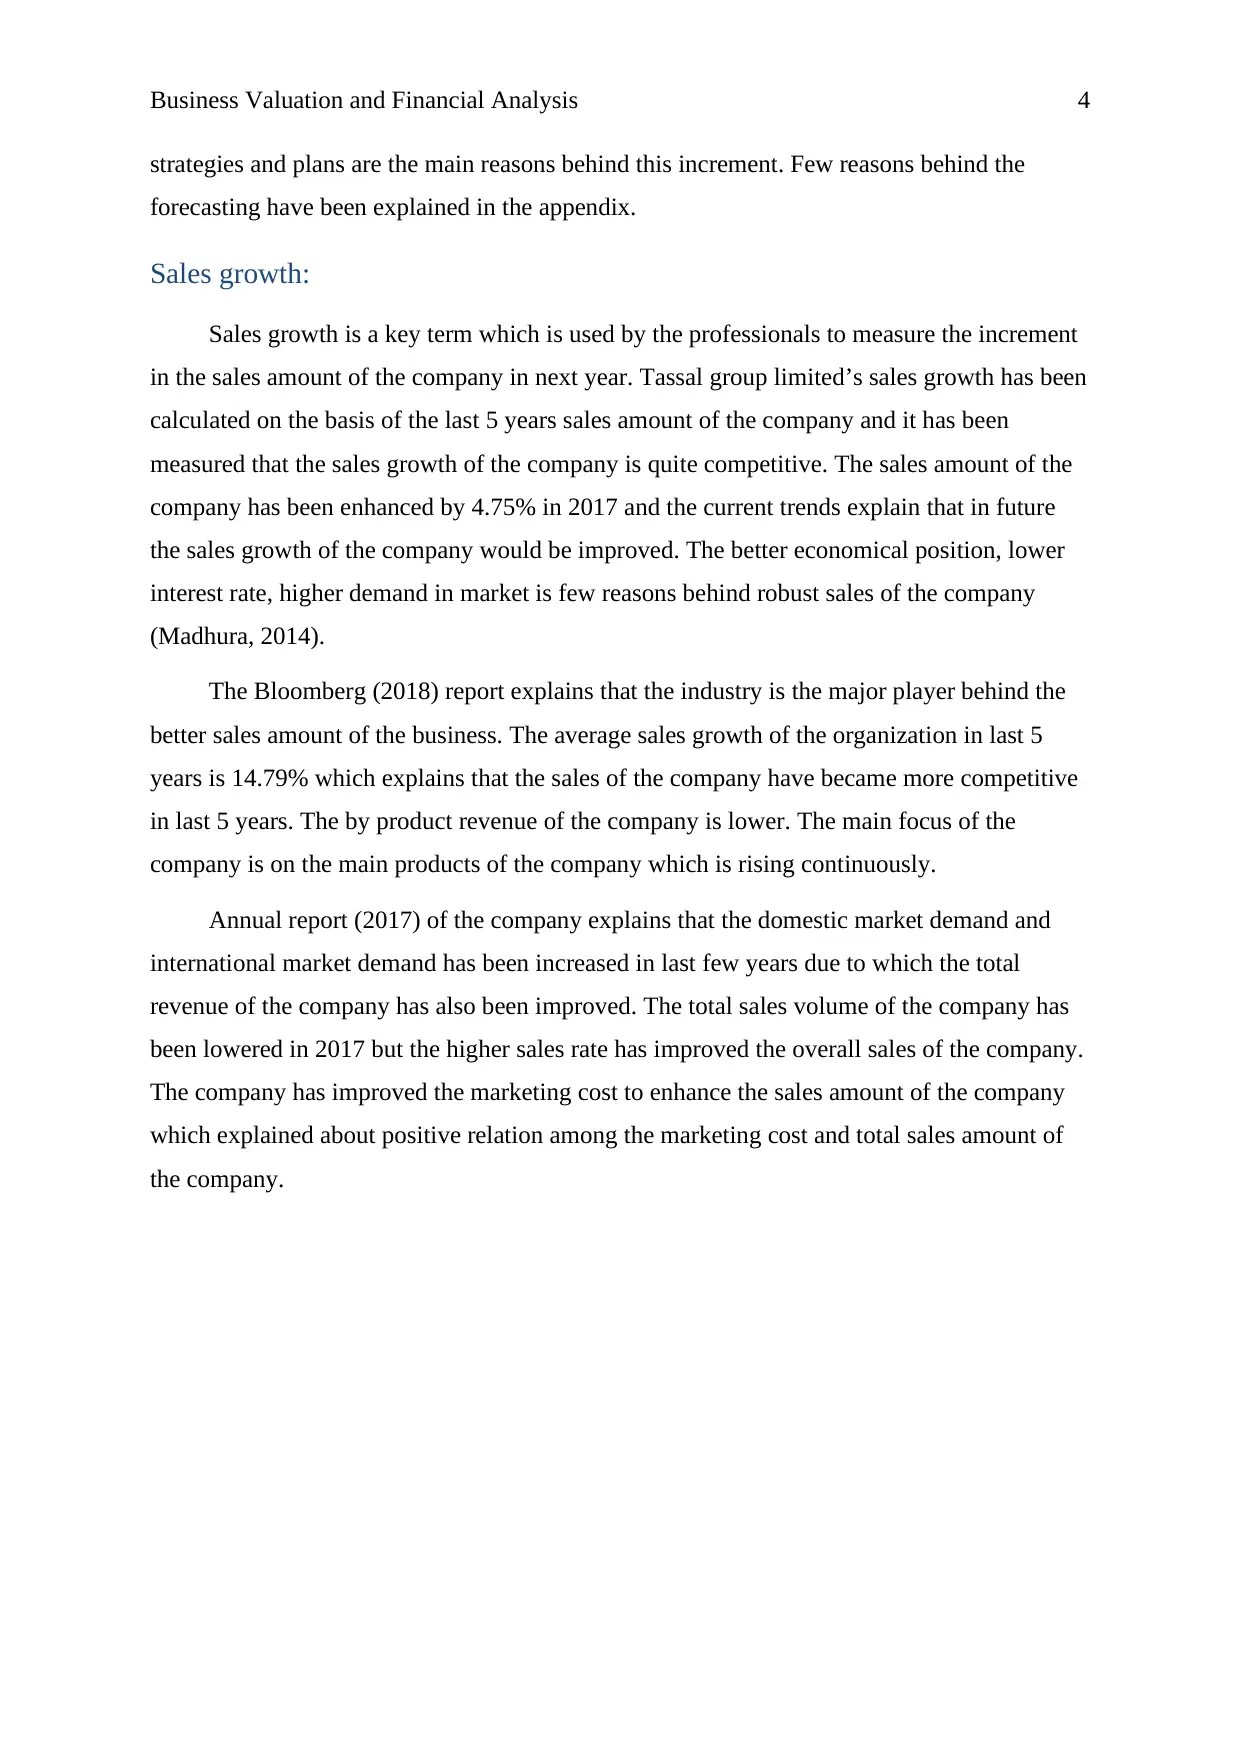
strategies and plans are the main reasons behind this increment. Few reasons behind the
forecasting have been explained in the appendix.
Sales growth:
Sales growth is a key term which is used by the professionals to measure the increment
in the sales amount of the company in next year. Tassal group limited’s sales growth has been
calculated on the basis of the last 5 years sales amount of the company and it has been
measured that the sales growth of the company is quite competitive. The sales amount of the
company has been enhanced by 4.75% in 2017 and the current trends explain that in future
the sales growth of the company would be improved. The better economical position, lower
interest rate, higher demand in market is few reasons behind robust sales of the company
(Madhura, 2014).
The Bloomberg (2018) report explains that the industry is the major player behind the
better sales amount of the business. The average sales growth of the organization in last 5
years is 14.79% which explains that the sales of the company have became more competitive
in last 5 years. The by product revenue of the company is lower. The main focus of the
company is on the main products of the company which is rising continuously.
Annual report (2017) of the company explains that the domestic market demand and
international market demand has been increased in last few years due to which the total
revenue of the company has also been improved. The total sales volume of the company has
been lowered in 2017 but the higher sales rate has improved the overall sales of the company.
The company has improved the marketing cost to enhance the sales amount of the company
which explained about positive relation among the marketing cost and total sales amount of
the company.
Paraphrase This Document
Need a fresh take? Get an instant paraphrase of this document with our AI Paraphraser
Business Valuation and Financial Analysis 5
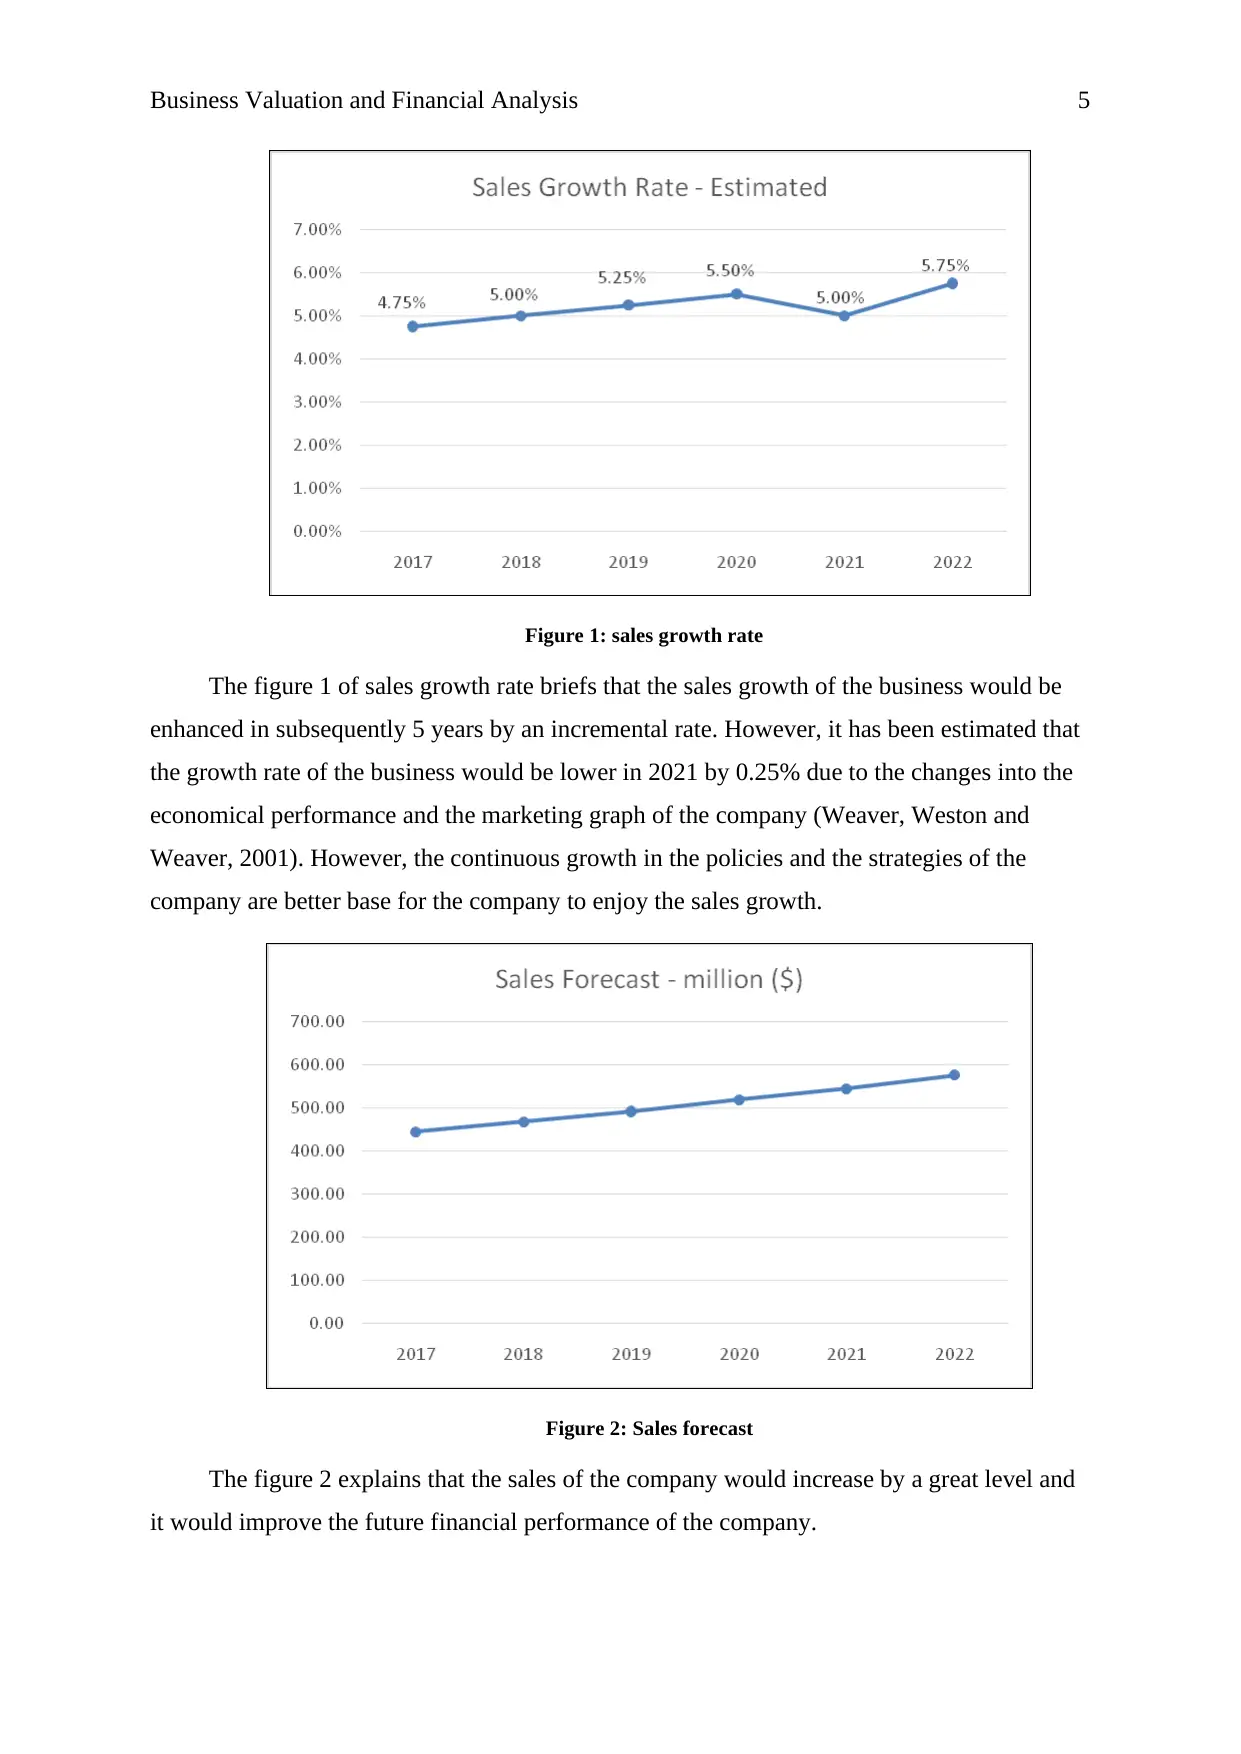
Figure 1: sales growth rate
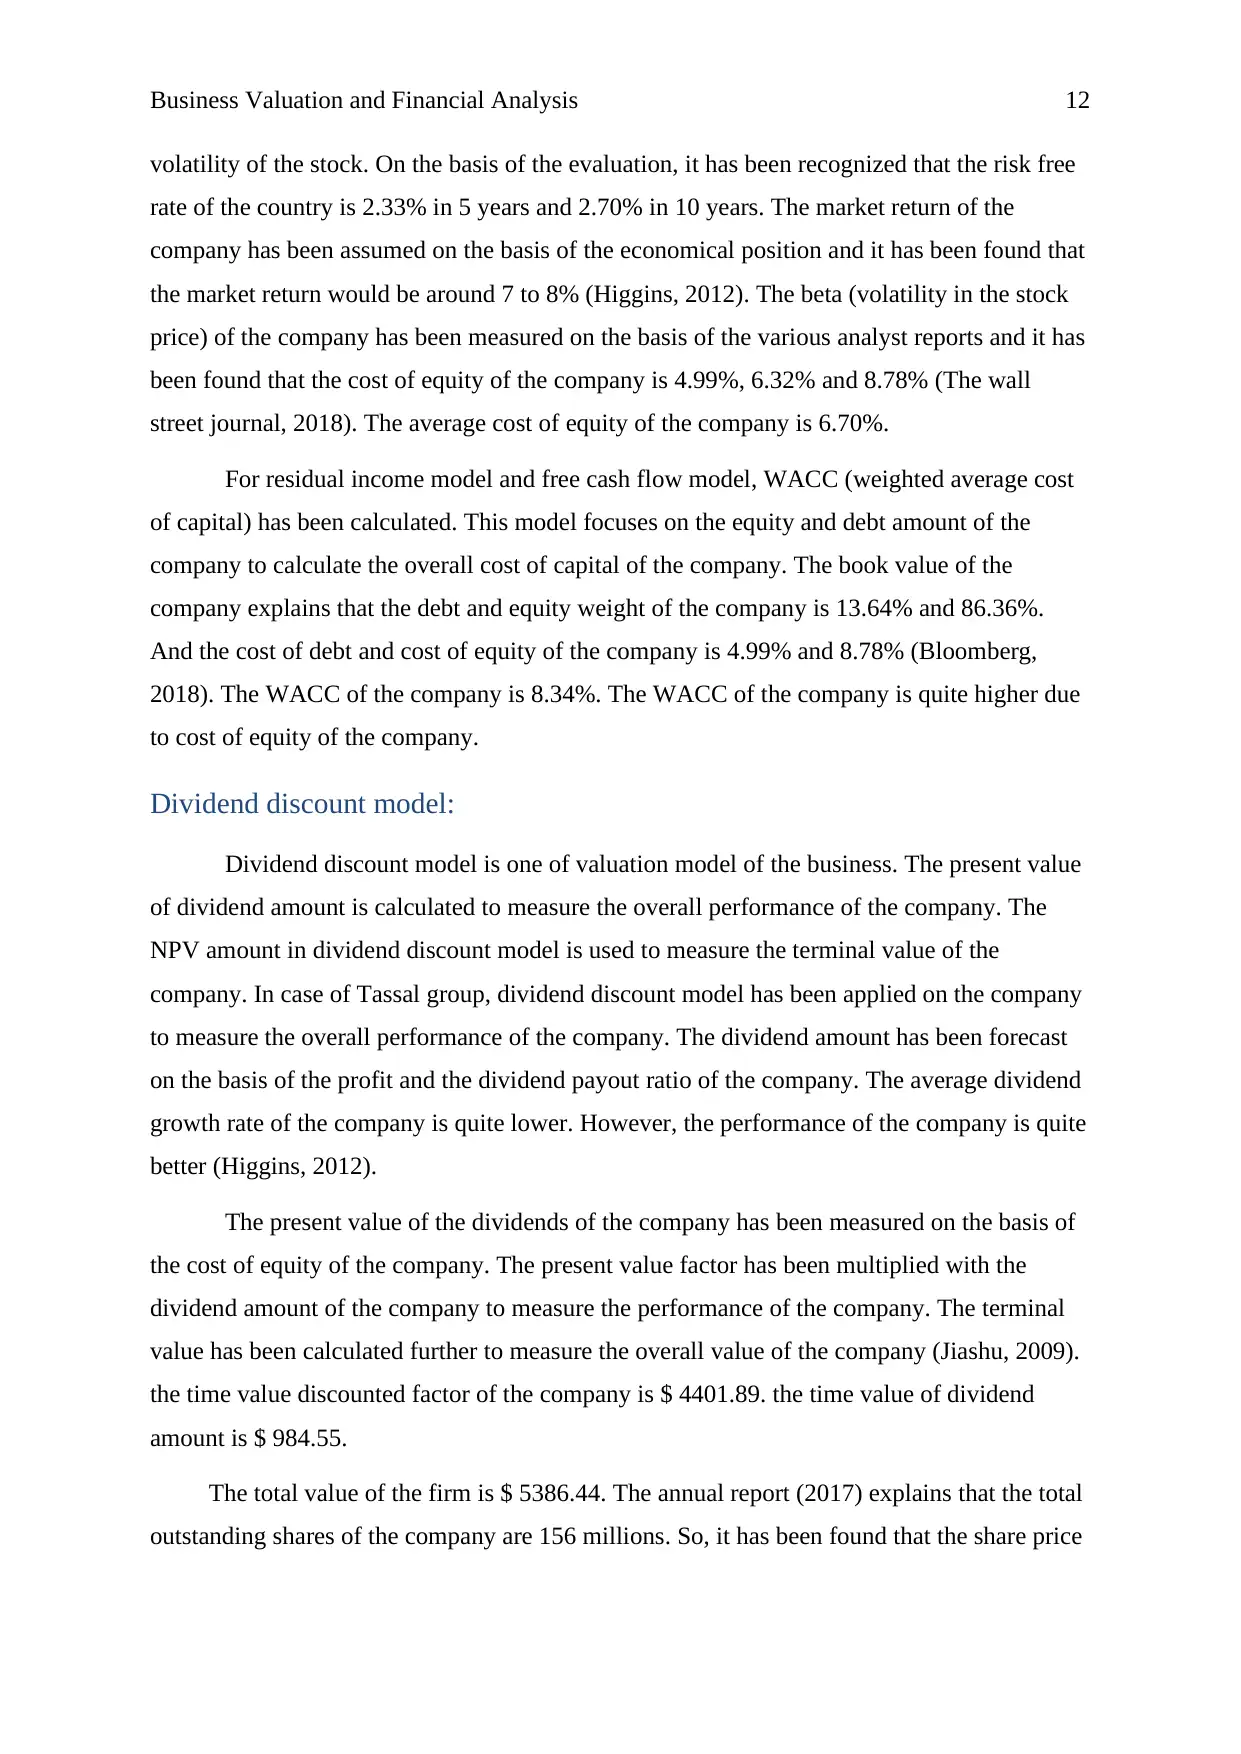
The figure 1 of sales growth rate briefs that the sales growth of the business would be
enhanced in subsequently 5 years by an incremental rate. However, it has been estimated that
the growth rate of the business would be lower in 2021 by 0.25% due to the changes into the
economical performance and the marketing graph of the company (Weaver, Weston and
Weaver, 2001). However, the continuous growth in the policies and the strategies of the
company are better base for the company to enjoy the sales growth.
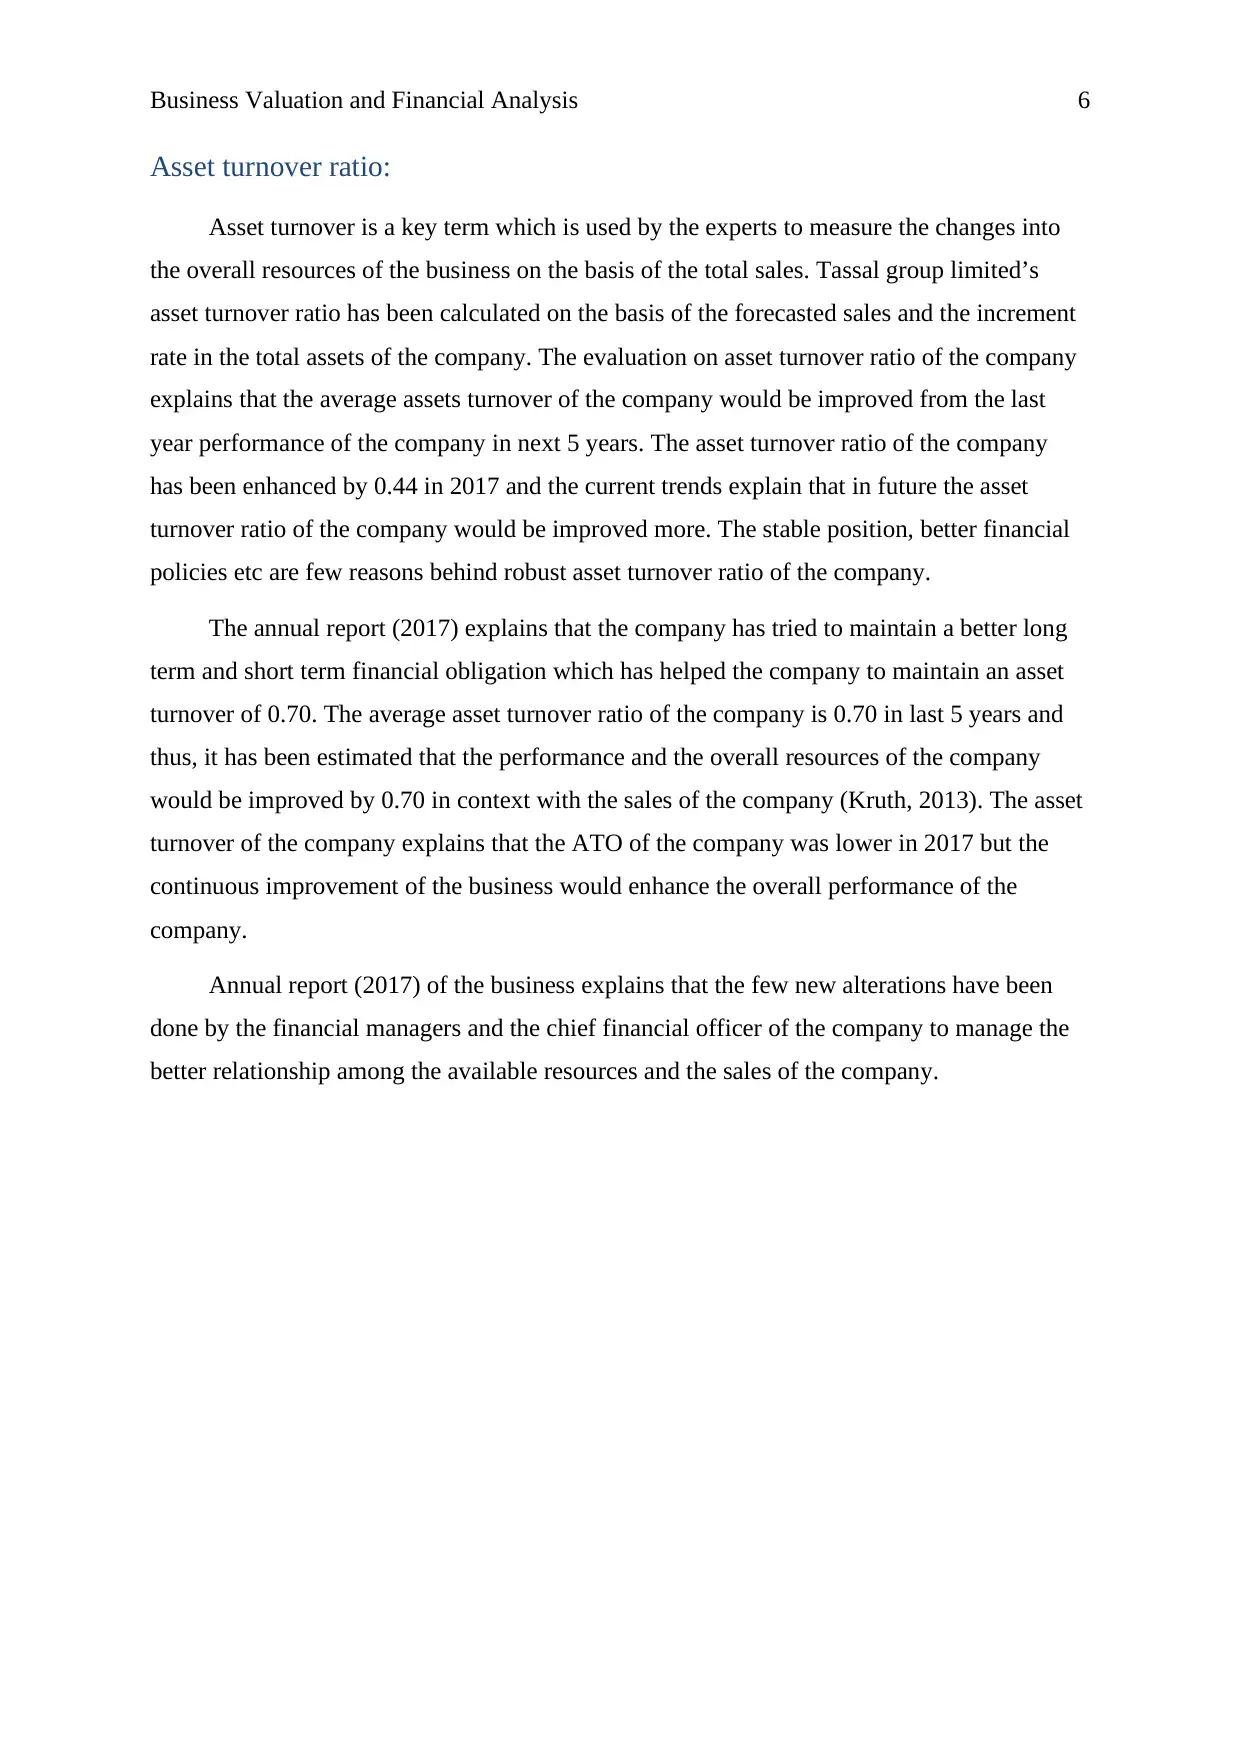
Figure 2: Sales forecast
The figure 2 explains that the sales of the company would increase by a great level and
it would improve the future financial performance of the company.
Figure 1: sales growth rate
The figure 1 of sales growth rate briefs that the sales growth of the business would be
enhanced in subsequently 5 years by an incremental rate. However, it has been estimated that
the growth rate of the business would be lower in 2021 by 0.25% due to the changes into the
economical performance and the marketing graph of the company (Weaver, Weston and
Weaver, 2001). However, the continuous growth in the policies and the strategies of the
company are better base for the company to enjoy the sales growth.
Figure 2: Sales forecast
The figure 2 explains that the sales of the company would increase by a great level and
it would improve the future financial performance of the company.
Business Valuation and Financial Analysis 6
Asset turnover ratio:
Asset turnover is a key term which is used by the experts to measure the changes into
the overall resources of the business on the basis of the total sales. Tassal group limited’s
asset turnover ratio has been calculated on the basis of the forecasted sales and the increment
rate in the total assets of the company. The evaluation on asset turnover ratio of the company
explains that the average assets turnover of the company would be improved from the last
year performance of the company in next 5 years. The asset turnover ratio of the company
has been enhanced by 0.44 in 2017 and the current trends explain that in future the asset
turnover ratio of the company would be improved more. The stable position, better financial
policies etc are few reasons behind robust asset turnover ratio of the company.
The annual report (2017) explains that the company has tried to maintain a better long
term and short term financial obligation which has helped the company to maintain an asset
turnover of 0.70. The average asset turnover ratio of the company is 0.70 in last 5 years and
thus, it has been estimated that the performance and the overall resources of the company
would be improved by 0.70 in context with the sales of the company (Kruth, 2013). The asset
turnover of the company explains that the ATO of the company was lower in 2017 but the
continuous improvement of the business would enhance the overall performance of the
company.
Annual report (2017) of the business explains that the few new alterations have been
done by the financial managers and the chief financial officer of the company to manage the
better relationship among the available resources and the sales of the company.
⊘ This is a preview!⊘
Do you want full access?
Subscribe today to unlock all pages.
Trusted by 1+ million students worldwide
Business Valuation and Financial Analysis 7
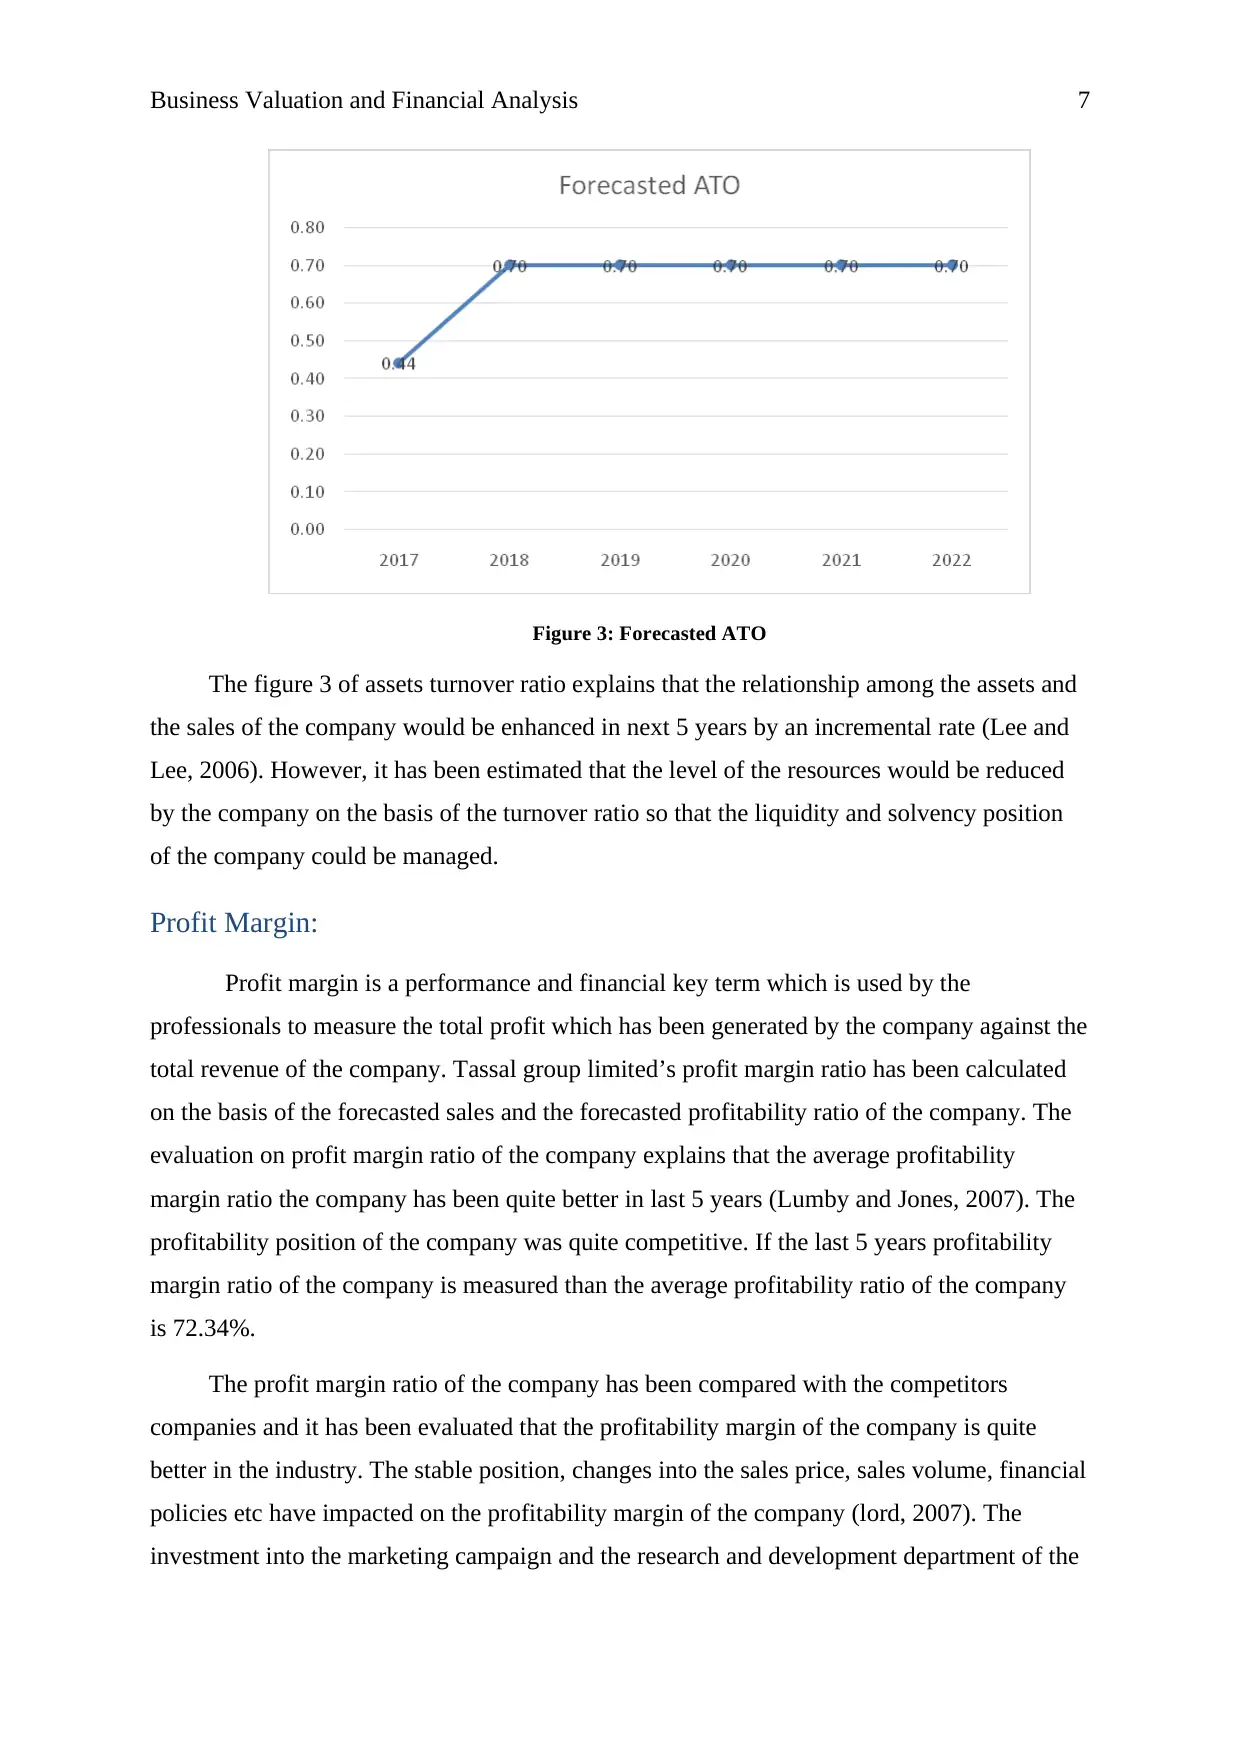
Figure 3: Forecasted ATO
The figure 3 of assets turnover ratio explains that the relationship among the assets and
the sales of the company would be enhanced in next 5 years by an incremental rate (Lee and
Lee, 2006). However, it has been estimated that the level of the resources would be reduced
by the company on the basis of the turnover ratio so that the liquidity and solvency position
of the company could be managed.
Profit Margin:
Profit margin is a performance and financial key term which is used by the
professionals to measure the total profit which has been generated by the company against the
total revenue of the company. Tassal group limited’s profit margin ratio has been calculated
on the basis of the forecasted sales and the forecasted profitability ratio of the company. The
evaluation on profit margin ratio of the company explains that the average profitability
margin ratio the company has been quite better in last 5 years (Lumby and Jones, 2007). The
profitability position of the company was quite competitive. If the last 5 years profitability
margin ratio of the company is measured than the average profitability ratio of the company
is 72.34%.
The profit margin ratio of the company has been compared with the competitors
companies and it has been evaluated that the profitability margin of the company is quite
better in the industry. The stable position, changes into the sales price, sales volume, financial
policies etc have impacted on the profitability margin of the company (lord, 2007). The
investment into the marketing campaign and the research and development department of the
Paraphrase This Document
Need a fresh take? Get an instant paraphrase of this document with our AI Paraphraser
Business Valuation and Financial Analysis 8
company has been improved. Further, it has also been evaluated that the changes into the
depreciation and other expenses have also improved the profitability level of the company.
The annual report (2017) explains that the company has tried to maintain a better
profitability position in last 5 years which has helped the company to maintain a competitive
state in the market. The average profitability ratio of the company is 72.34% in last 5 years
and thus, it has been estimated that the presentation and the profitability position of the
company have been improved by 72.34% in context with the sales of the business (Kinsky,
2011). The profitability margin ratio of the business explains that the enhanced sales have
positively impacted on the total profitability amount of the company.
Annual report (2017) of the company explains that the few new changes have been
done by the financial managers and the chief financial officer of the company to manage the
better relationship among the total profit and the sales of the company.
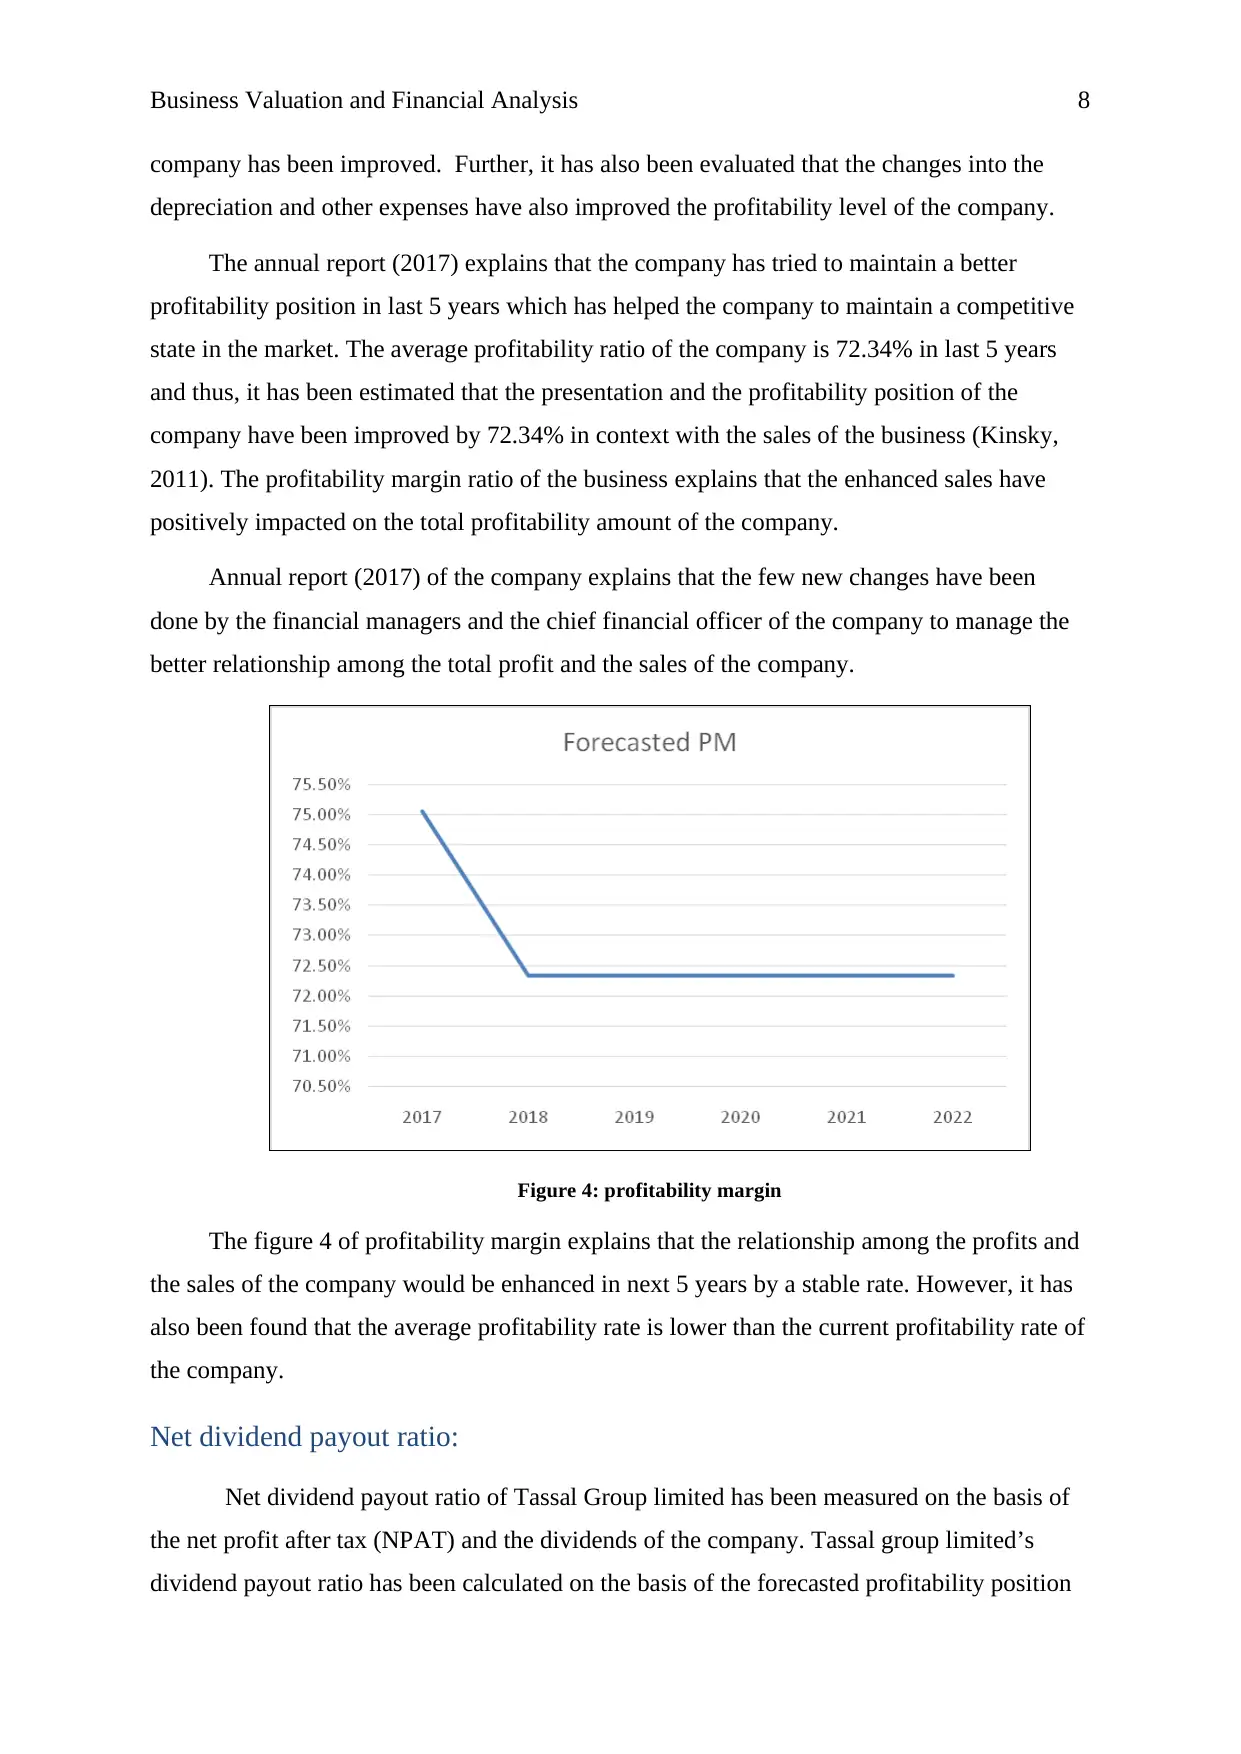
Figure 4: profitability margin
The figure 4 of profitability margin explains that the relationship among the profits and
the sales of the company would be enhanced in next 5 years by a stable rate. However, it has
also been found that the average profitability rate is lower than the current profitability rate of
the company.
Net dividend payout ratio:
Net dividend payout ratio of Tassal Group limited has been measured on the basis of
the net profit after tax (NPAT) and the dividends of the company. Tassal group limited’s
dividend payout ratio has been calculated on the basis of the forecasted profitability position
company has been improved. Further, it has also been evaluated that the changes into the
depreciation and other expenses have also improved the profitability level of the company.
The annual report (2017) explains that the company has tried to maintain a better
profitability position in last 5 years which has helped the company to maintain a competitive
state in the market. The average profitability ratio of the company is 72.34% in last 5 years
and thus, it has been estimated that the presentation and the profitability position of the
company have been improved by 72.34% in context with the sales of the business (Kinsky,
2011). The profitability margin ratio of the business explains that the enhanced sales have
positively impacted on the total profitability amount of the company.
Annual report (2017) of the company explains that the few new changes have been
done by the financial managers and the chief financial officer of the company to manage the
better relationship among the total profit and the sales of the company.
Figure 4: profitability margin
The figure 4 of profitability margin explains that the relationship among the profits and
the sales of the company would be enhanced in next 5 years by a stable rate. However, it has
also been found that the average profitability rate is lower than the current profitability rate of
the company.
Net dividend payout ratio:
Net dividend payout ratio of Tassal Group limited has been measured on the basis of
the net profit after tax (NPAT) and the dividends of the company. Tassal group limited’s
dividend payout ratio has been calculated on the basis of the forecasted profitability position
Business Valuation and Financial Analysis 9
and the forecasted dividend amount of the company (Krantz, 2016). The evaluation on net
dividend payout ratio of the company explains that the net dividend payout ratio of the
company has been quite better in last 5 years. The net dividend payout ratio of the company
was quite competitive. The last 5 years net dividend payout ratio of the company is measured
and it has been found that in future, the dividend amount would be enhanced in next 5 years.
The net dividend payout ratio of the company has been calculated through measuring
the forecasted profitability margin and the dividend amount of the company. The stable
position, better performance in the industry, changes into the sales price, better stick
performance, higher profits, financial policies etc have impacted on the net dividend payout
ratio of the company. The market and stock position has helped the company to improve the
dividend position (Moles, Parrino and Kidwekk, 2011).
The annual report (2017) explains that the company has tried to maintain a better
investment position in last 5 years which has helped the company to maintain a competitive
state in the stock market. The average dividend ratio of the company is 38.9% in last 5 years.
The dividend amount is mostly given by the companies to attract the investors more towards
the investment into the company. It is one of the most crucial motivational factors for the
investors of the company.
Annual report (2017) of the business explains that the company is focusing on the
relevant dividend policies which explain that an organization should offer a huge amount as
dividend to shareholders for enhancing the stock price and the capitalization of the company.
Cost of debt:
Cost of debt briefs about the total cost that is incurred in an association against the total
debt amount of the business. It explains that how much amount would have to pay to the
company to the debt holders of the company against their investment amount. Basically, a
question rises in the mine of a person that why an organization rise the funds from the debt
and not from the equity to save the cost of the company. Well, equity capital also demands
for the cost (Kisnky, 2011).
The cost of debt is the interest amount which is given by the company as fixed interest
% to the debt holders of the company. The cost of debt of an organization is calculated after
deducting the tax expenses of the company. The cost of debt of the company explains about
higher increment in the debt expenses of the company. The changes would take place due t
⊘ This is a preview!⊘
Do you want full access?
Subscribe today to unlock all pages.
Trusted by 1+ million students worldwide
Business Valuation and Financial Analysis 10
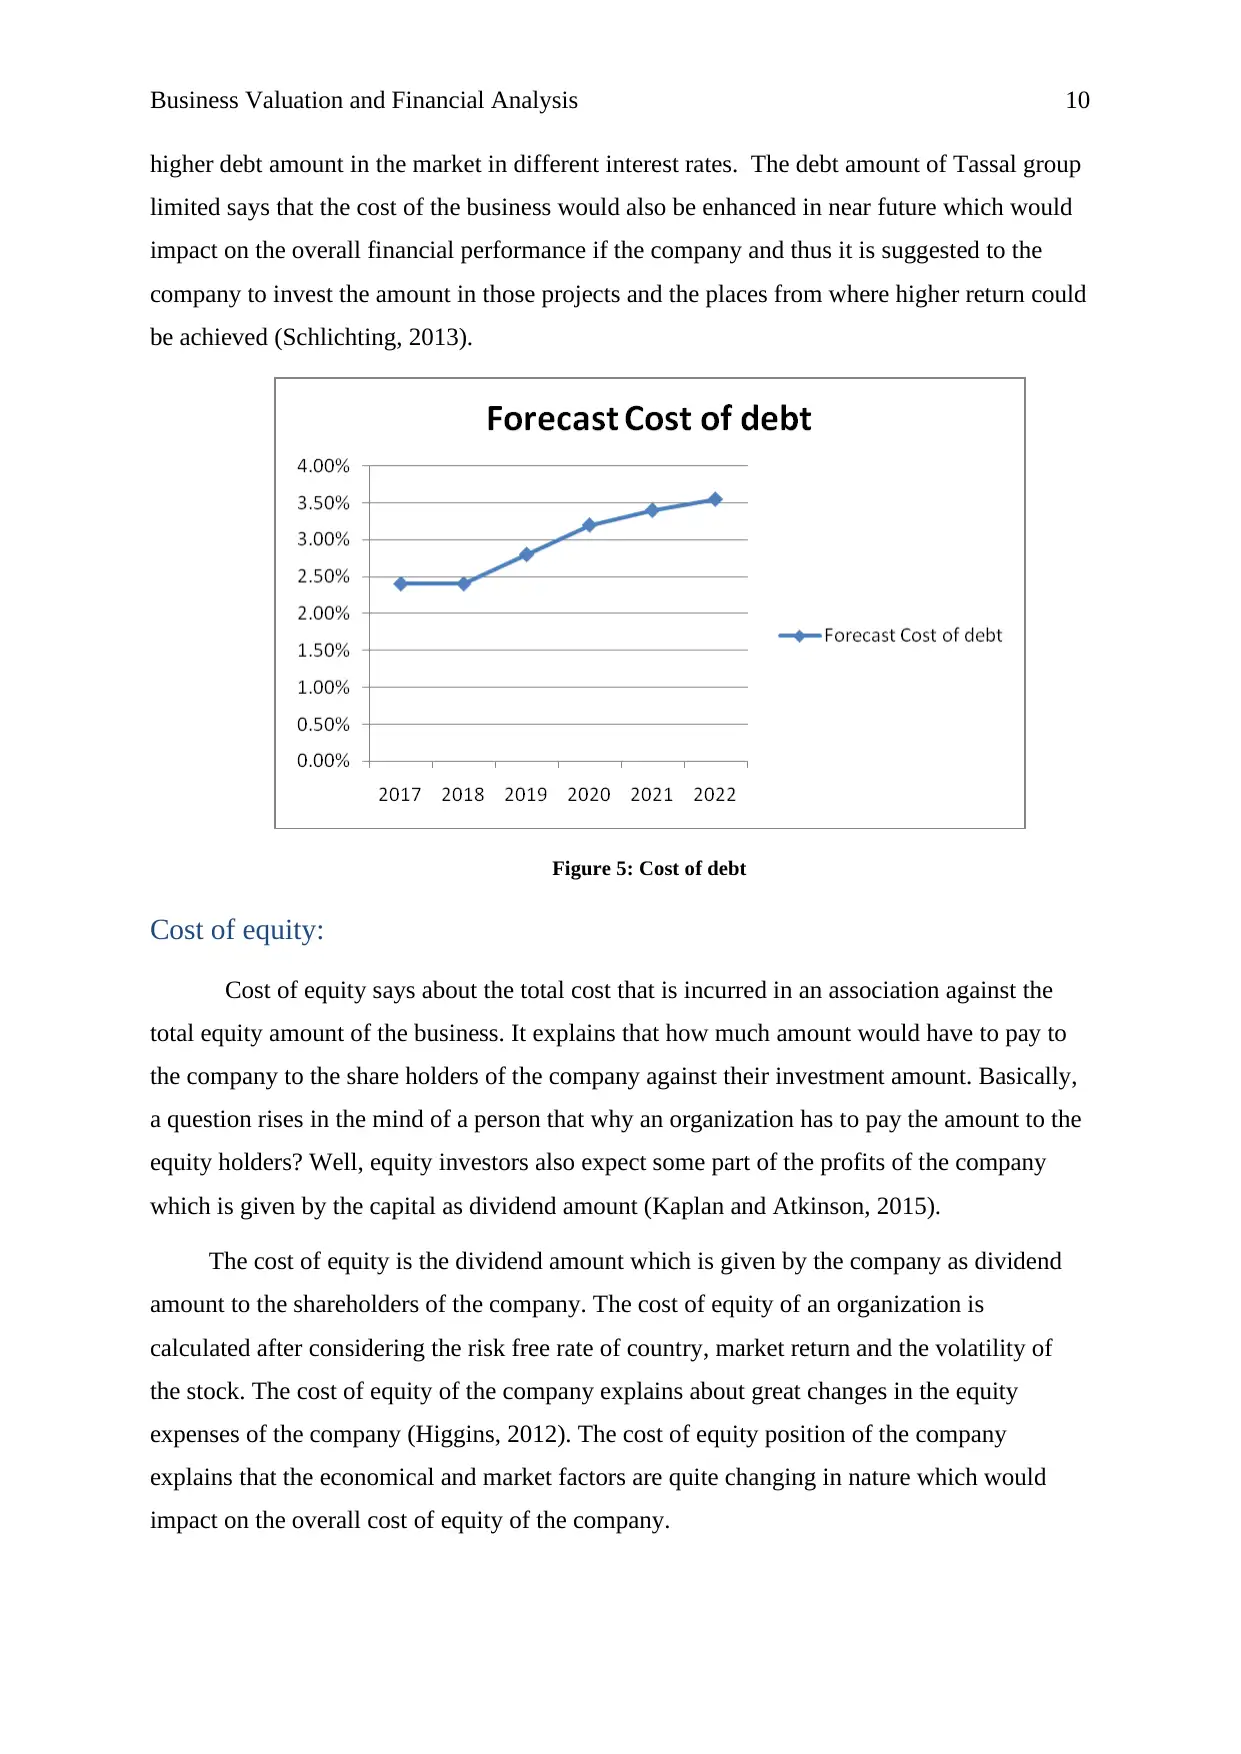
higher debt amount in the market in different interest rates. The debt amount of Tassal group
limited says that the cost of the business would also be enhanced in near future which would
impact on the overall financial performance if the company and thus it is suggested to the
company to invest the amount in those projects and the places from where higher return could
be achieved (Schlichting, 2013).
Figure 5: Cost of debt
Cost of equity:
Cost of equity says about the total cost that is incurred in an association against the
total equity amount of the business. It explains that how much amount would have to pay to
the company to the share holders of the company against their investment amount. Basically,
a question rises in the mind of a person that why an organization has to pay the amount to the
equity holders? Well, equity investors also expect some part of the profits of the company
which is given by the capital as dividend amount (Kaplan and Atkinson, 2015).
The cost of equity is the dividend amount which is given by the company as dividend
amount to the shareholders of the company. The cost of equity of an organization is
calculated after considering the risk free rate of country, market return and the volatility of
the stock. The cost of equity of the company explains about great changes in the equity
expenses of the company (Higgins, 2012). The cost of equity position of the company
explains that the economical and market factors are quite changing in nature which would
impact on the overall cost of equity of the company.
Paraphrase This Document
Need a fresh take? Get an instant paraphrase of this document with our AI Paraphraser
Business Valuation and Financial Analysis 11
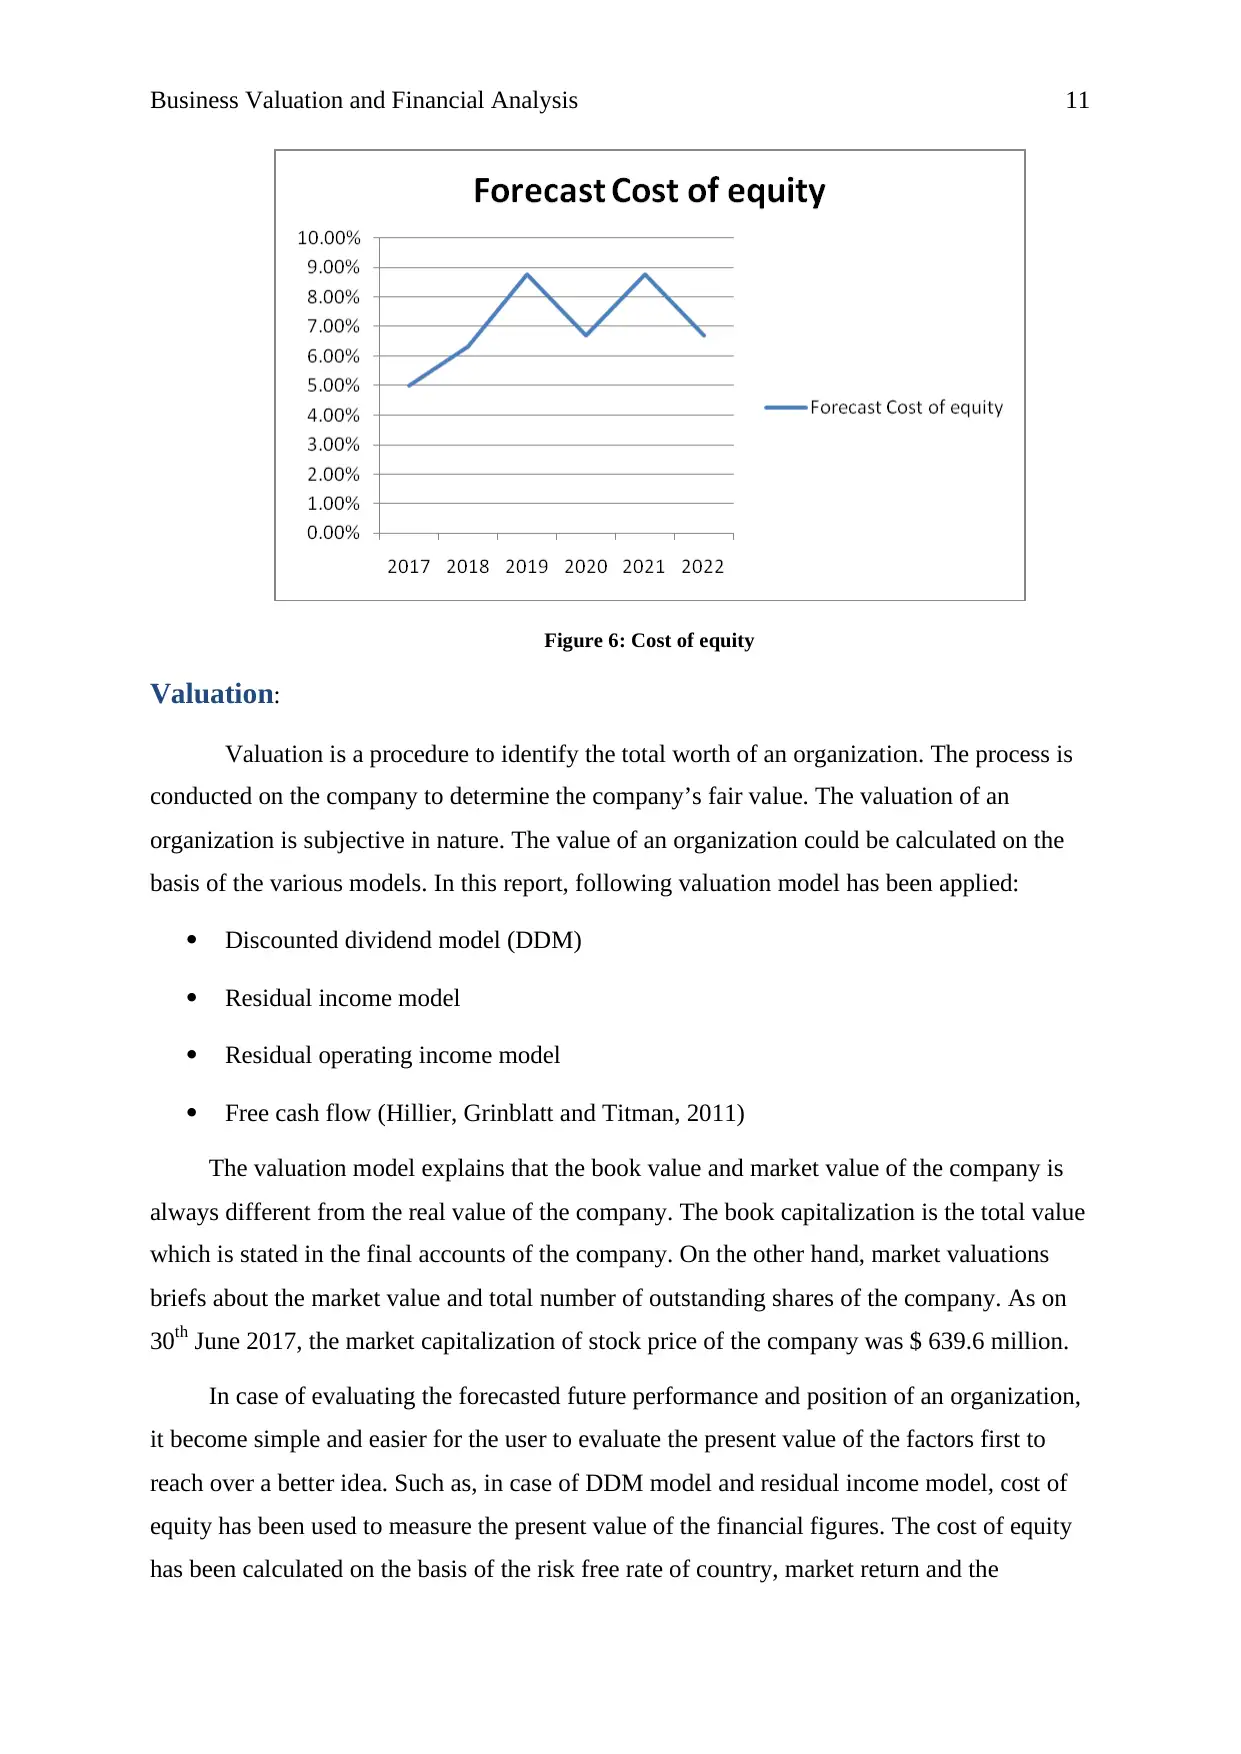
Figure 6: Cost of equity
Valuation:
Valuation is a procedure to identify the total worth of an organization. The process is
conducted on the company to determine the company’s fair value. The valuation of an
organization is subjective in nature. The value of an organization could be calculated on the
basis of the various models. In this report, following valuation model has been applied:
Discounted dividend model (DDM)
Residual income model
Residual operating income model
Free cash flow (Hillier, Grinblatt and Titman, 2011)
The valuation model explains that the book value and market value of the company is
always different from the real value of the company. The book capitalization is the total value
which is stated in the final accounts of the company. On the other hand, market valuations
briefs about the market value and total number of outstanding shares of the company. As on
30th June 2017, the market capitalization of stock price of the company was $ 639.6 million.
In case of evaluating the forecasted future performance and position of an organization,
it become simple and easier for the user to evaluate the present value of the factors first to
reach over a better idea. Such as, in case of DDM model and residual income model, cost of
equity has been used to measure the present value of the financial figures. The cost of equity
has been calculated on the basis of the risk free rate of country, market return and the
Business Valuation and Financial Analysis 12
volatility of the stock. On the basis of the evaluation, it has been recognized that the risk free
rate of the country is 2.33% in 5 years and 2.70% in 10 years. The market return of the
company has been assumed on the basis of the economical position and it has been found that
the market return would be around 7 to 8% (Higgins, 2012). The beta (volatility in the stock
price) of the company has been measured on the basis of the various analyst reports and it has
been found that the cost of equity of the company is 4.99%, 6.32% and 8.78% (The wall
street journal, 2018). The average cost of equity of the company is 6.70%.
For residual income model and free cash flow model, WACC (weighted average cost
of capital) has been calculated. This model focuses on the equity and debt amount of the
company to calculate the overall cost of capital of the company. The book value of the
company explains that the debt and equity weight of the company is 13.64% and 86.36%.
And the cost of debt and cost of equity of the company is 4.99% and 8.78% (Bloomberg,
2018). The WACC of the company is 8.34%. The WACC of the company is quite higher due
to cost of equity of the company.
Dividend discount model:
Dividend discount model is one of valuation model of the business. The present value
of dividend amount is calculated to measure the overall performance of the company. The
NPV amount in dividend discount model is used to measure the terminal value of the
company. In case of Tassal group, dividend discount model has been applied on the company
to measure the overall performance of the company. The dividend amount has been forecast
on the basis of the profit and the dividend payout ratio of the company. The average dividend
growth rate of the company is quite lower. However, the performance of the company is quite
better (Higgins, 2012).
The present value of the dividends of the company has been measured on the basis of
the cost of equity of the company. The present value factor has been multiplied with the
dividend amount of the company to measure the performance of the company. The terminal
value has been calculated further to measure the overall value of the company (Jiashu, 2009).
the time value discounted factor of the company is $ 4401.89. the time value of dividend
amount is $ 984.55.
The total value of the firm is $ 5386.44. The annual report (2017) explains that the total
outstanding shares of the company are 156 millions. So, it has been found that the share price
⊘ This is a preview!⊘
Do you want full access?
Subscribe today to unlock all pages.
Trusted by 1+ million students worldwide
1 out of 27
Related Documents


Your All-in-One AI-Powered Toolkit for Academic Success.
+13062052269
info@desklib.com
Available 24*7 on WhatsApp / Email
![[object Object]](/_next/static/media/star-bottom.7253800d.svg)
Unlock your academic potential
Copyright © 2020–2026 A2Z Services. All Rights Reserved. Developed and managed by ZUCOL.