Report on Statistical Analysis of Tax Lodgment Methods in Australia
VerifiedAdded on 2020/05/16
|15
|2365
|38
Report
AI Summary
This report presents a statistical analysis of tax lodgment methods among Australian students, utilizing two datasets—a secondary dataset with five variables and a primary dataset with two variables. The analysis reveals that a significant proportion of individuals prefer using tax agents for lodging returns, although this preference varies with age, as older individuals tend to favor tax agents more than younger individuals. Chi-Square test results confirm a significant association between age group and lodgment method. Furthermore, the average total income is higher for those using tax agents compared to self-preparers, and a positive linear relationship exists between total income amount and deduction amount. Desklib provides access to similar reports and solved assignments for students.

Statistics and data analysis
Student Name:
University
22nd January 2018
Student Name:
University
22nd January 2018
Paraphrase This Document
Need a fresh take? Get an instant paraphrase of this document with our AI Paraphraser
Table of Contents
Section 1: Introduction....................................................................................................................2
Brief introduction.........................................................................................................................2
Dataset 1.......................................................................................................................................2
Dataset 2.......................................................................................................................................3
Section 2: Lodgment Method – Dataset 1.......................................................................................3
95% confidence intervals.............................................................................................................4
±2.67...........................................................................................................................................4
Section 3: Lodgment Method – Dataset 2.......................................................................................5
Graphical Display........................................................................................................................5
95% confidence interval...............................................................................................................6
±12.93.........................................................................................................................................6
Section 4: Lodgment Method and Age Group.................................................................................7
Test of association........................................................................................................................7
Section 5: Lodgment Method and Total Income Amount...............................................................9
Section 6: Total Income Amount and Deduction Amount............................................................10
Section 7: Conclusion....................................................................................................................11
List of tables
Table 1: List of five cases of the dataset..........................................................................................4
Table 2: Comparison of lodgment method versus age group..........................................................9
Table 3: Chi-Square Tests.............................................................................................................10
List of figures
Figure 1: Pie chart on lodgment method..........................................................................................5
Figure 2: Pie chart on whether participants would want to use tax agents......................................6
Figure 3: Bar chart of gender versus engaging tax agents...............................................................7
Figure 4: Comparative bar chart of tax lodgment method versus age group...................................8
Figure 5: Average total income amount based on lodgment method............................................11
Figure 6: A scatter plot of total income amount versus deduction amount...................................12
⊘ This is a preview!⊘
Do you want full access?
Subscribe today to unlock all pages.
Trusted by 1+ million students worldwide
Section 1: Introduction
Brief introduction
Australia is one of the leading countries with international students-it an international academic
destination for many foreign students (Burdett & Crossman, 2012). All persons residing in
Australia are required to lodge and fill tax returns (Harmer, et al., 2009). There are several tax
agent who help people to lodge the tax returns (Warren, 2014). Most registered tax agents have a
special lodgment program and can lodge returns for their clients after the usual 31 October
deadline (Warren, 2014). This study sought to investigate whether the international students
residing in Australia would want to use tax agents to lodge their tax returns. The study also
sought to investigate the relationship that exists between total income and the type of lodgment
method used by the individuals. We also investigated the relationship between total income
amount and the deduction amount. Two types of datasets were used (dataset 1 and dataset 2), the
description of the datasets is given below.
Dataset 1
This dataset is a secondary data that was collected sometime back and stored for future use.
Secondary data refers to the data that was collected by someone else other the user of it (Corti &
Bishop, 2005). These type of data is normally found in population censuses, database websites,
government institutions among others (Kelly, 2005). The dataset has a total of five variables.
Two of the variables (Gender and Lodgment method) are nominal while the total income amount
and total deducted amount are ratio (numerical) variables. Age range is an ordinal variable.
Table 1 gives the first five cases of the dataset.
Paraphrase This Document
Need a fresh take? Get an instant paraphrase of this document with our AI Paraphraser
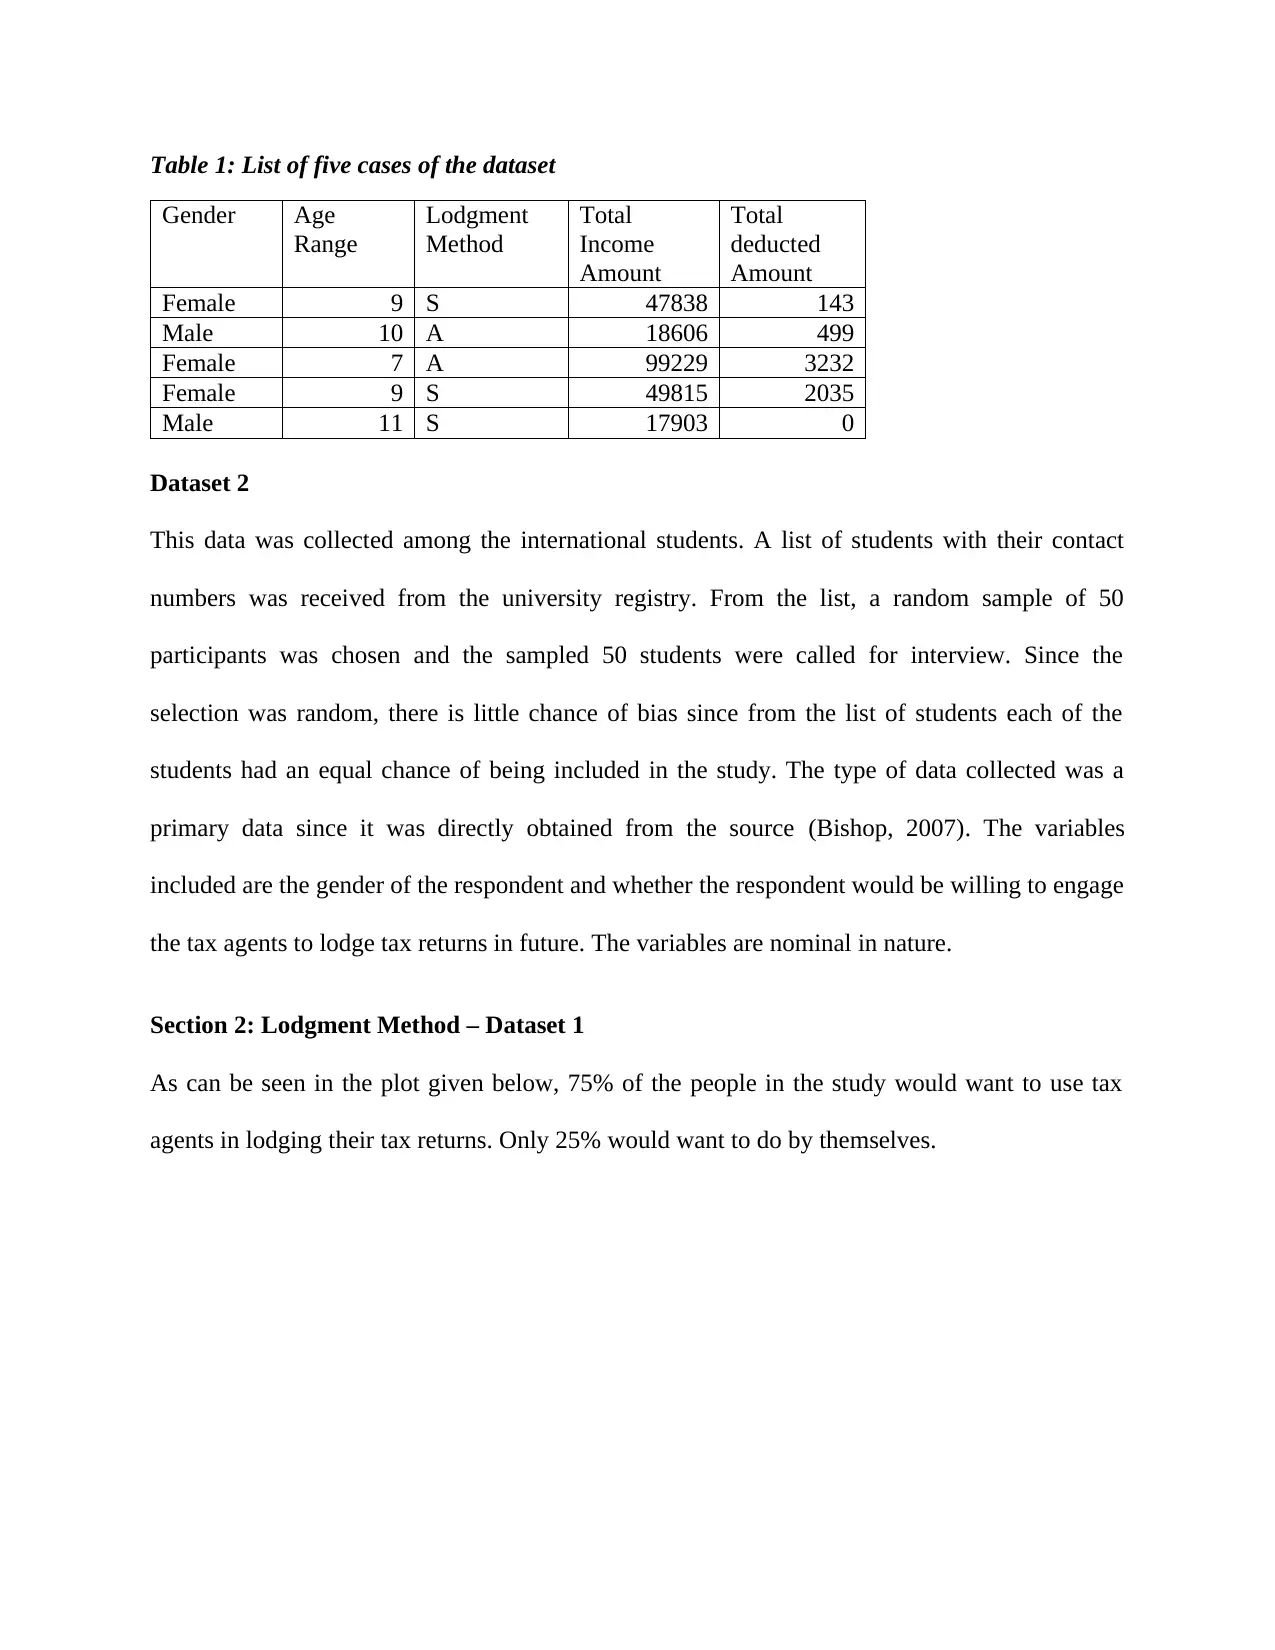
Table 1: List of five cases of the dataset
Gender Age
Range
Lodgment
Method
Total
Income
Amount
Total
deducted
Amount
Female 9 S 47838 143
Male 10 A 18606 499
Female 7 A 99229 3232
Female 9 S 49815 2035
Male 11 S 17903 0
Dataset 2
This data was collected among the international students. A list of students with their contact
numbers was received from the university registry. From the list, a random sample of 50
participants was chosen and the sampled 50 students were called for interview. Since the
selection was random, there is little chance of bias since from the list of students each of the
students had an equal chance of being included in the study. The type of data collected was a
primary data since it was directly obtained from the source (Bishop, 2007). The variables
included are the gender of the respondent and whether the respondent would be willing to engage
the tax agents to lodge tax returns in future. The variables are nominal in nature.
Section 2: Lodgment Method – Dataset 1
As can be seen in the plot given below, 75% of the people in the study would want to use tax
agents in lodging their tax returns. Only 25% would want to do by themselves.
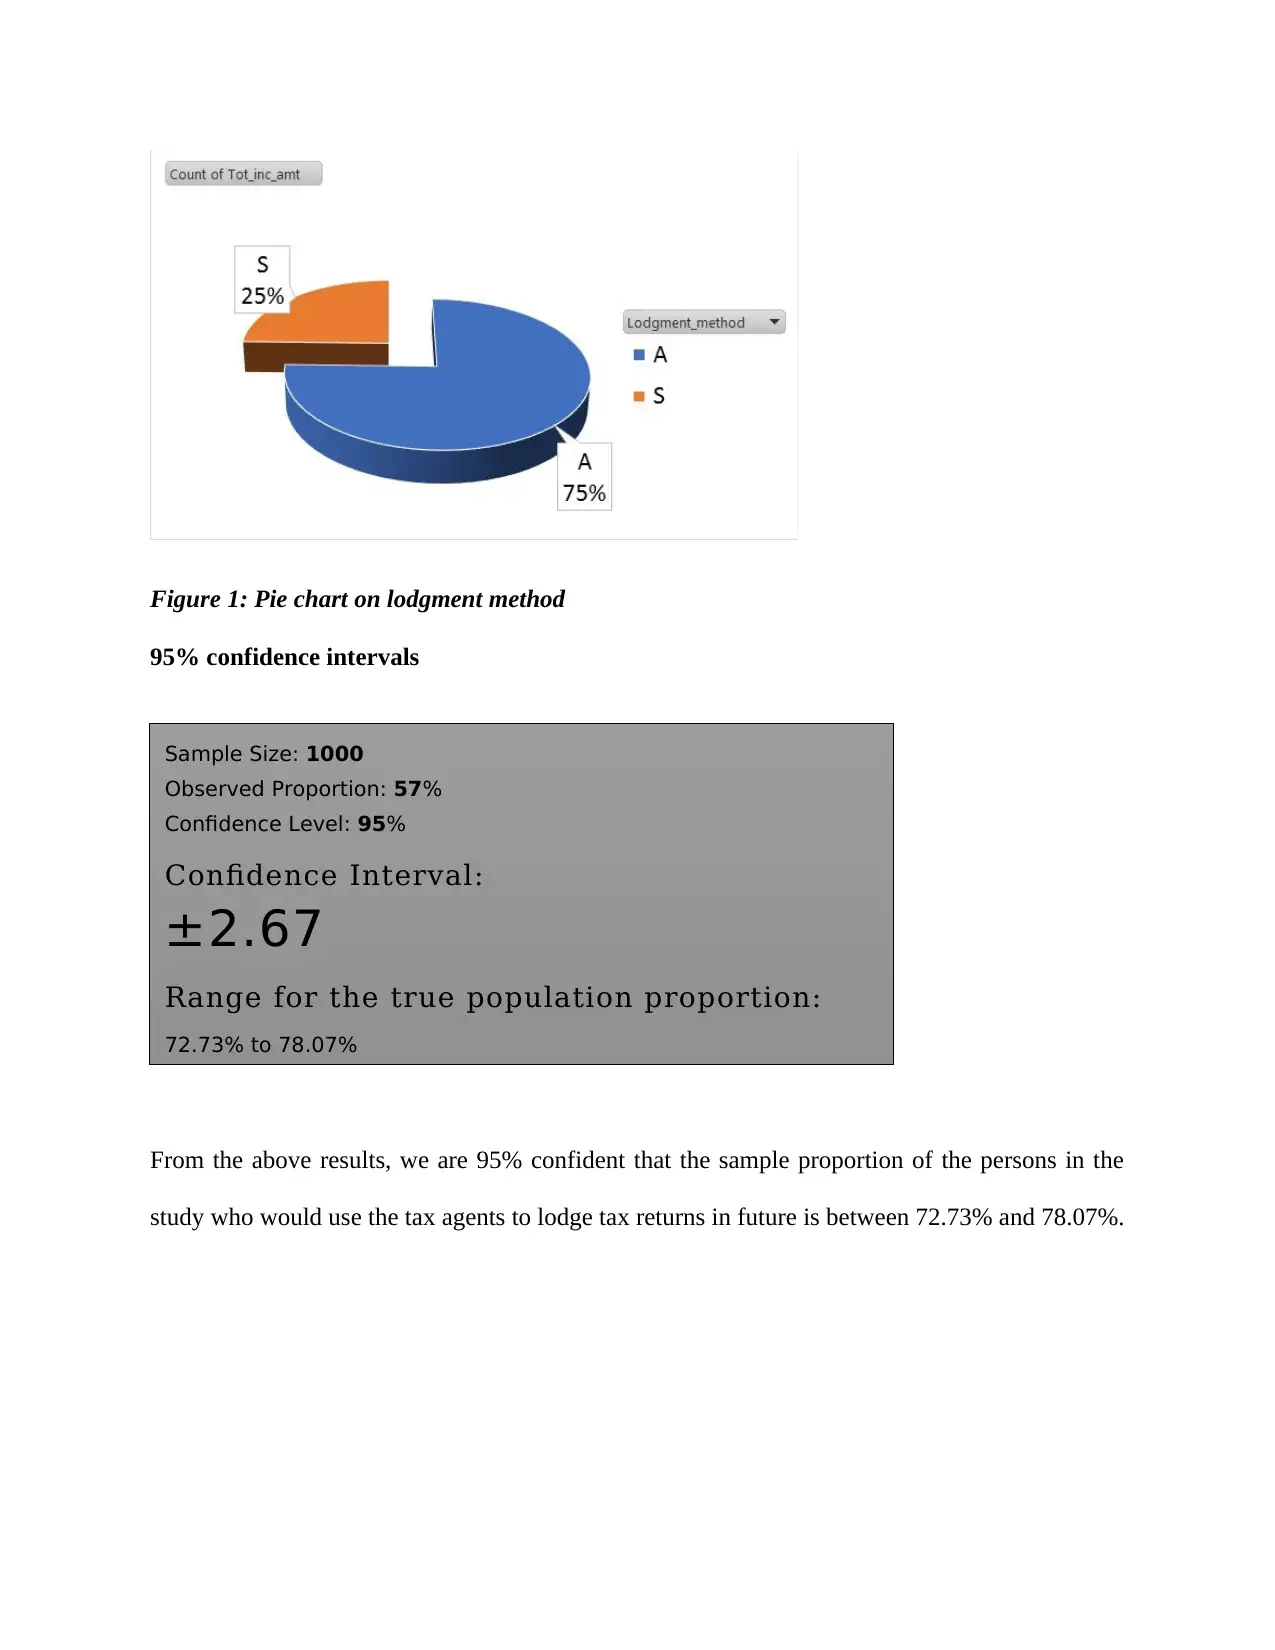
Figure 1: Pie chart on lodgment method
95% confidence intervals
From the above results, we are 95% confident that the sample proportion of the persons in the
study who would use the tax agents to lodge tax returns in future is between 72.73% and 78.07%.
Sample Size: 1000
Observed Proportion: 57%
Confidence Level: 95%
Confidence Interval:
±2.67
Range for the true population proportion:
72.73% to 78.07%
⊘ This is a preview!⊘
Do you want full access?
Subscribe today to unlock all pages.
Trusted by 1+ million students worldwide
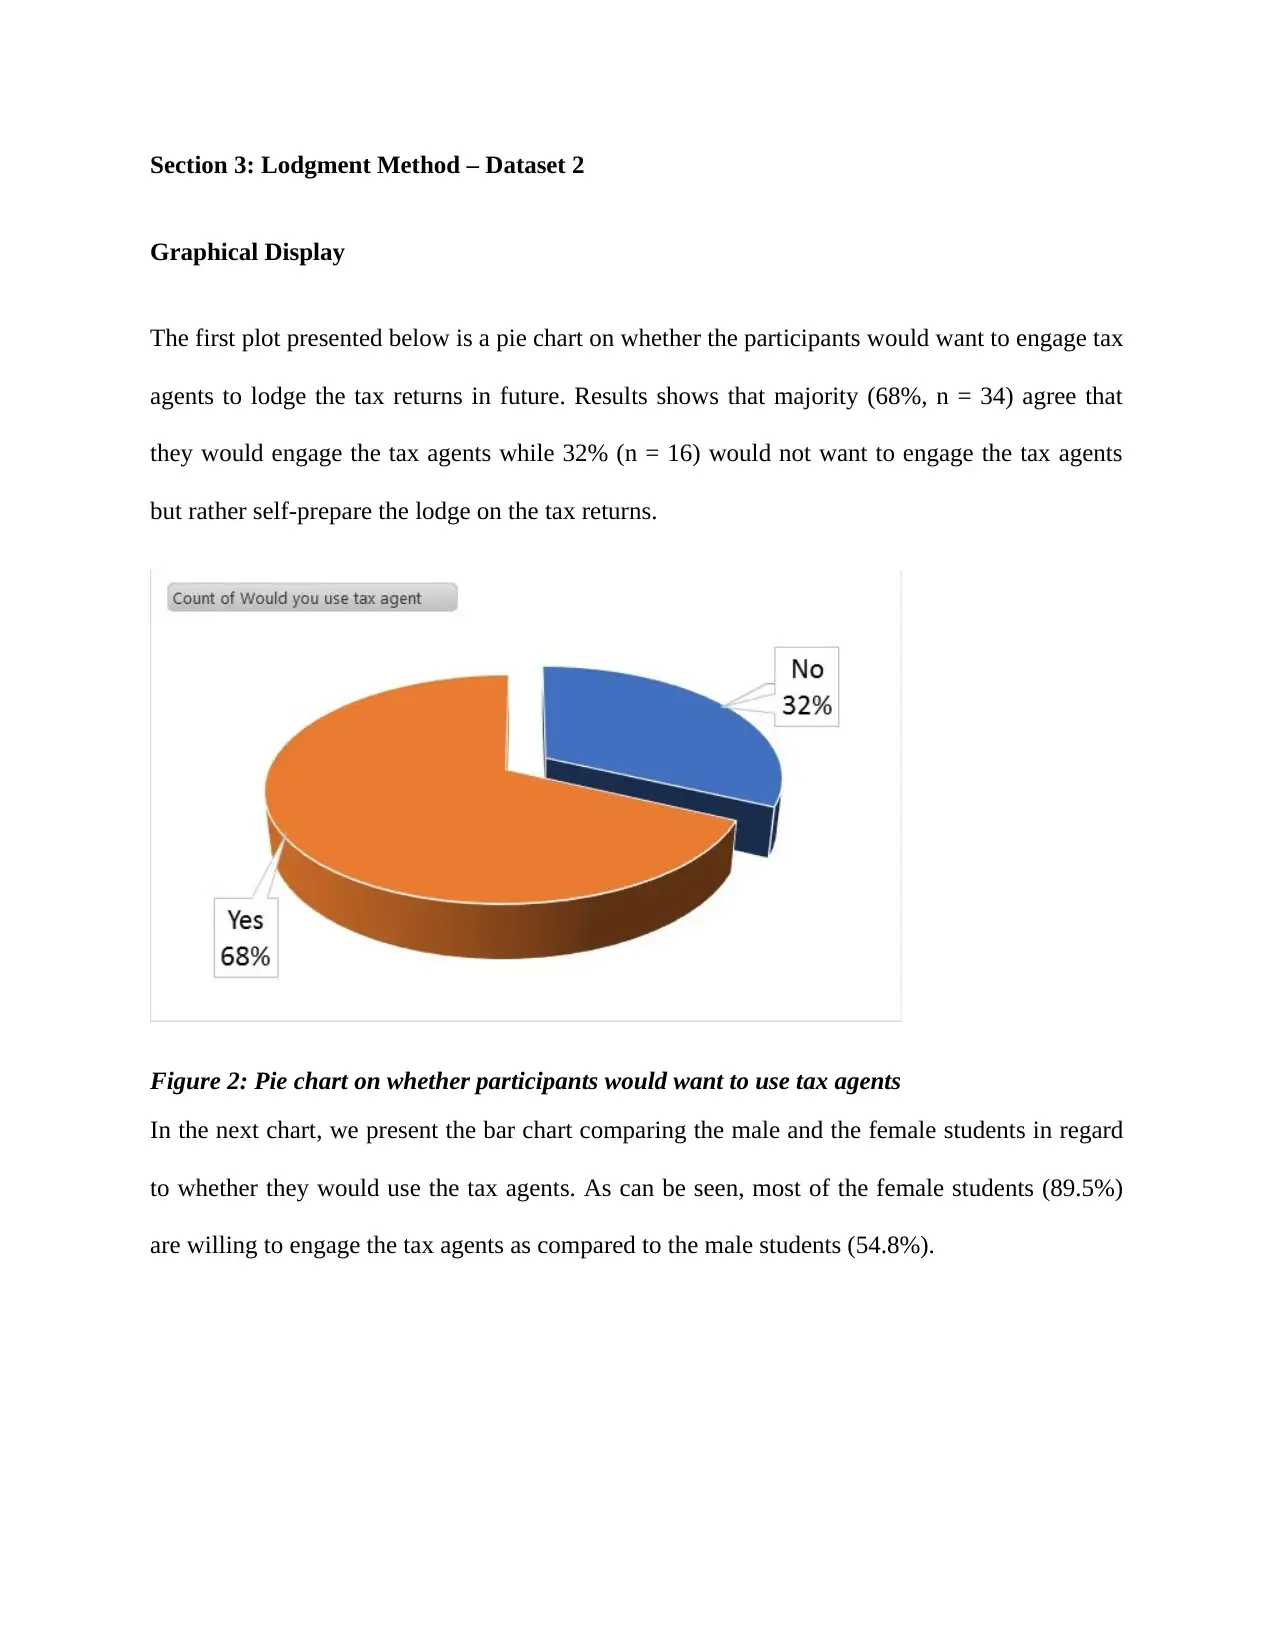
Section 3: Lodgment Method – Dataset 2
Graphical Display
The first plot presented below is a pie chart on whether the participants would want to engage tax
agents to lodge the tax returns in future. Results shows that majority (68%, n = 34) agree that
they would engage the tax agents while 32% (n = 16) would not want to engage the tax agents
but rather self-prepare the lodge on the tax returns.
Figure 2: Pie chart on whether participants would want to use tax agents
In the next chart, we present the bar chart comparing the male and the female students in regard
to whether they would use the tax agents. As can be seen, most of the female students (89.5%)
are willing to engage the tax agents as compared to the male students (54.8%).
Paraphrase This Document
Need a fresh take? Get an instant paraphrase of this document with our AI Paraphraser
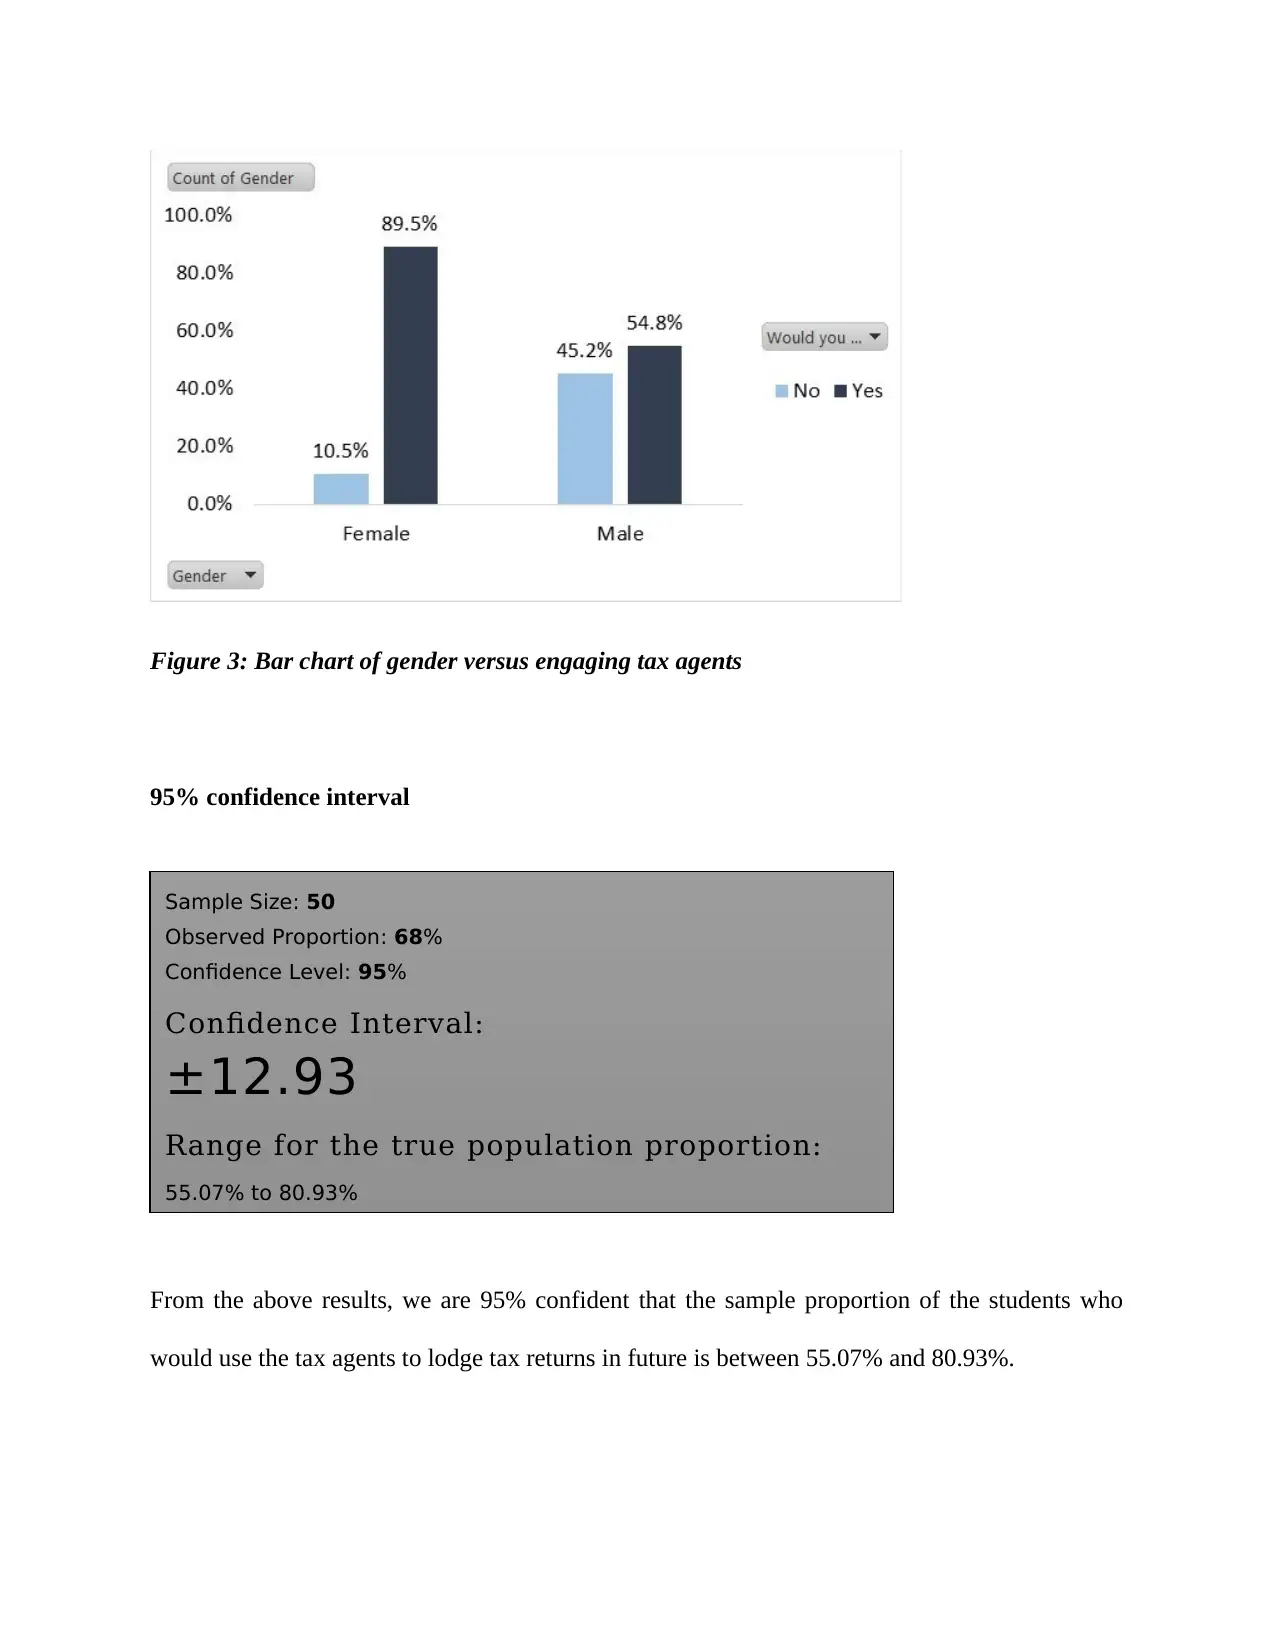
Figure 3: Bar chart of gender versus engaging tax agents
95% confidence interval
From the above results, we are 95% confident that the sample proportion of the students who
would use the tax agents to lodge tax returns in future is between 55.07% and 80.93%.
Sample Size: 50
Observed Proportion: 68%
Confidence Level: 95%
Confidence Interval:
±12.93
Range for the true population proportion:
55.07% to 80.93%
When compared to the dataset 1, we observe that a slightly lower proportion of people would
want to lodge tax returns via tax agents however, the confidence interval clearly shows that there
is no significant difference in terms of those who would want to lodge tax returns via tax agents
in dataset 1and dataset 2.
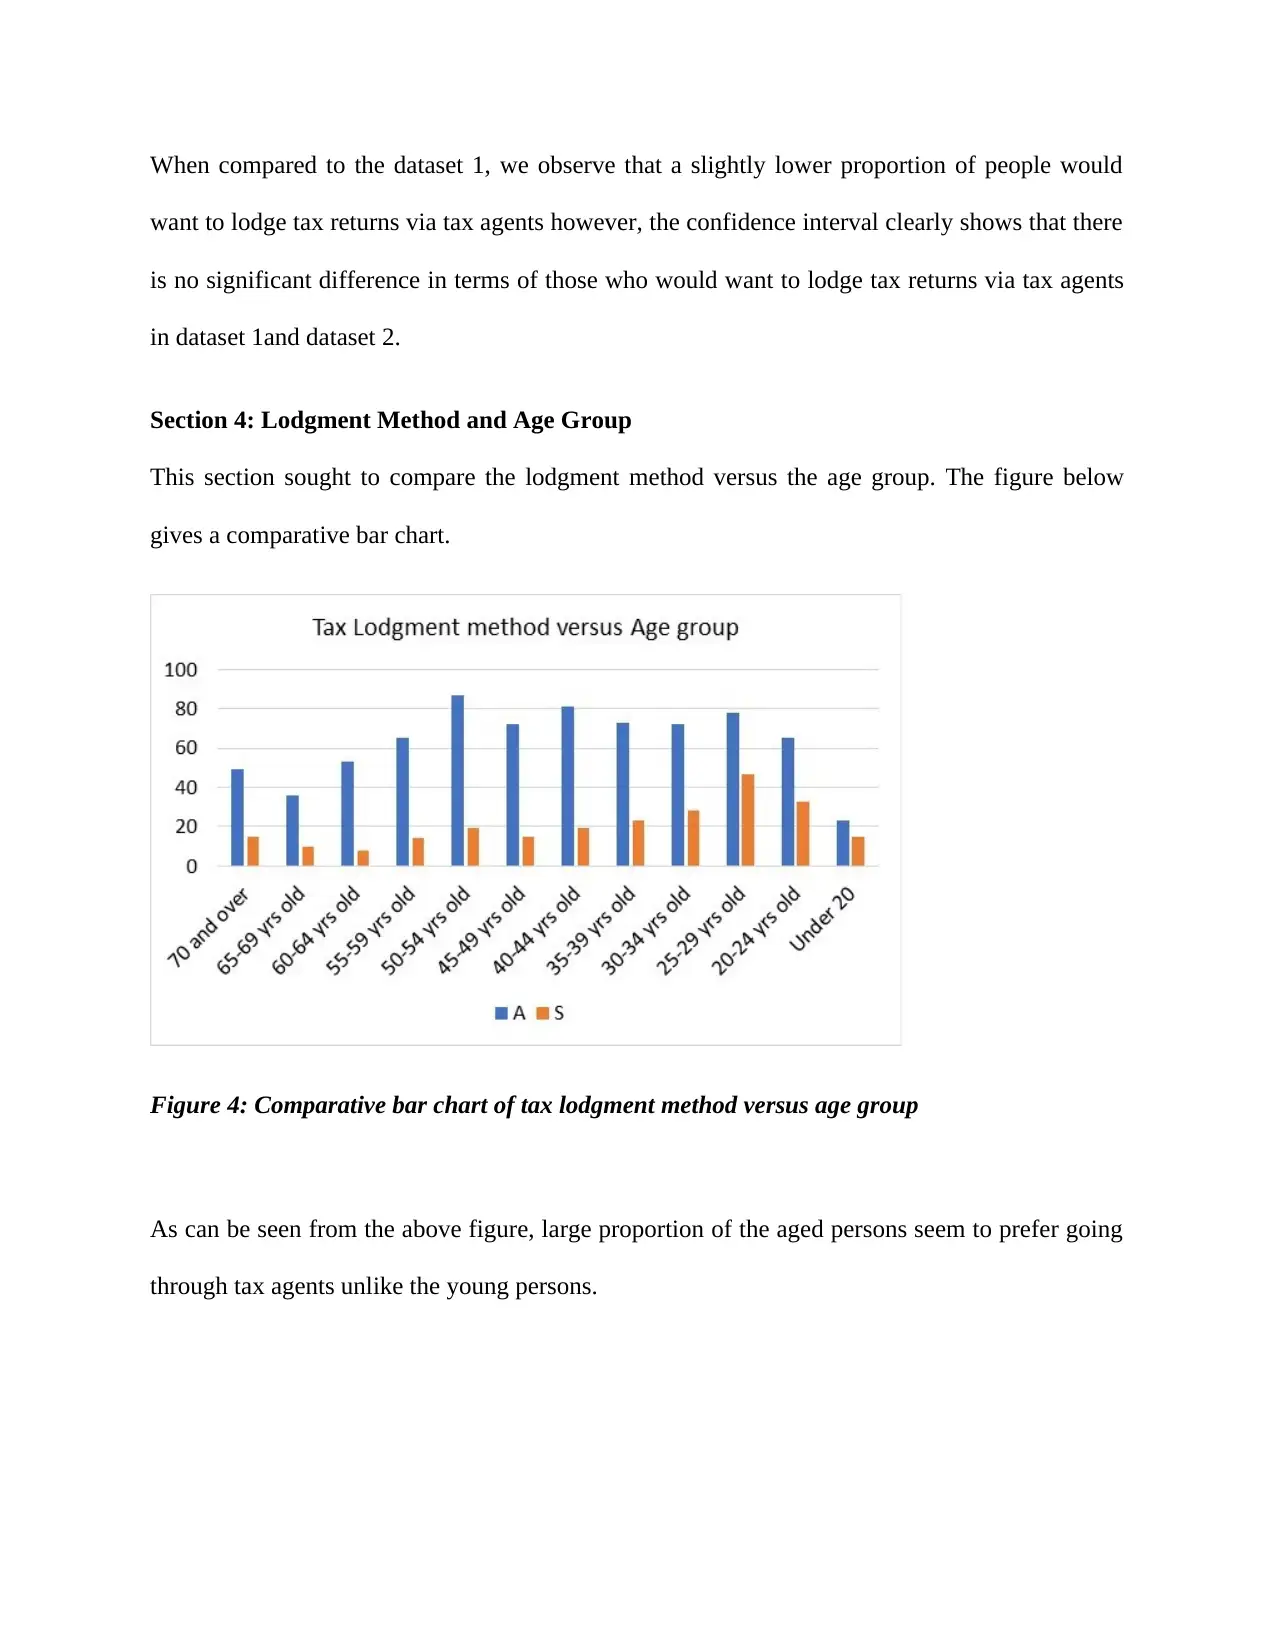
Section 4: Lodgment Method and Age Group
This section sought to compare the lodgment method versus the age group. The figure below
gives a comparative bar chart.
Figure 4: Comparative bar chart of tax lodgment method versus age group
As can be seen from the above figure, large proportion of the aged persons seem to prefer going
through tax agents unlike the young persons.
want to lodge tax returns via tax agents however, the confidence interval clearly shows that there
is no significant difference in terms of those who would want to lodge tax returns via tax agents
in dataset 1and dataset 2.
Section 4: Lodgment Method and Age Group
This section sought to compare the lodgment method versus the age group. The figure below
gives a comparative bar chart.
Figure 4: Comparative bar chart of tax lodgment method versus age group
As can be seen from the above figure, large proportion of the aged persons seem to prefer going
through tax agents unlike the young persons.
⊘ This is a preview!⊘
Do you want full access?
Subscribe today to unlock all pages.
Trusted by 1+ million students worldwide
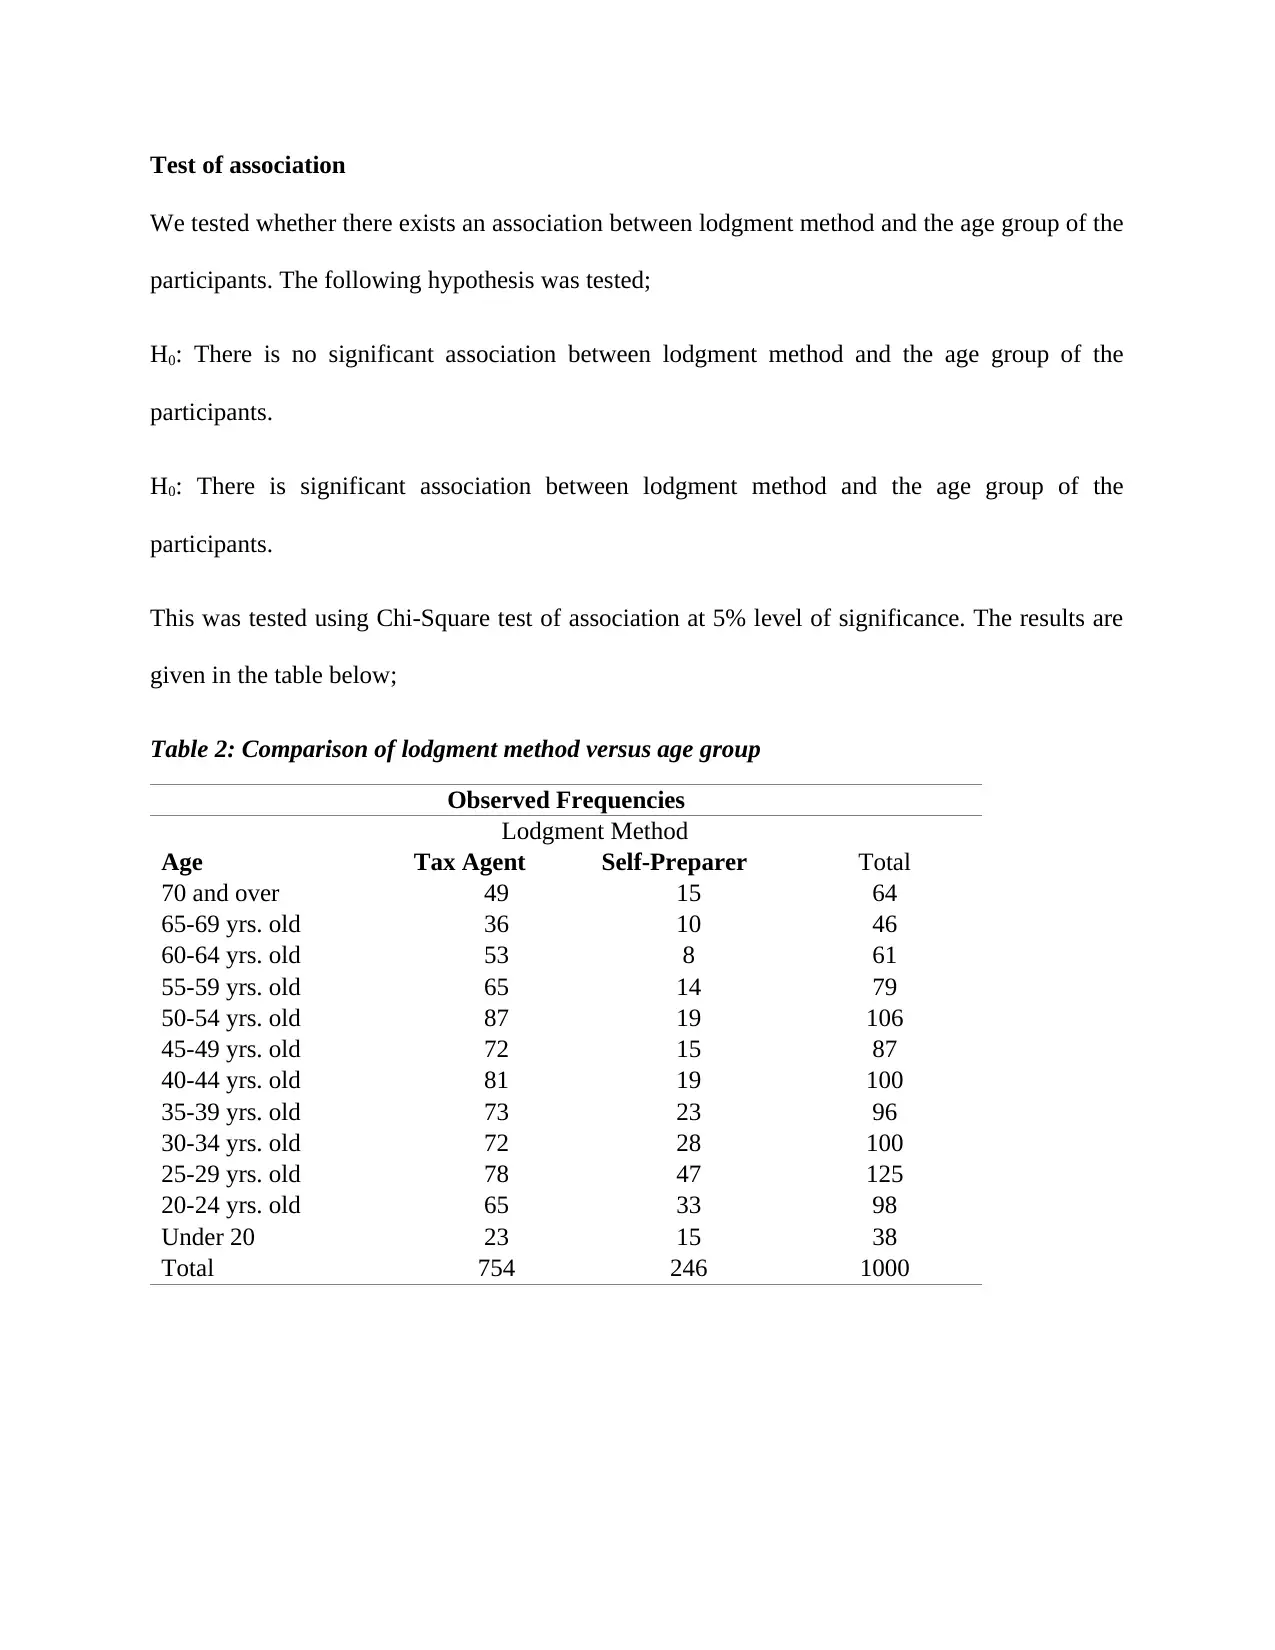
Test of association
We tested whether there exists an association between lodgment method and the age group of the
participants. The following hypothesis was tested;
H0: There is no significant association between lodgment method and the age group of the
participants.
H0: There is significant association between lodgment method and the age group of the
participants.
This was tested using Chi-Square test of association at 5% level of significance. The results are
given in the table below;
Table 2: Comparison of lodgment method versus age group
Observed Frequencies
Lodgment Method
Age Tax Agent Self-Preparer Total
70 and over 49 15 64
65-69 yrs. old 36 10 46
60-64 yrs. old 53 8 61
55-59 yrs. old 65 14 79
50-54 yrs. old 87 19 106
45-49 yrs. old 72 15 87
40-44 yrs. old 81 19 100
35-39 yrs. old 73 23 96
30-34 yrs. old 72 28 100
25-29 yrs. old 78 47 125
20-24 yrs. old 65 33 98
Under 20 23 15 38
Total 754 246 1000
Paraphrase This Document
Need a fresh take? Get an instant paraphrase of this document with our AI Paraphraser
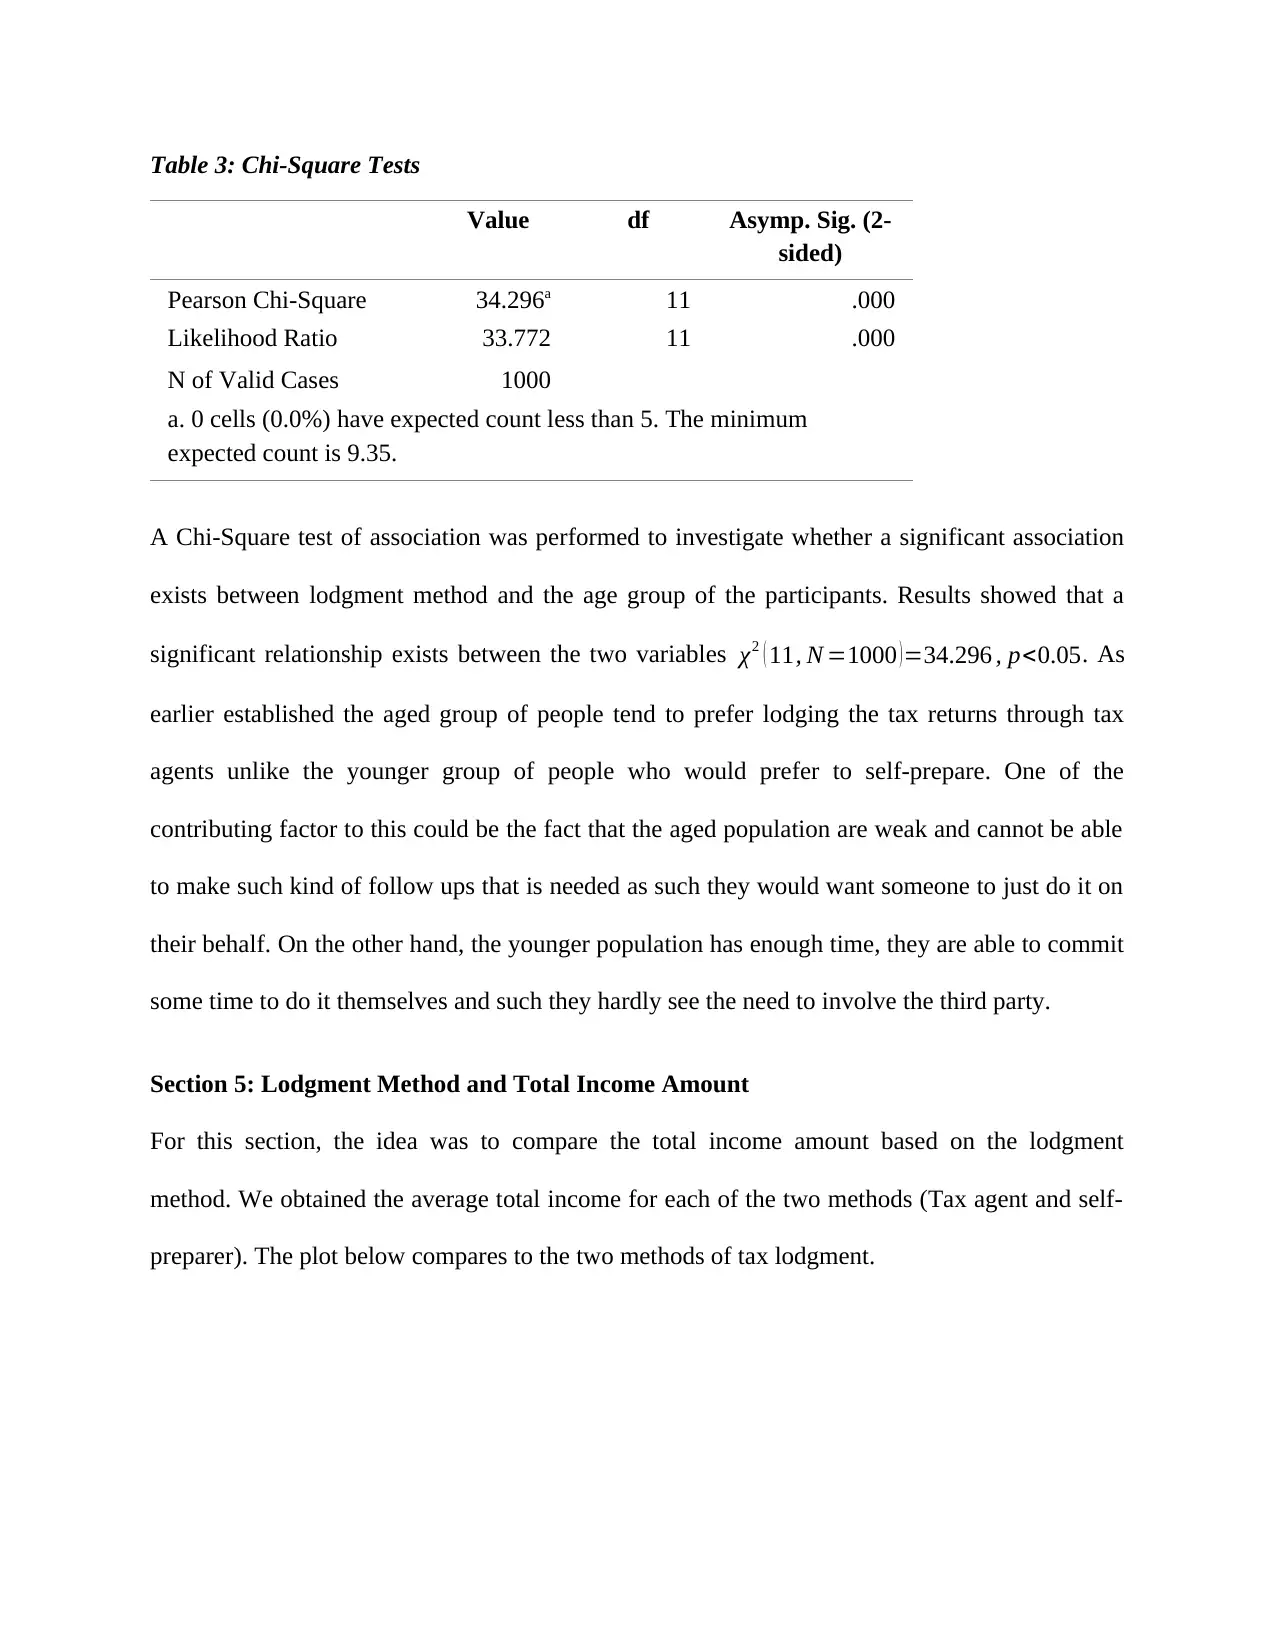
Table 3: Chi-Square Tests
Value df Asymp. Sig. (2-
sided)
Pearson Chi-Square 34.296a 11 .000
Likelihood Ratio 33.772 11 .000
N of Valid Cases 1000
a. 0 cells (0.0%) have expected count less than 5. The minimum
expected count is 9.35.
A Chi-Square test of association was performed to investigate whether a significant association
exists between lodgment method and the age group of the participants. Results showed that a
significant relationship exists between the two variables χ2 ( 11, N =1000 )=34.296 , p<0.05. As
earlier established the aged group of people tend to prefer lodging the tax returns through tax
agents unlike the younger group of people who would prefer to self-prepare. One of the
contributing factor to this could be the fact that the aged population are weak and cannot be able
to make such kind of follow ups that is needed as such they would want someone to just do it on
their behalf. On the other hand, the younger population has enough time, they are able to commit
some time to do it themselves and such they hardly see the need to involve the third party.
Section 5: Lodgment Method and Total Income Amount
For this section, the idea was to compare the total income amount based on the lodgment
method. We obtained the average total income for each of the two methods (Tax agent and self-
preparer). The plot below compares to the two methods of tax lodgment.
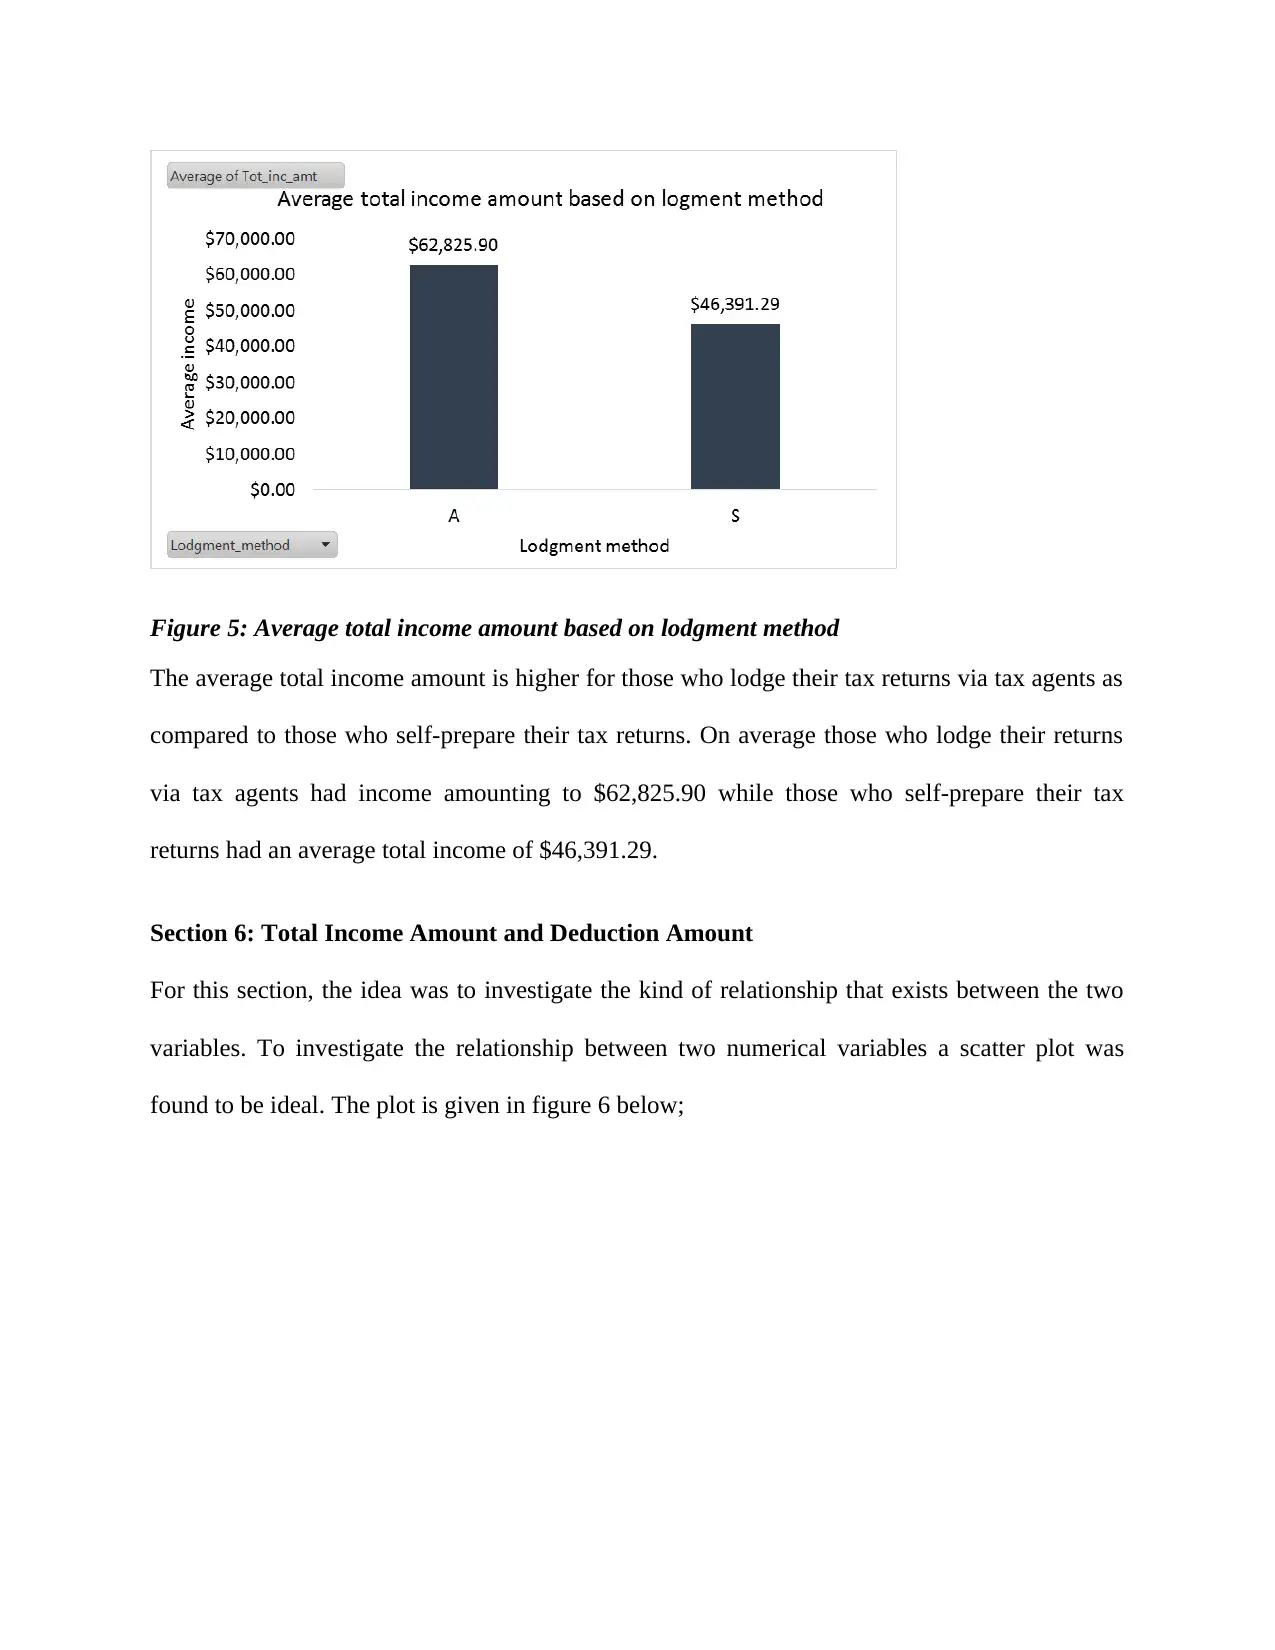
Figure 5: Average total income amount based on lodgment method
The average total income amount is higher for those who lodge their tax returns via tax agents as
compared to those who self-prepare their tax returns. On average those who lodge their returns
via tax agents had income amounting to $62,825.90 while those who self-prepare their tax
returns had an average total income of $46,391.29.
Section 6: Total Income Amount and Deduction Amount
For this section, the idea was to investigate the kind of relationship that exists between the two
variables. To investigate the relationship between two numerical variables a scatter plot was
found to be ideal. The plot is given in figure 6 below;
⊘ This is a preview!⊘
Do you want full access?
Subscribe today to unlock all pages.
Trusted by 1+ million students worldwide
1 out of 15
Related Documents


Your All-in-One AI-Powered Toolkit for Academic Success.
+13062052269
info@desklib.com
Available 24*7 on WhatsApp / Email
![[object Object]](/_next/static/media/star-bottom.7253800d.svg)
Unlock your academic potential
Copyright © 2020–2026 A2Z Services. All Rights Reserved. Developed and managed by ZUCOL.