University Data Analysis Report: Problem Analysis and Statistics
VerifiedAdded on 2020/05/28
|35
|10898
|40
Report
AI Summary
This report provides a comprehensive statistical analysis of tax return data, utilizing two datasets. Dataset 1, sourced from the Australian Taxation Office (ATO), explores the relationships between lodgement methods (agent vs. self-preparation), age groups, total income, and deduction amounts. The analysis includes frequency distributions, proportions, one-sample proportional Z-tests, correlation coefficients, and linear regression to uncover patterns and dependencies. Dataset 2, gathered through a survey, focuses on international students' preferences for lodgement methods. Comparative analyses between the two datasets are conducted using two-sample Z-tests to assess the equality of proportions. The report reveals insights into the factors influencing tax return lodgement choices and the relationships between various financial and demographic variables. The findings are presented with statistical summaries, confidence intervals, and visualizations, offering a detailed understanding of the data and its implications.

Running head: PROBLEM ANALYSIS AND STATISTICS
Problem Analysis and Statistics
Name of the Student:
Name of the University:
Author’s note:
Problem Analysis and Statistics
Name of the Student:
Name of the University:
Author’s note:
Paraphrase This Document
Need a fresh take? Get an instant paraphrase of this document with our AI Paraphraser
1PROBLEM ANALYSIS AND STATISTICS
Table of Contents
1. Section 1: Introduction............................................................................................................................................................................................ 3
a) Brief introduction about the assignment:............................................................................................................................................................3
b) Dataset 1:........................................................................................................................................................................................................... 3
c) Dataset 2:............................................................................................................................................................................................................. 3
2. Section 2: Lodgement Method-Dataset 1...............................................................................................................................................................3
A) Part a................................................................................................................................................................................................................... 3
B) Part b................................................................................................................................................................................................................... 4
C) Part c................................................................................................................................................................................................................... 4
3. Section 3: Lodgement Method-Dataset2.................................................................................................................................................................4
A) Part a................................................................................................................................................................................................................... 4
B) Part b................................................................................................................................................................................................................... 5
C) Part c................................................................................................................................................................................................................... 5
4. Section 4: Lodgement Method and Age group-Dataset1:........................................................................................................................................6
A) Part a................................................................................................................................................................................................................... 6
B) Part b................................................................................................................................................................................................................. 10
C) Part c................................................................................................................................................................................................................. 11
5. Section 5: Lodgement Method and Total Income Amount-Dataset1:....................................................................................................................11
A) Part a................................................................................................................................................................................................................. 11
B) Part b................................................................................................................................................................................................................. 13
6. Section 6: Total Income Amount and Deduction Amount-Data set 1:...................................................................................................................16
A) Part a................................................................................................................................................................................................................. 16
B) Part b................................................................................................................................................................................................................. 19
Correlation:....................................................................................................................................................................................................... 19
Regression:........................................................................................................................................................................................................ 19
7. Section7: Conclusion.............................................................................................................................................................................................. 20
A) Part a................................................................................................................................................................................................................. 20
B) Part b: Further Research................................................................................................................................................................................... 20
References:................................................................................................................................................................................................................ 21
Appendices:............................................................................................................................................................................................................... 22
Dataset 1:.............................................................................................................................................................................................................. 22
Dataset 2:.............................................................................................................................................................................................................. 36
2PROBLEM ANALYSIS AND STATISTICS
1. Section 1: Introduction
a) Brief introduction about the assignment:
Many people need to lodge a tax return after the end of the financial year in Australia. Australians could arrange and lodge an own tax
return or pay a registered tax agent for doing it for themselves. By utilising a subset of the sample-file from the Australian Taxation Office (ATO),
we are shortly elaborating and analysing different hidden facts of lodgement method.
The report is constructed by elaborating two datasets. The first dataset is consists of five variables that are Gender, age_range,
Lodgement_method, Tot_inc_amt and Tot_ded_amt. We are keen to be aware about the proportion of people who prefer to lodge a tax return
utilising a tax agent. We are also keen to observe the difference among the age groups with accordance to corresponding lodging group. We are
testing whether there is an inherent relevance between total income and lodgement method or not. At last, we are testing whether there is an
relationship between total income and deduction amount or not.
A tax agent to lodge a tax return in the future constructs the second dataset with primary survey. The dataset2 is a collection of
preference of international students of tax return lodgement method.
b) Dataset 1:
The dataset1 is a secondary data. The data is gathered from internet sources. In dataset1, Gender is a qualitative variable, age_range is
the ordinal variable, Lodgement_method is the nominal variable, Tot_inc_amt and Tot_inc_amt are the numeric variables. Here, gender and
lodgement method is transformed where “Male”=1, “Female” = 0 and “A”=1, “S”=2.
c) Dataset 2:
The dataset2 is primary. The samples of data are gathered by survey method. In dataset2, we took into account only quantitative
dataset that is actually lodgement method. The data is collected by survey method. The target population was 215 students, among which 20
students incurred to respond. The remaining 195 students responded about the questions of questionnaire of survey method. Therefore, the
sample size of the data is 195. The data sampling method is simple random sampling without replacement that is unbiased in nature. However,
we nullified the missing data for getting good outcomes. Therefore, bias could arise. The dataset involves two variables that are “Country_name”
and “Lodgment_method”. Lodgement method has similar levels in dataset2 as was in dataset1 that are “A”=lodgement by agent and
“S”=lodgement by self-preparation.
2. Section 2: Lodgement Method-Dataset 1
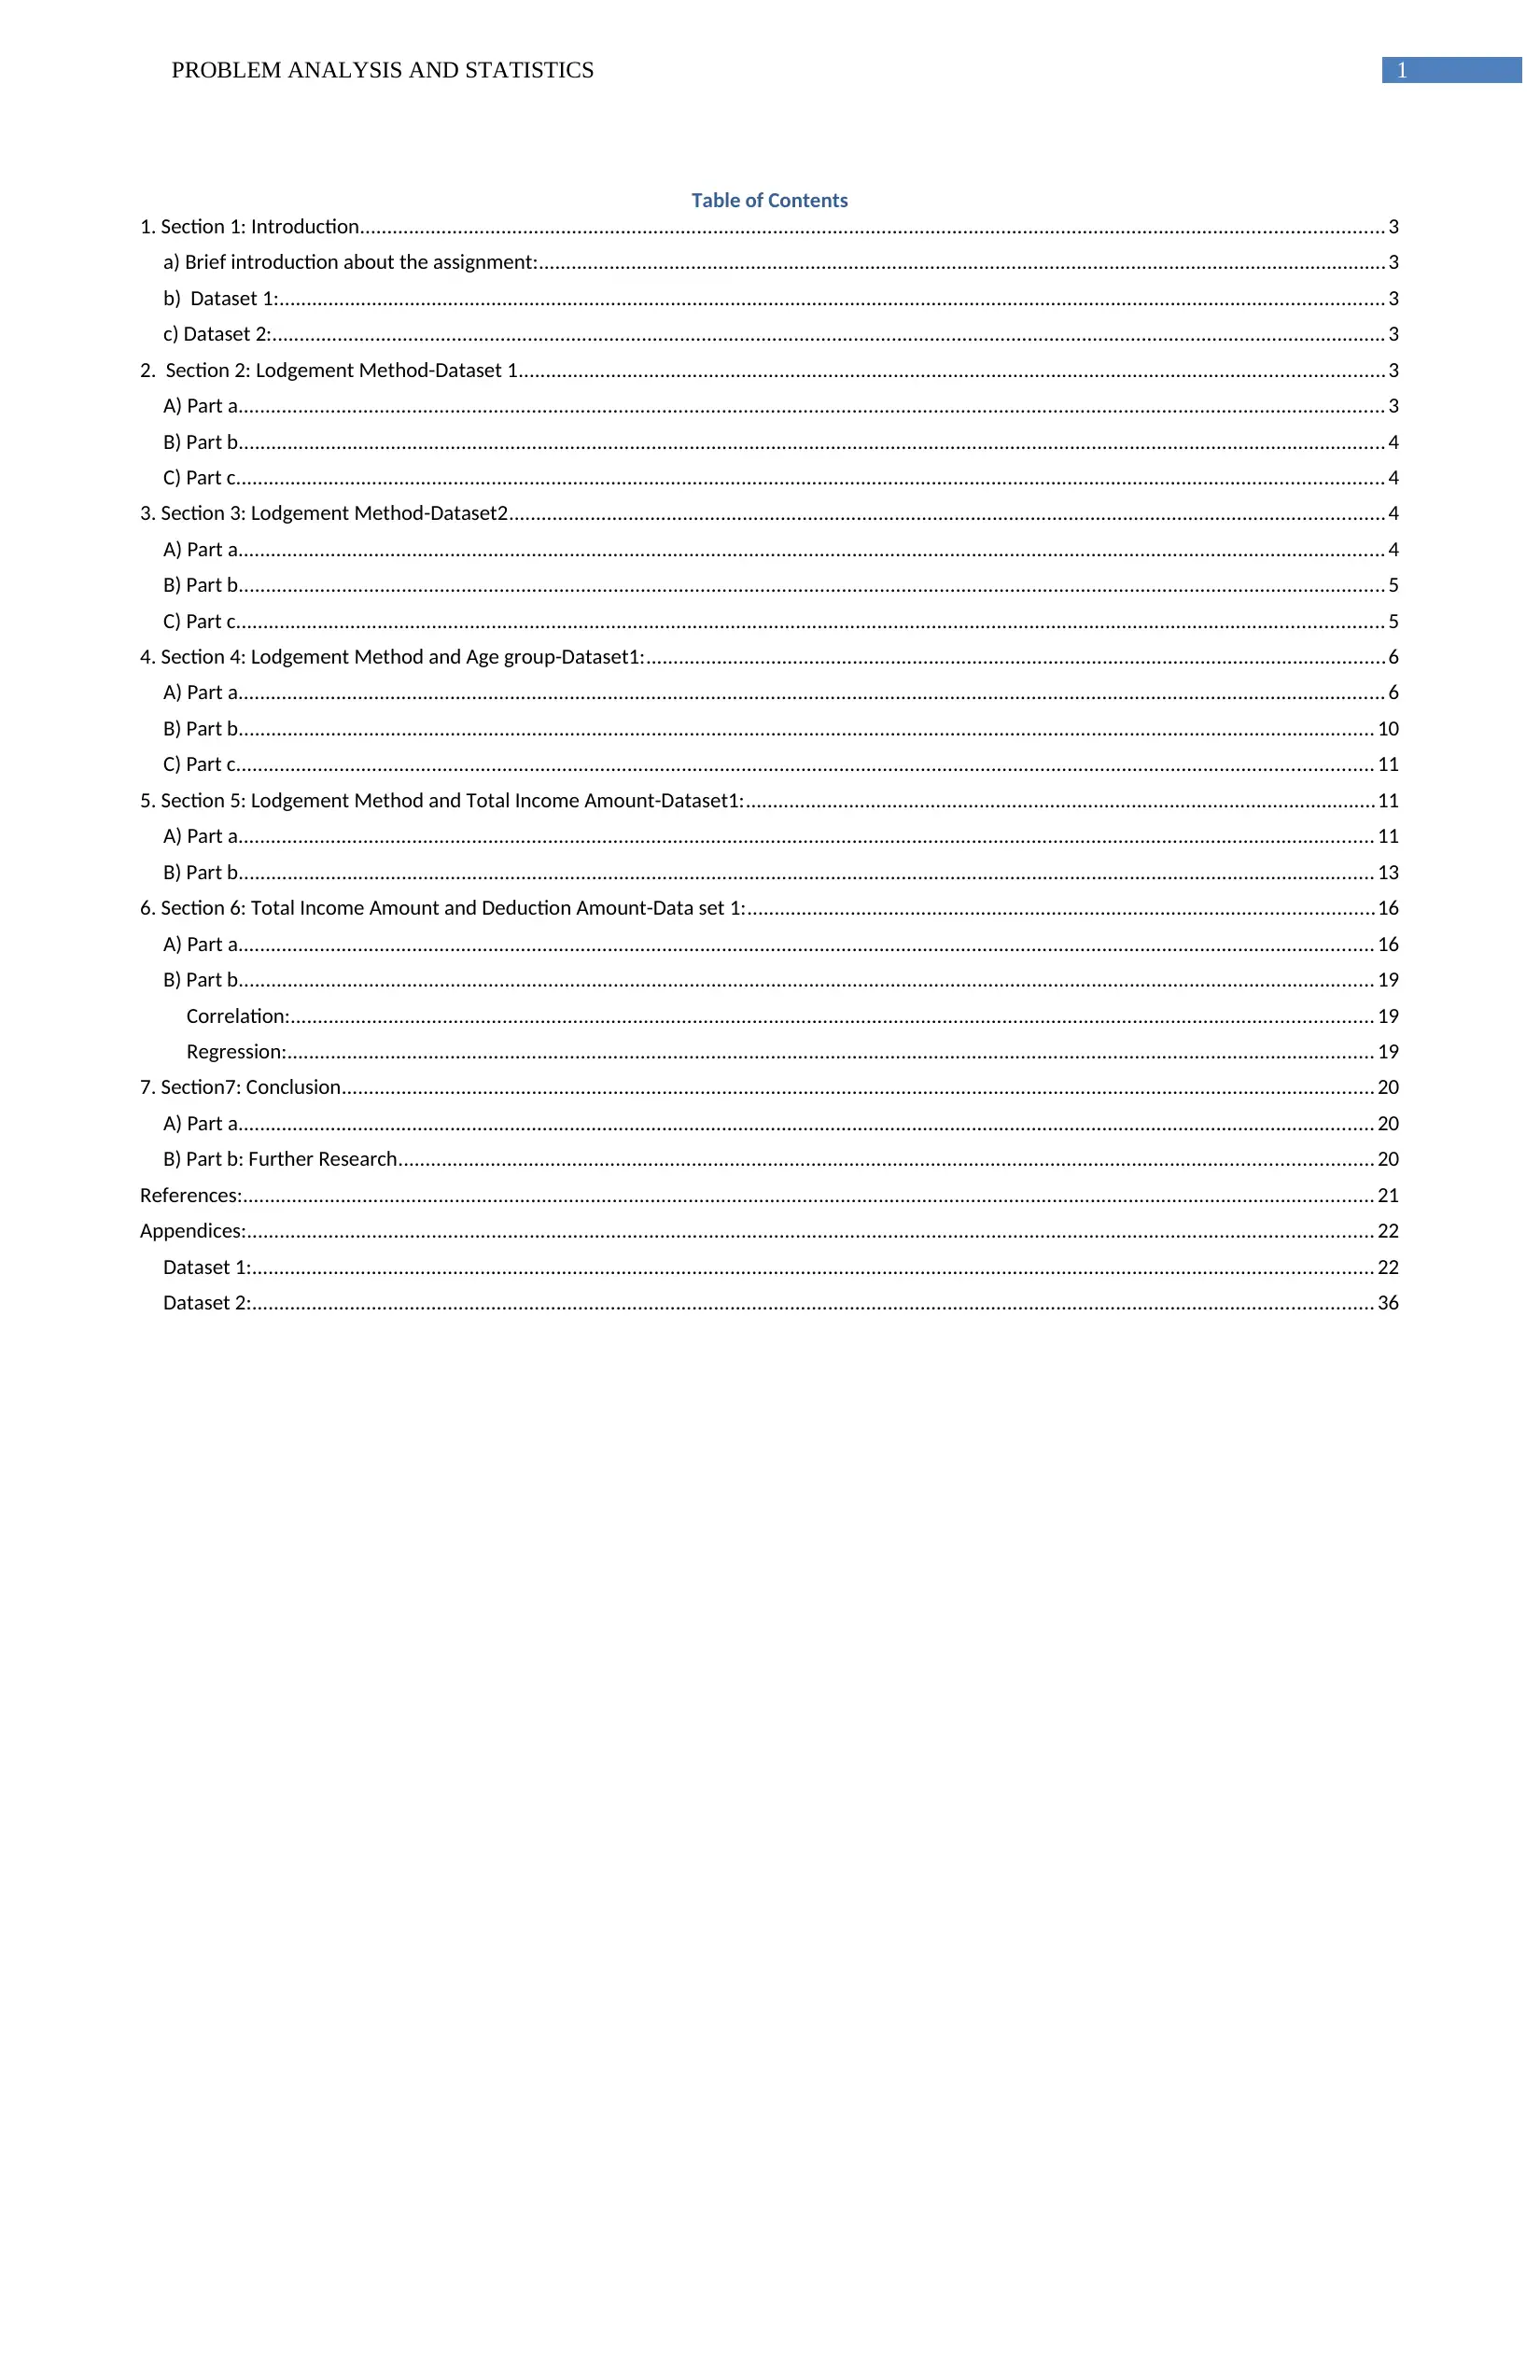
A) Part a
Lodgment Frequency Proportion
Agent 721 0.721
Self 279 0.279
Total 1000 1
The above frequency table of dataset1 refers that out of 1000 people 732 people (73.2%) carry out their lodgment by Agents. Only 268
people (26.8%) carry out their lodgment by self-preparation.
Pie Chart of Lodgement Method
agent
self
The pie chart refers the distribution of two types of lodgment methods that are agent (A) and self-preparation (S) in dataset1.
B) Part b
One Sample Proportional Z-test
proportion (p) = 0.721
(1-p) = 0.279
total sample = 1000
standard error = 0.014183053
Level of significance = 5%
confidence limit = 95%
z-value at 0.05 critical region = 1.959963985
Confidence Intervals
upper confidence interval = 0.748798274
1. Section 1: Introduction
a) Brief introduction about the assignment:
Many people need to lodge a tax return after the end of the financial year in Australia. Australians could arrange and lodge an own tax
return or pay a registered tax agent for doing it for themselves. By utilising a subset of the sample-file from the Australian Taxation Office (ATO),
we are shortly elaborating and analysing different hidden facts of lodgement method.
The report is constructed by elaborating two datasets. The first dataset is consists of five variables that are Gender, age_range,
Lodgement_method, Tot_inc_amt and Tot_ded_amt. We are keen to be aware about the proportion of people who prefer to lodge a tax return
utilising a tax agent. We are also keen to observe the difference among the age groups with accordance to corresponding lodging group. We are
testing whether there is an inherent relevance between total income and lodgement method or not. At last, we are testing whether there is an
relationship between total income and deduction amount or not.
A tax agent to lodge a tax return in the future constructs the second dataset with primary survey. The dataset2 is a collection of
preference of international students of tax return lodgement method.
b) Dataset 1:
The dataset1 is a secondary data. The data is gathered from internet sources. In dataset1, Gender is a qualitative variable, age_range is
the ordinal variable, Lodgement_method is the nominal variable, Tot_inc_amt and Tot_inc_amt are the numeric variables. Here, gender and
lodgement method is transformed where “Male”=1, “Female” = 0 and “A”=1, “S”=2.
c) Dataset 2:
The dataset2 is primary. The samples of data are gathered by survey method. In dataset2, we took into account only quantitative
dataset that is actually lodgement method. The data is collected by survey method. The target population was 215 students, among which 20
students incurred to respond. The remaining 195 students responded about the questions of questionnaire of survey method. Therefore, the
sample size of the data is 195. The data sampling method is simple random sampling without replacement that is unbiased in nature. However,
we nullified the missing data for getting good outcomes. Therefore, bias could arise. The dataset involves two variables that are “Country_name”
and “Lodgment_method”. Lodgement method has similar levels in dataset2 as was in dataset1 that are “A”=lodgement by agent and
“S”=lodgement by self-preparation.
2. Section 2: Lodgement Method-Dataset 1
A) Part a
Lodgment Frequency Proportion
Agent 721 0.721
Self 279 0.279
Total 1000 1
The above frequency table of dataset1 refers that out of 1000 people 732 people (73.2%) carry out their lodgment by Agents. Only 268
people (26.8%) carry out their lodgment by self-preparation.
Pie Chart of Lodgement Method
agent
self
The pie chart refers the distribution of two types of lodgment methods that are agent (A) and self-preparation (S) in dataset1.
B) Part b
One Sample Proportional Z-test
proportion (p) = 0.721
(1-p) = 0.279
total sample = 1000
standard error = 0.014183053
Level of significance = 5%
confidence limit = 95%
z-value at 0.05 critical region = 1.959963985
Confidence Intervals
upper confidence interval = 0.748798274
⊘ This is a preview!⊘
Do you want full access?
Subscribe today to unlock all pages.
Trusted by 1+ million students worldwide
3PROBLEM ANALYSIS AND STATISTICS
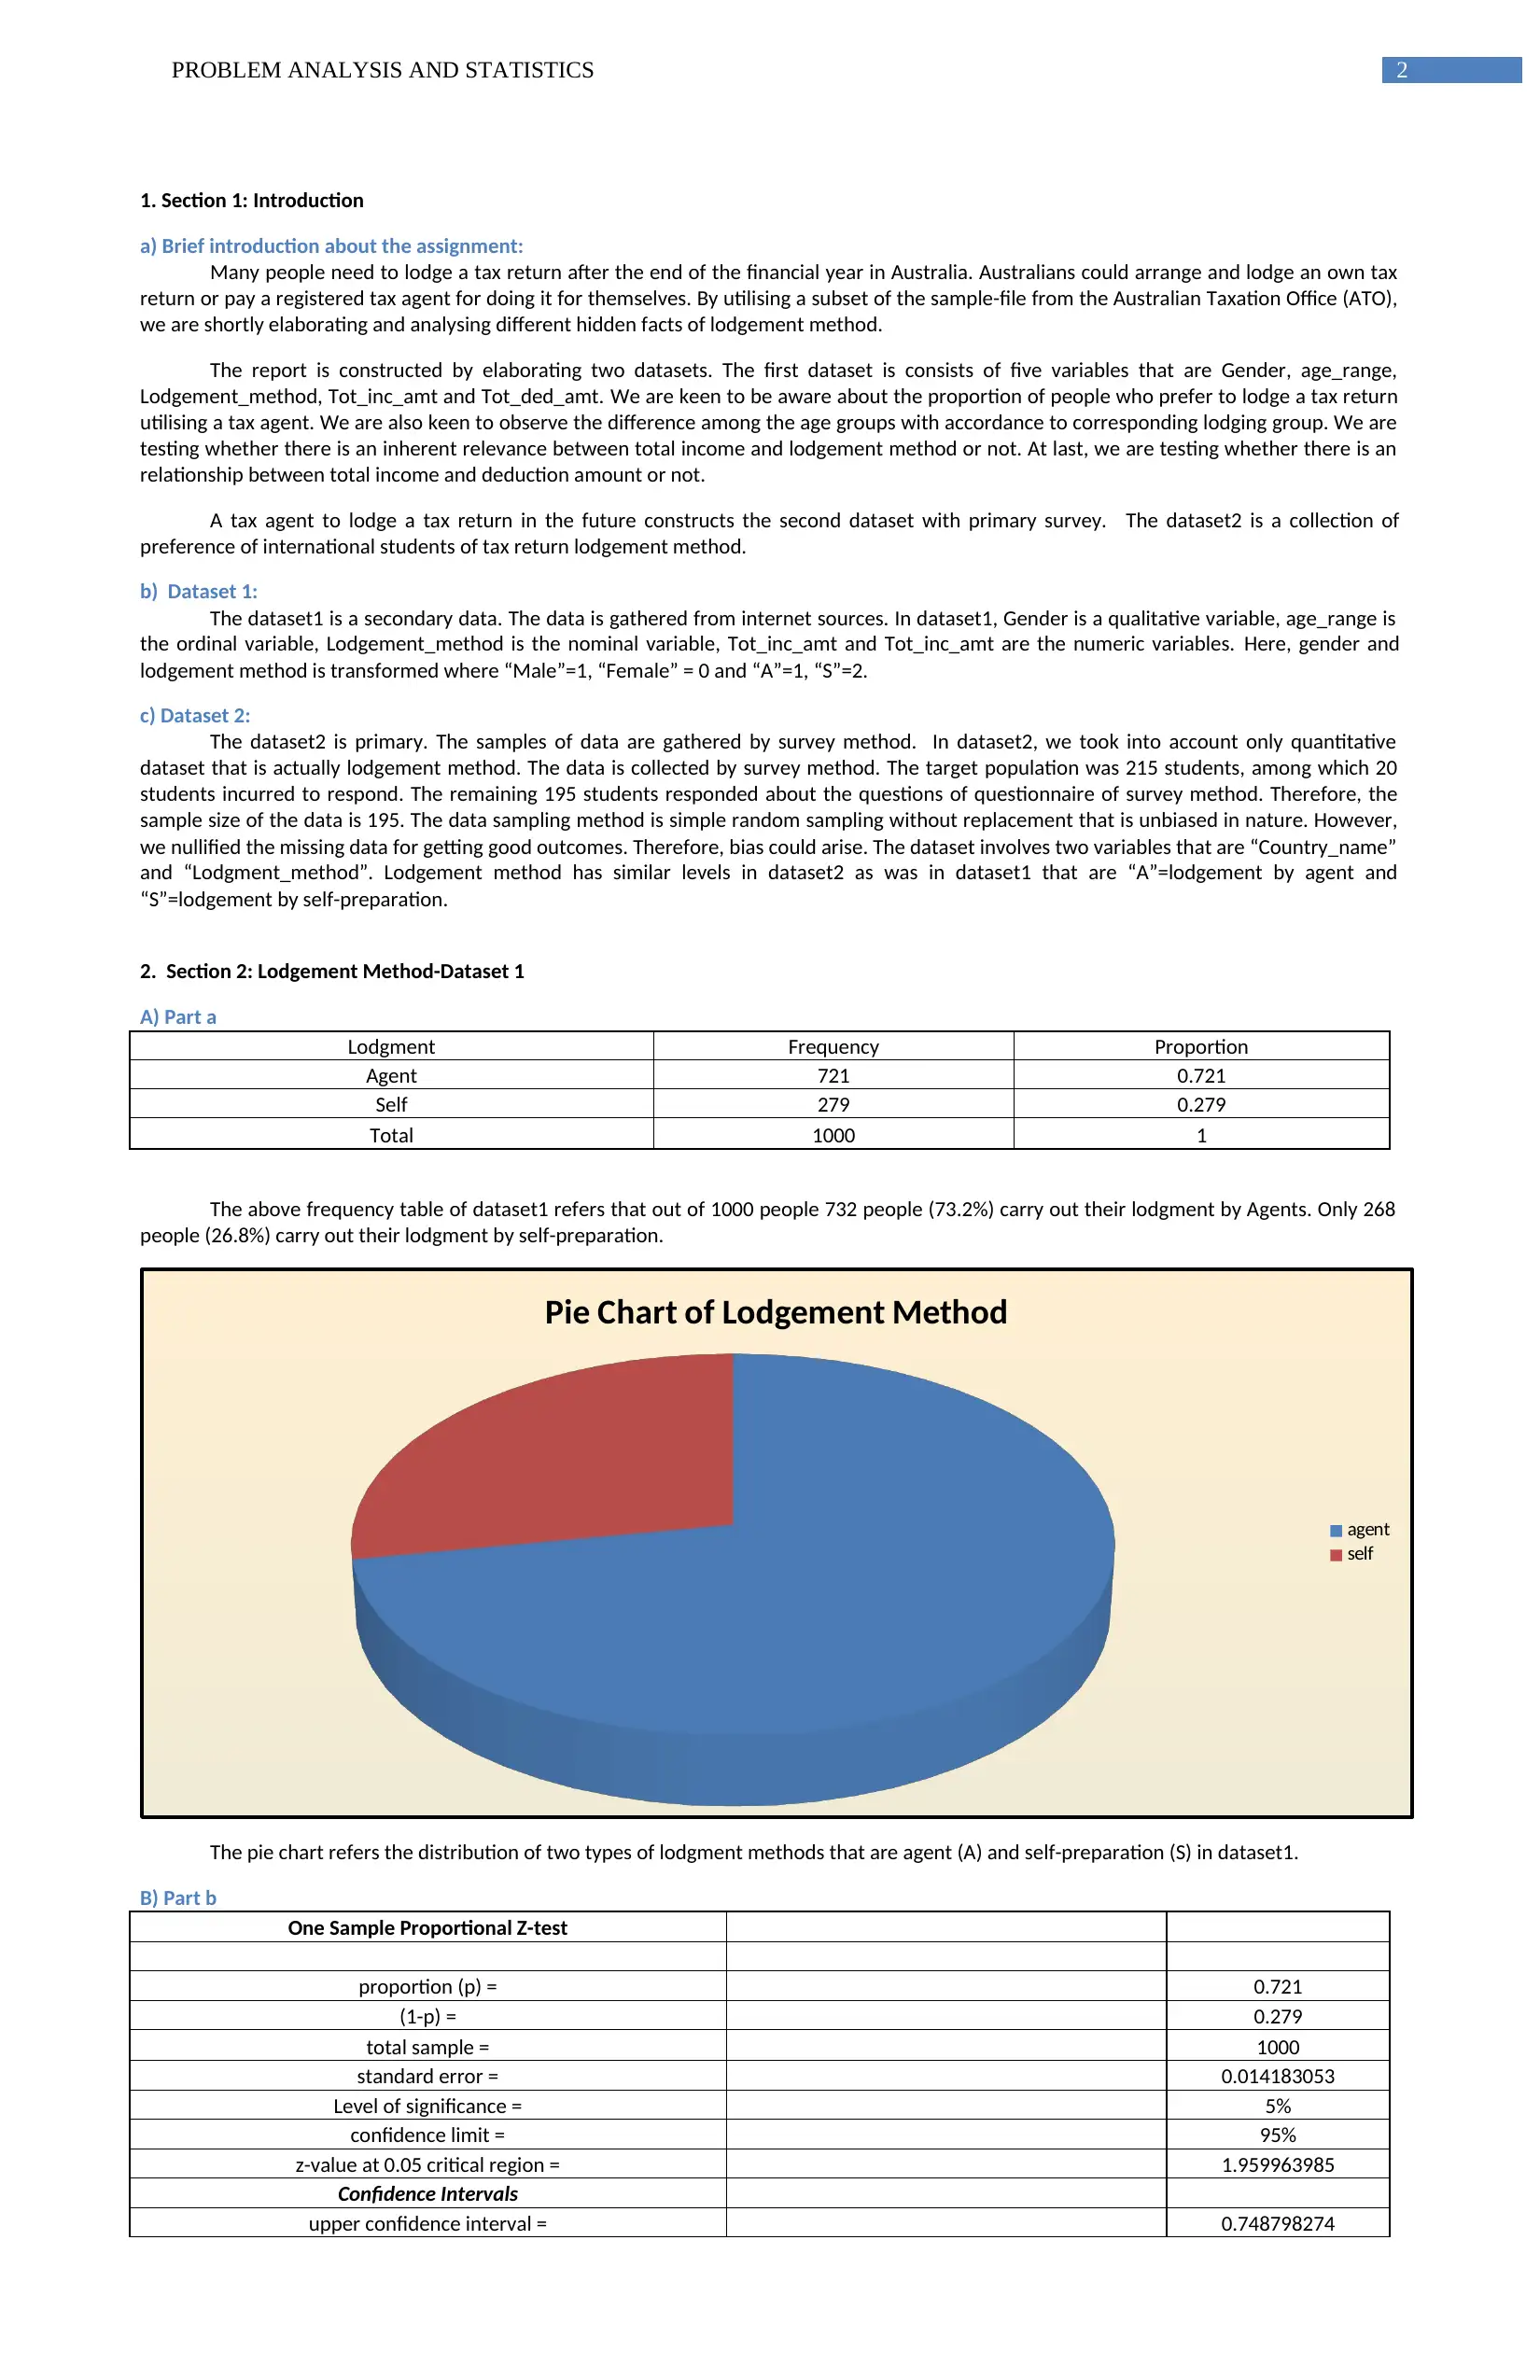
lower confidence interval = 0.693201726
C) Part c
One sample proportional z-test is used for testing the proportion of lodging method as agent. The exact proportion of lodging method as
agent is 0.721. The lower and upper confidence intervals of proportion of lodging method by agents are 0.693201726 and 0.748798274 at 5%
level of significance. It refers that there is 95% probability of being the proportion of lodging method via agent between these two intervals.
3. Section 3: Lodgement Method-Dataset2
A) Part a
Lodgment Count Proportion
Agent 131 0.671794872
Self 64 0.328205128
Total 195 1
The frequency table in dataset2 indicates that among 195 people, 131 people (67.18%) carry out their lodgment method by Agents. Only
64 people (32.82%) carry out their lodgment method by Self-preparation.
Pie Chart of Lodgment Method
Agent
Self
The pie chart refers the distribution of two types of lodgment methods that are lodgment method via agent and self-preparation in dataset 2.
B) Part b
One sample proportional Z-test
proportion (p) = 0.671794872
(1-p) = 0.328205128
total sample = 195
standard error = 0.033625885
Level of significance = 5%
confidence limit = 95%
z-value at 0.05 critical region = 1.959963985
Confidence Intervals
upper confidence interval = 0.737700394
lower confidence interval = 0.605889349
C) Part c
One sample proportional z-test is carried out for testing the proportion of lodging method as agent in dataset2. The exact proportion of
lodging method as agent is 0.671794872. The calculated confidence intervals of proportion of lodging method via agent are 0.737700394 and
0.605889349. That refers that there is 95% probability of being the proportion of lodging method via agent between these two intervals in
dataset2.
The dataset1 has greater sample than dataset2 (1000>195). In the dataset1, among 1000 people 732 people (73.2%) make their lodging
via agent. Whereas, in the dataset2, among 180 people 131 people (more than 67.18%) make their lodging via agent. The survey outcome
provides lesser percentage of lodging by agent. We execute two samples proportional z-test of examining equality of proportions.
Null hypothesis: The proportions are equal for both the dataset1 and dataset2.
Alternative hypothesis: The proportions are unequal for both the dataset1 and dataset2.
Two sample z-test
dataset 1 total sample 1000
lodging by agent 732
proportion (p1bar) 0.732
dataset 2 total sample 195
Paraphrase This Document
Need a fresh take? Get an instant paraphrase of this document with our AI Paraphraser

4PROBLEM ANALYSIS AND STATISTICS
lodging by agent 131
proportion (p2bar) 0.671794872
total sample 1195
total lodging by agent 863
total proportion (p-bar) 0.722175732
numerator of z-statistic (p1bar - p2bar) 0.060205128
pbar* (1-pbar) 0.200637944
proportion*sample 0.00122955
denominator of z-statistic SQRT(proportion*sample) 0.035064947
z-statistic 1.716960501
p-value 0.15386
Decision-making Null hypothesis accepted
The two samples z-test for testing the equality of means is applied for testing the equality of proportions ( Cleophas, Ton and Aeilko,
2016). The calculated z-statistic is 1.716960501. According to the calculated p-value, we accept the null hypothesis at 95% confidence interval.
Hence, there is 95% probability of being the proportions of lodgment method of two datasets equal. We can say that these two datasets have
equality in proportional values of lodgment methods.
4. Section 4: Lodgement Method and Age group-Dataset1:
A) Part a
Correlation Coefficient
age_range Lodgment_method
age_range 1
Lodgment_method -0.024900721 1
The Pearson correlation coefficient is -0.024900721. Therefore, the correlation coefficient between age range and lodgment method is
insignificant. Hence, we can say that the amount of age range and lodgment method are uncorrelated to each other. For calculating the
correlation coefficient, we transformed “agent” as 1 and “self” as 2 for making qualitative variable quantitative variable.
Lodging Method is Self:
Numerical Summary
age_range
Mean 7.028673835
Standard Error 0.173313376
Median 8
Mode 10
Standard Deviation 2.894904112
Sample Variance 8.380469818
Kurtosis -0.456227604
Skewness -0.675677893
Range 11
Minimum 0
Maximum 11
Sum 1961
Count 279
Largest(1) 11
Smallest(1) 0
Confidence Level(95.0%) 0.341173258
upper control limit 7.368368052
lower control limit 6.688979619
The mean age range of lodging method by “Self-preparation” is 7.028673835. The age range of “Self-preparation” lodging method has
the 95% probability of being within the interval 6.688979619 and 7.368368052.
Table: The frequency distribution table of age group when lodging method is “Self”
age_group frequency cumulative frequency percentage of frequency cumulative percentage of frequency
0 7 7 2.51% 2.51%
1 8 15 2.87% 5.38%
2 11 26 3.94% 9.32%
3 15 41 5.38% 14.70%
4 17 58 6.09% 20.79%
5 22 80 7.89% 28.67%
6 22 102 7.89% 36.56%
7 31 133 11.11% 47.67%
5PROBLEM ANALYSIS AND STATISTICS
8 39 172 13.98% 61.65%
9 40 212 14.34% 75.99%
10 50 262 17.92% 93.91%
11 17 279 6.09% 100.00%
total 279 1
0 1 2 3 4 5 6 7 8 9 10 11
0
10
20
30
40
50
60
Histogram of age wise frequencies
Age group
Frequency
The frequency is maximum for age group number “10” (50) and minimum for age groups “0“(7).
0 1 2 3 4 5 6 7 8 9 10 11
0
50
100
150
200
250
300
Histogram of age wise cumulative frequencies
Age group
cumulative frequencies
0 1 2 3 4 5 6 7 8 9 10 11
0.00%
2.00%
4.00%
6.00%
8.00%
10.00%
12.00%
14.00%
16.00%
18.00%
20.00%
Histogram of age-wise percentage of frequencies
Age group
Percentage frequency
The percentage of frequency is maximum for age group number “10” (17.92%) and minimum for age group “0” (2.51%).
0 1 2 3 4 5 6 7 8 9 10 11
0.00%
20.00%
40.00%
60.00%
80.00%
100.00%
120.00%
Histogram of age wise cumulative percentage of frequencies
Age group
cumulative percentage of frequency
⊘ This is a preview!⊘
Do you want full access?
Subscribe today to unlock all pages.
Trusted by 1+ million students worldwide
6PROBLEM ANALYSIS AND STATISTICS
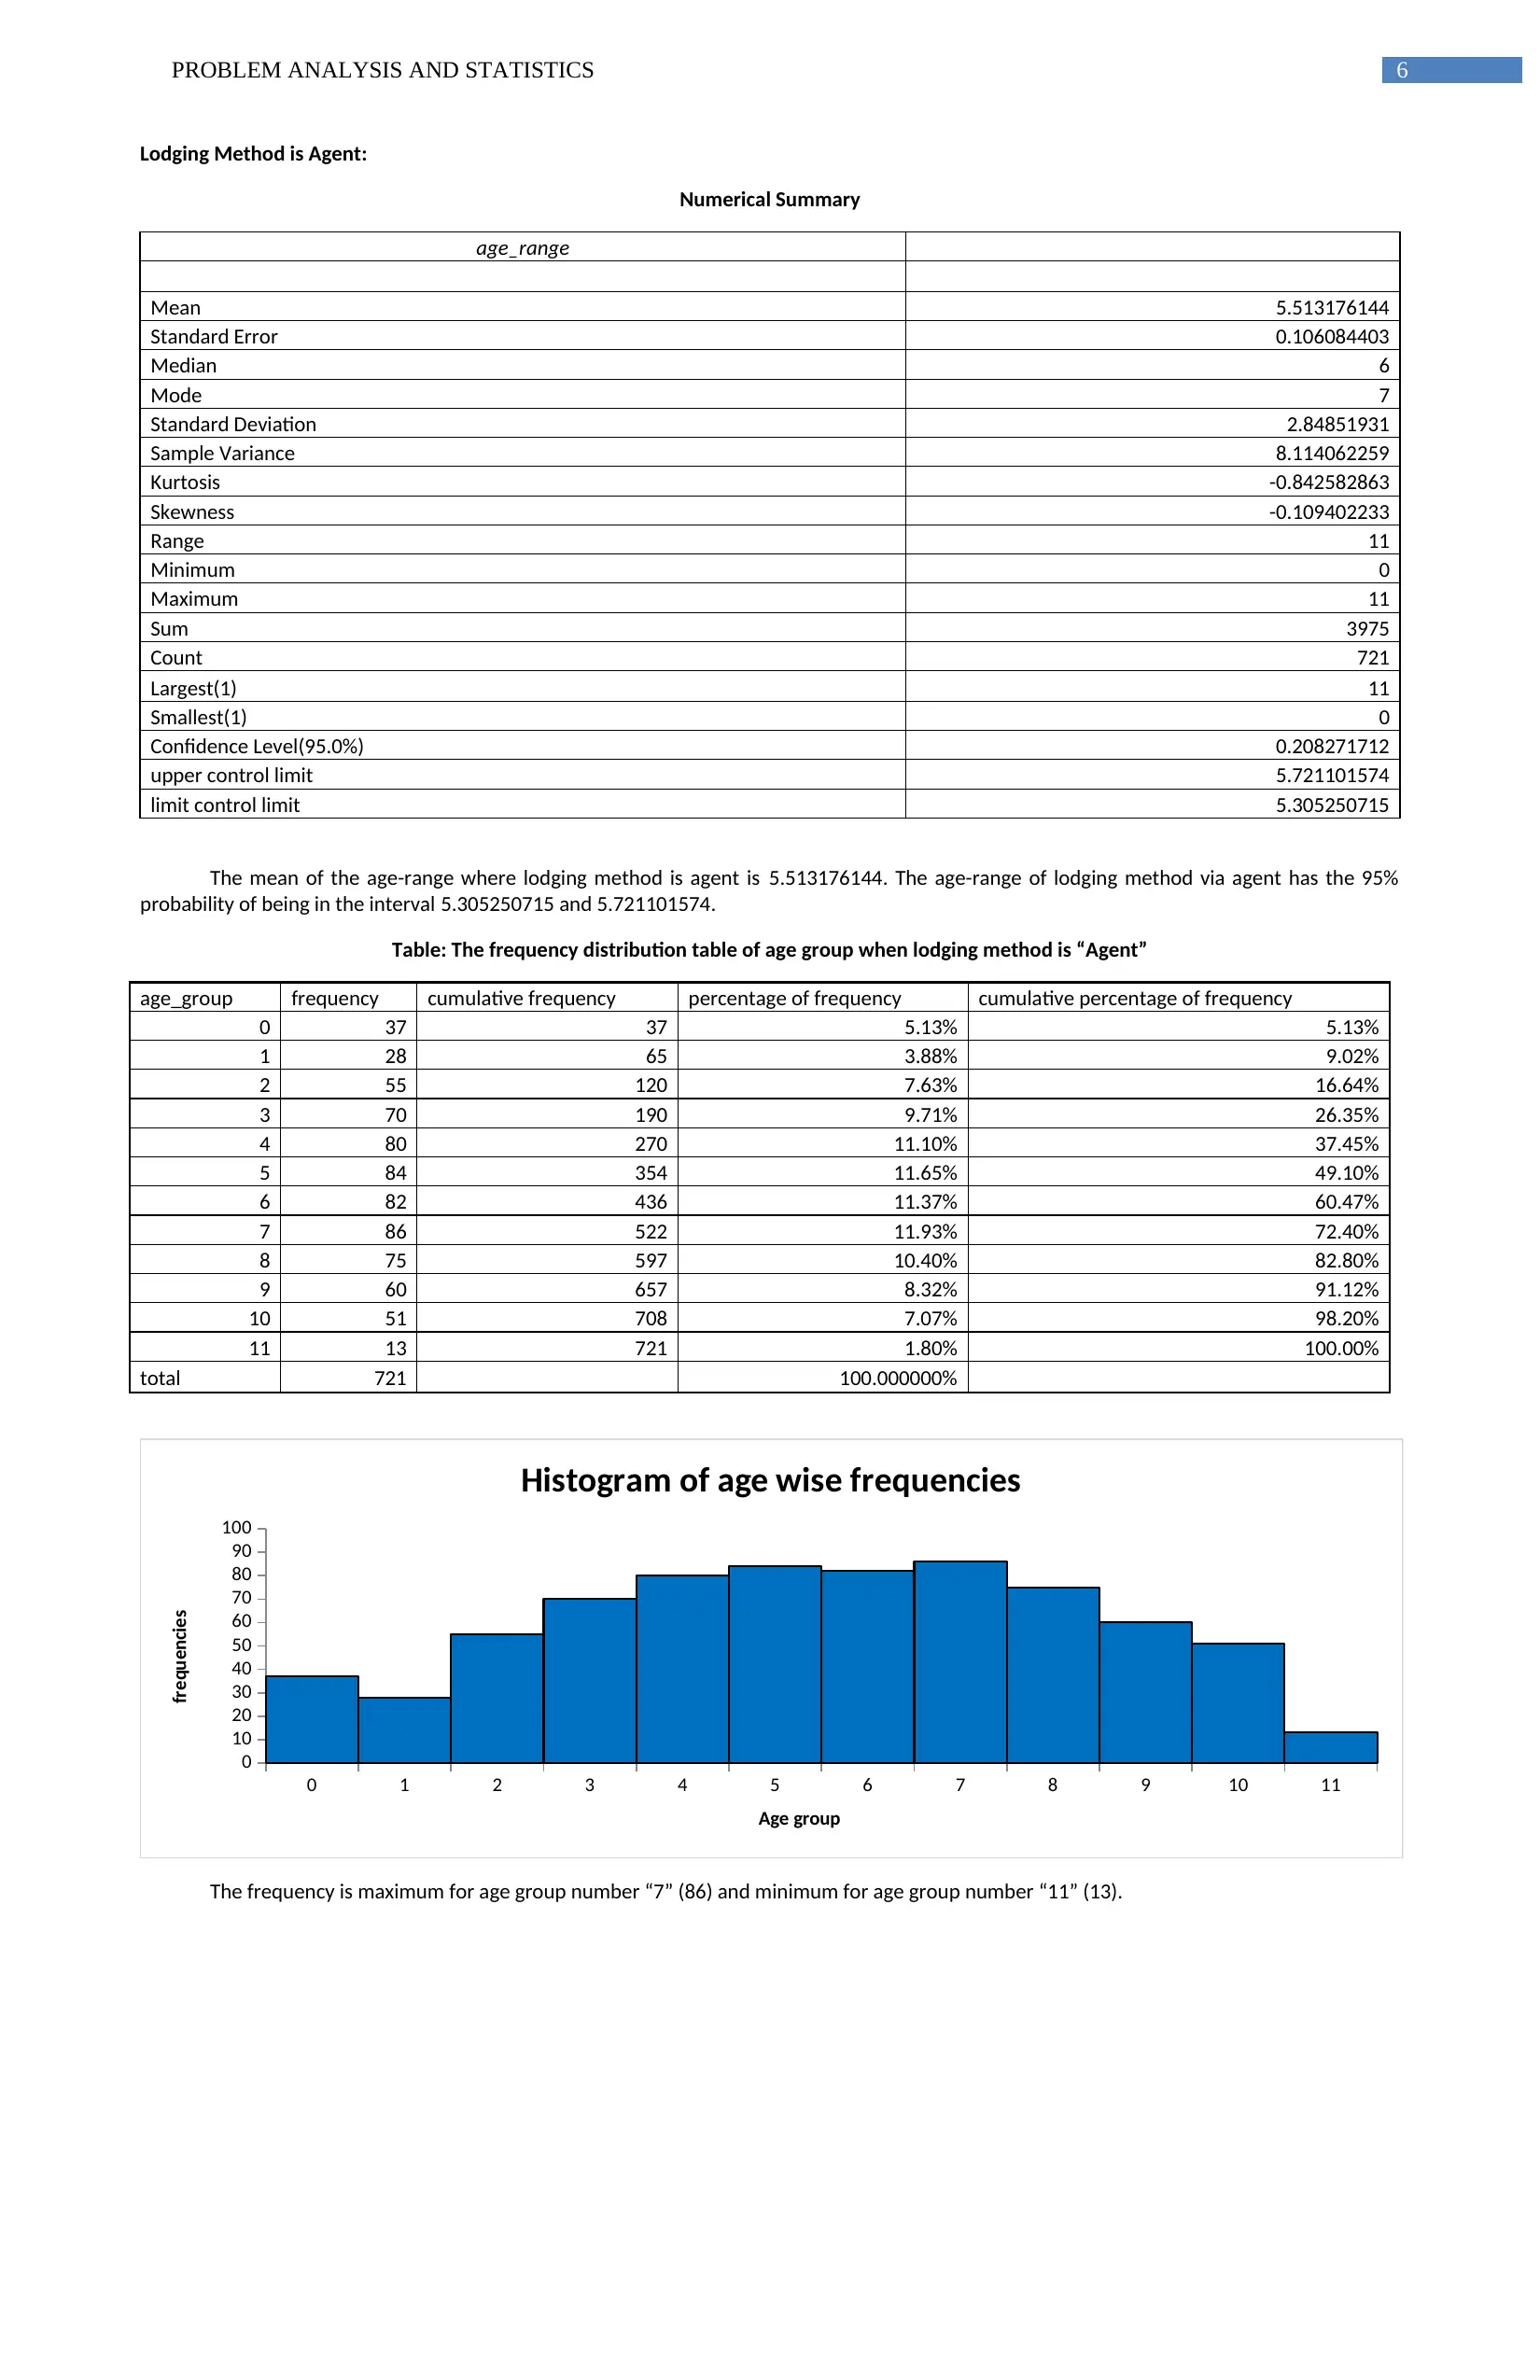
Lodging Method is Agent:
Numerical Summary
age_range
Mean 5.513176144
Standard Error 0.106084403
Median 6
Mode 7
Standard Deviation 2.84851931
Sample Variance 8.114062259
Kurtosis -0.842582863
Skewness -0.109402233
Range 11
Minimum 0
Maximum 11
Sum 3975
Count 721
Largest(1) 11
Smallest(1) 0
Confidence Level(95.0%) 0.208271712
upper control limit 5.721101574
limit control limit 5.305250715
The mean of the age-range where lodging method is agent is 5.513176144. The age-range of lodging method via agent has the 95%
probability of being in the interval 5.305250715 and 5.721101574.
Table: The frequency distribution table of age group when lodging method is “Agent”
age_group frequency cumulative frequency percentage of frequency cumulative percentage of frequency
0 37 37 5.13% 5.13%
1 28 65 3.88% 9.02%
2 55 120 7.63% 16.64%
3 70 190 9.71% 26.35%
4 80 270 11.10% 37.45%
5 84 354 11.65% 49.10%
6 82 436 11.37% 60.47%
7 86 522 11.93% 72.40%
8 75 597 10.40% 82.80%
9 60 657 8.32% 91.12%
10 51 708 7.07% 98.20%
11 13 721 1.80% 100.00%
total 721 100.000000%
0 1 2 3 4 5 6 7 8 9 10 11
0
10
20
30
40
50
60
70
80
90
100
Histogram of age wise frequencies
Age group
frequencies
The frequency is maximum for age group number “7” (86) and minimum for age group number “11” (13).
Paraphrase This Document
Need a fresh take? Get an instant paraphrase of this document with our AI Paraphraser
7PROBLEM ANALYSIS AND STATISTICS
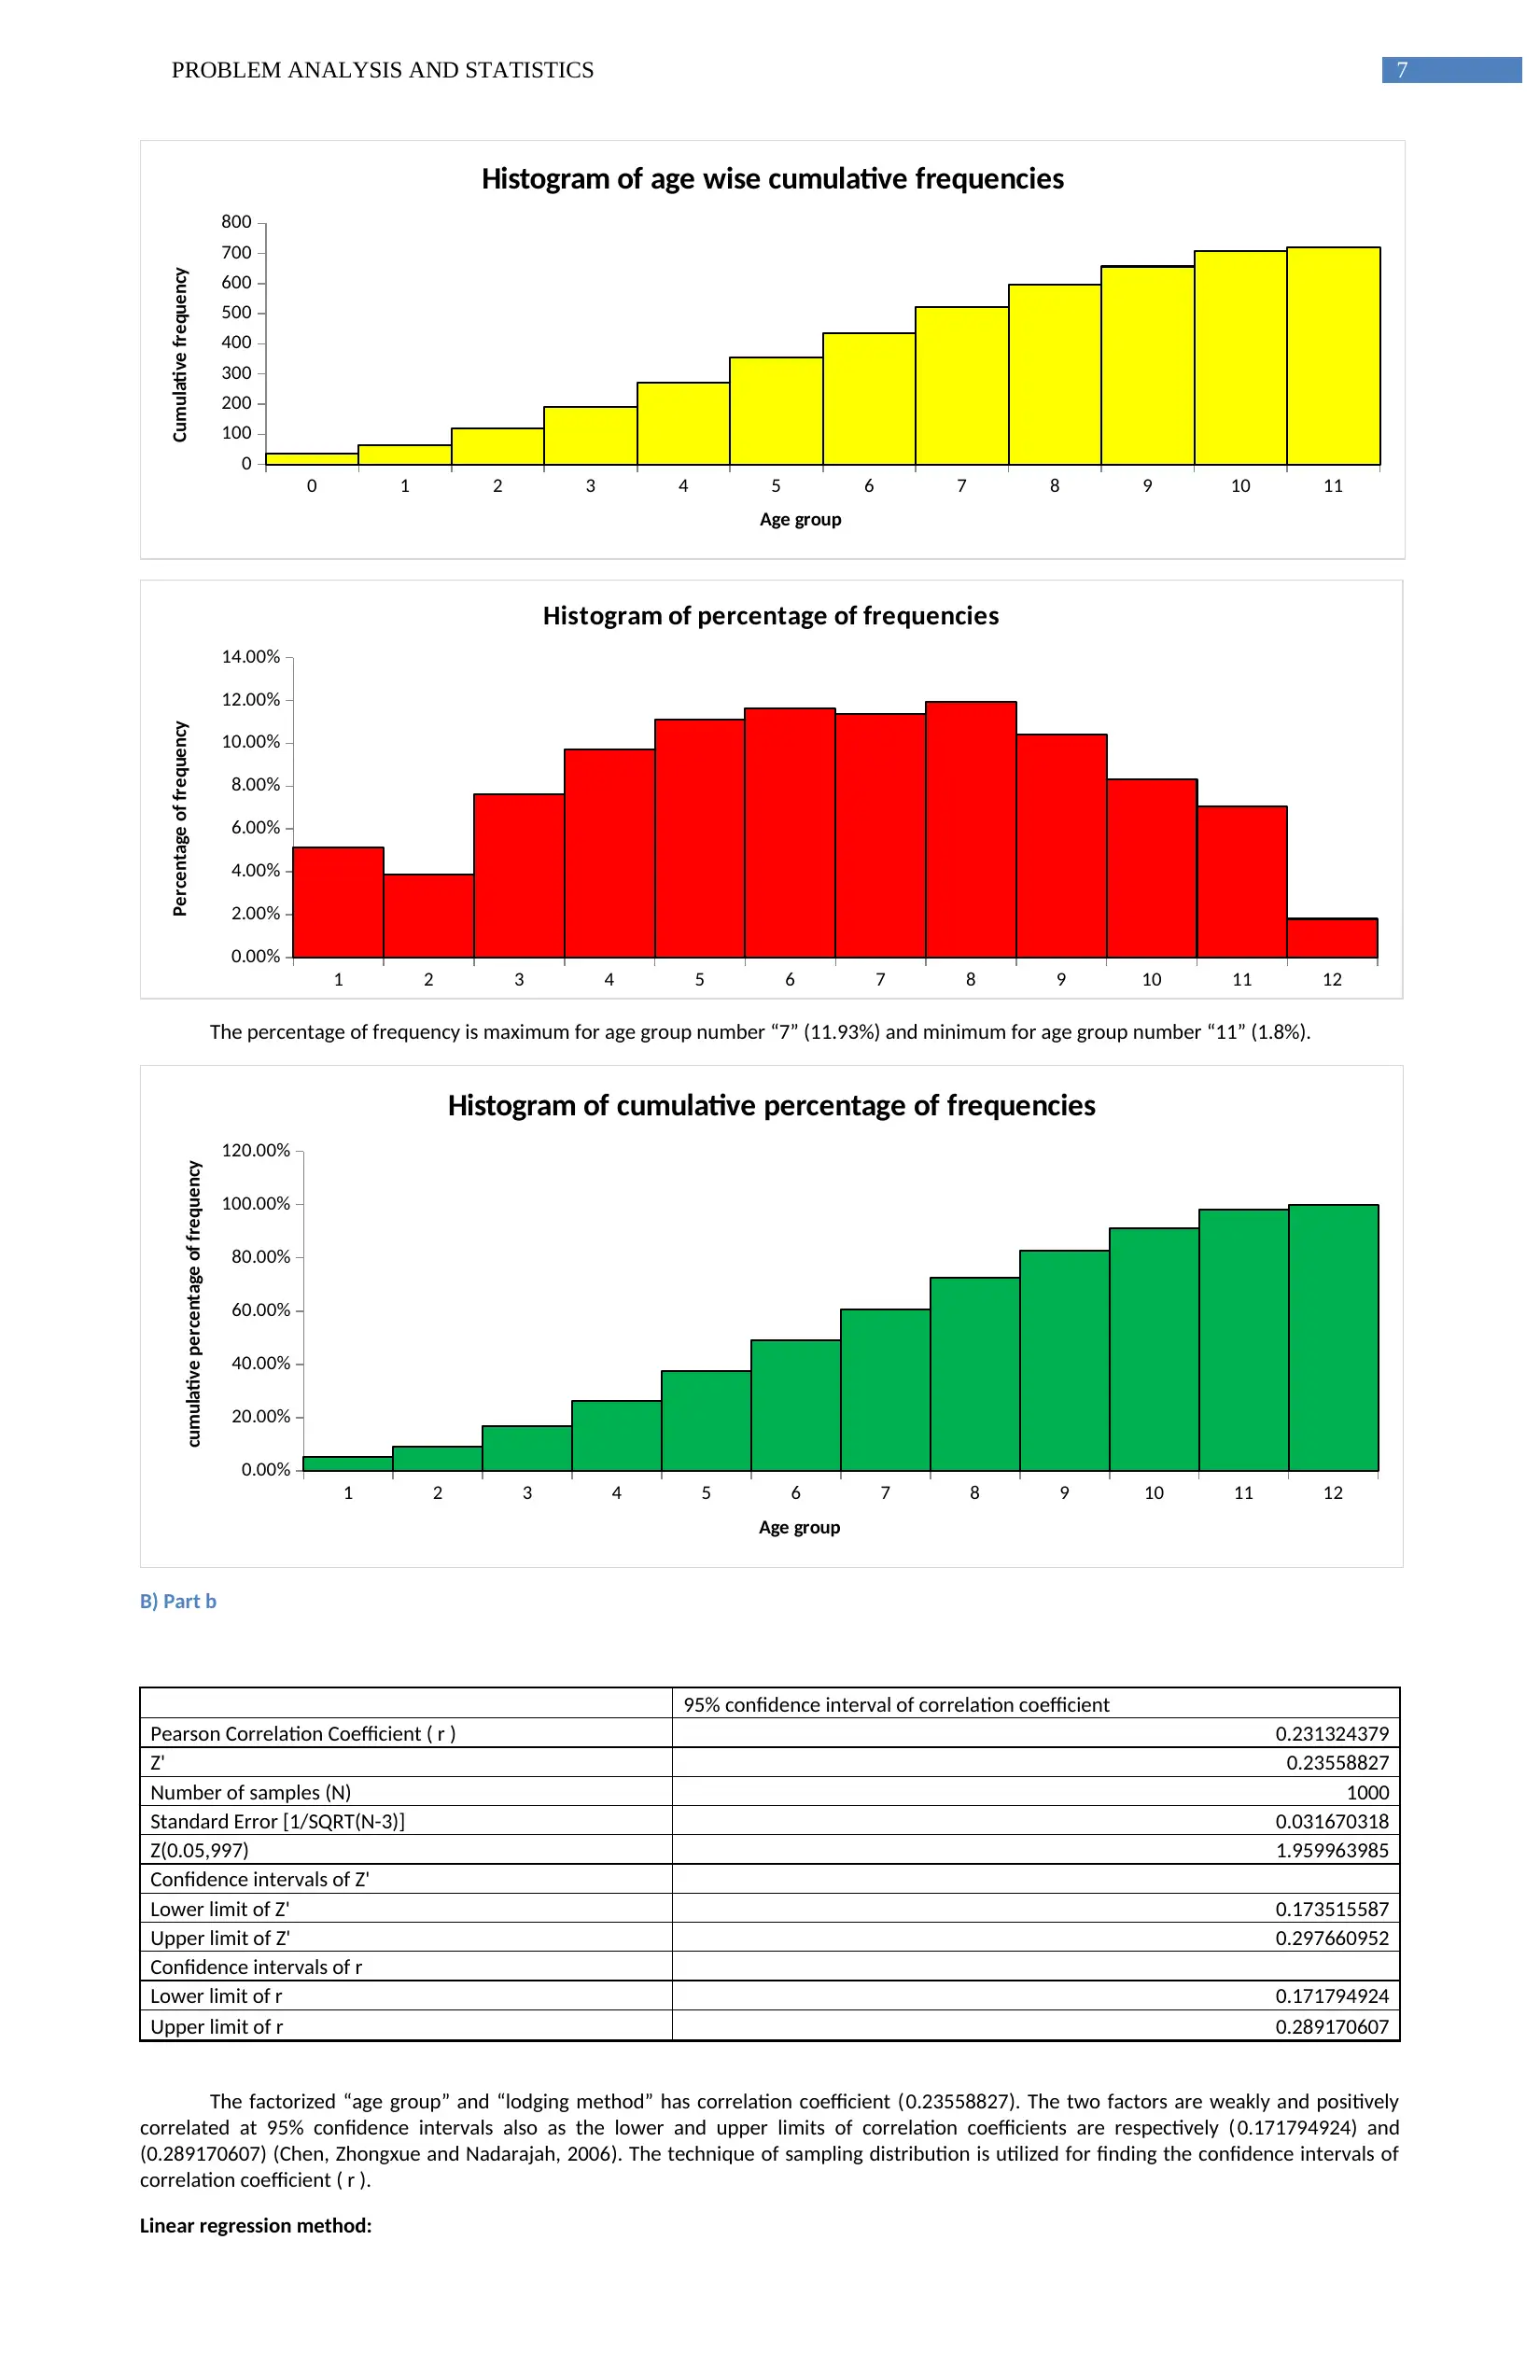
0 1 2 3 4 5 6 7 8 9 10 11
0
100
200
300
400
500
600
700
800
Histogram of age wise cumulative frequencies
Age group
Cumulative frequency
1 2 3 4 5 6 7 8 9 10 11 12
0.00%
2.00%
4.00%
6.00%
8.00%
10.00%
12.00%
14.00%
Histogram of percentage of frequencies
Percentage of frequency
The percentage of frequency is maximum for age group number “7” (11.93%) and minimum for age group number “11” (1.8%).
1 2 3 4 5 6 7 8 9 10 11 12
0.00%
20.00%
40.00%
60.00%
80.00%
100.00%
120.00%
Histogram of cumulative percentage of frequencies
Age group
cumulative percentage of frequency
B) Part b
95% confidence interval of correlation coefficient
Pearson Correlation Coefficient ( r ) 0.231324379
Z' 0.23558827
Number of samples (N) 1000
Standard Error [1/SQRT(N-3)] 0.031670318
Z(0.05,997) 1.959963985
Confidence intervals of Z'
Lower limit of Z' 0.173515587
Upper limit of Z' 0.297660952
Confidence intervals of r
Lower limit of r 0.171794924
Upper limit of r 0.289170607
The factorized “age group” and “lodging method” has correlation coefficient (0.23558827). The two factors are weakly and positively
correlated at 95% confidence intervals also as the lower and upper limits of correlation coefficients are respectively ( 0.171794924) and
(0.289170607) (Chen, Zhongxue and Nadarajah, 2006). The technique of sampling distribution is utilized for finding the confidence intervals of
correlation coefficient ( r ).
Linear regression method:
8PROBLEM ANALYSIS AND STATISTICS
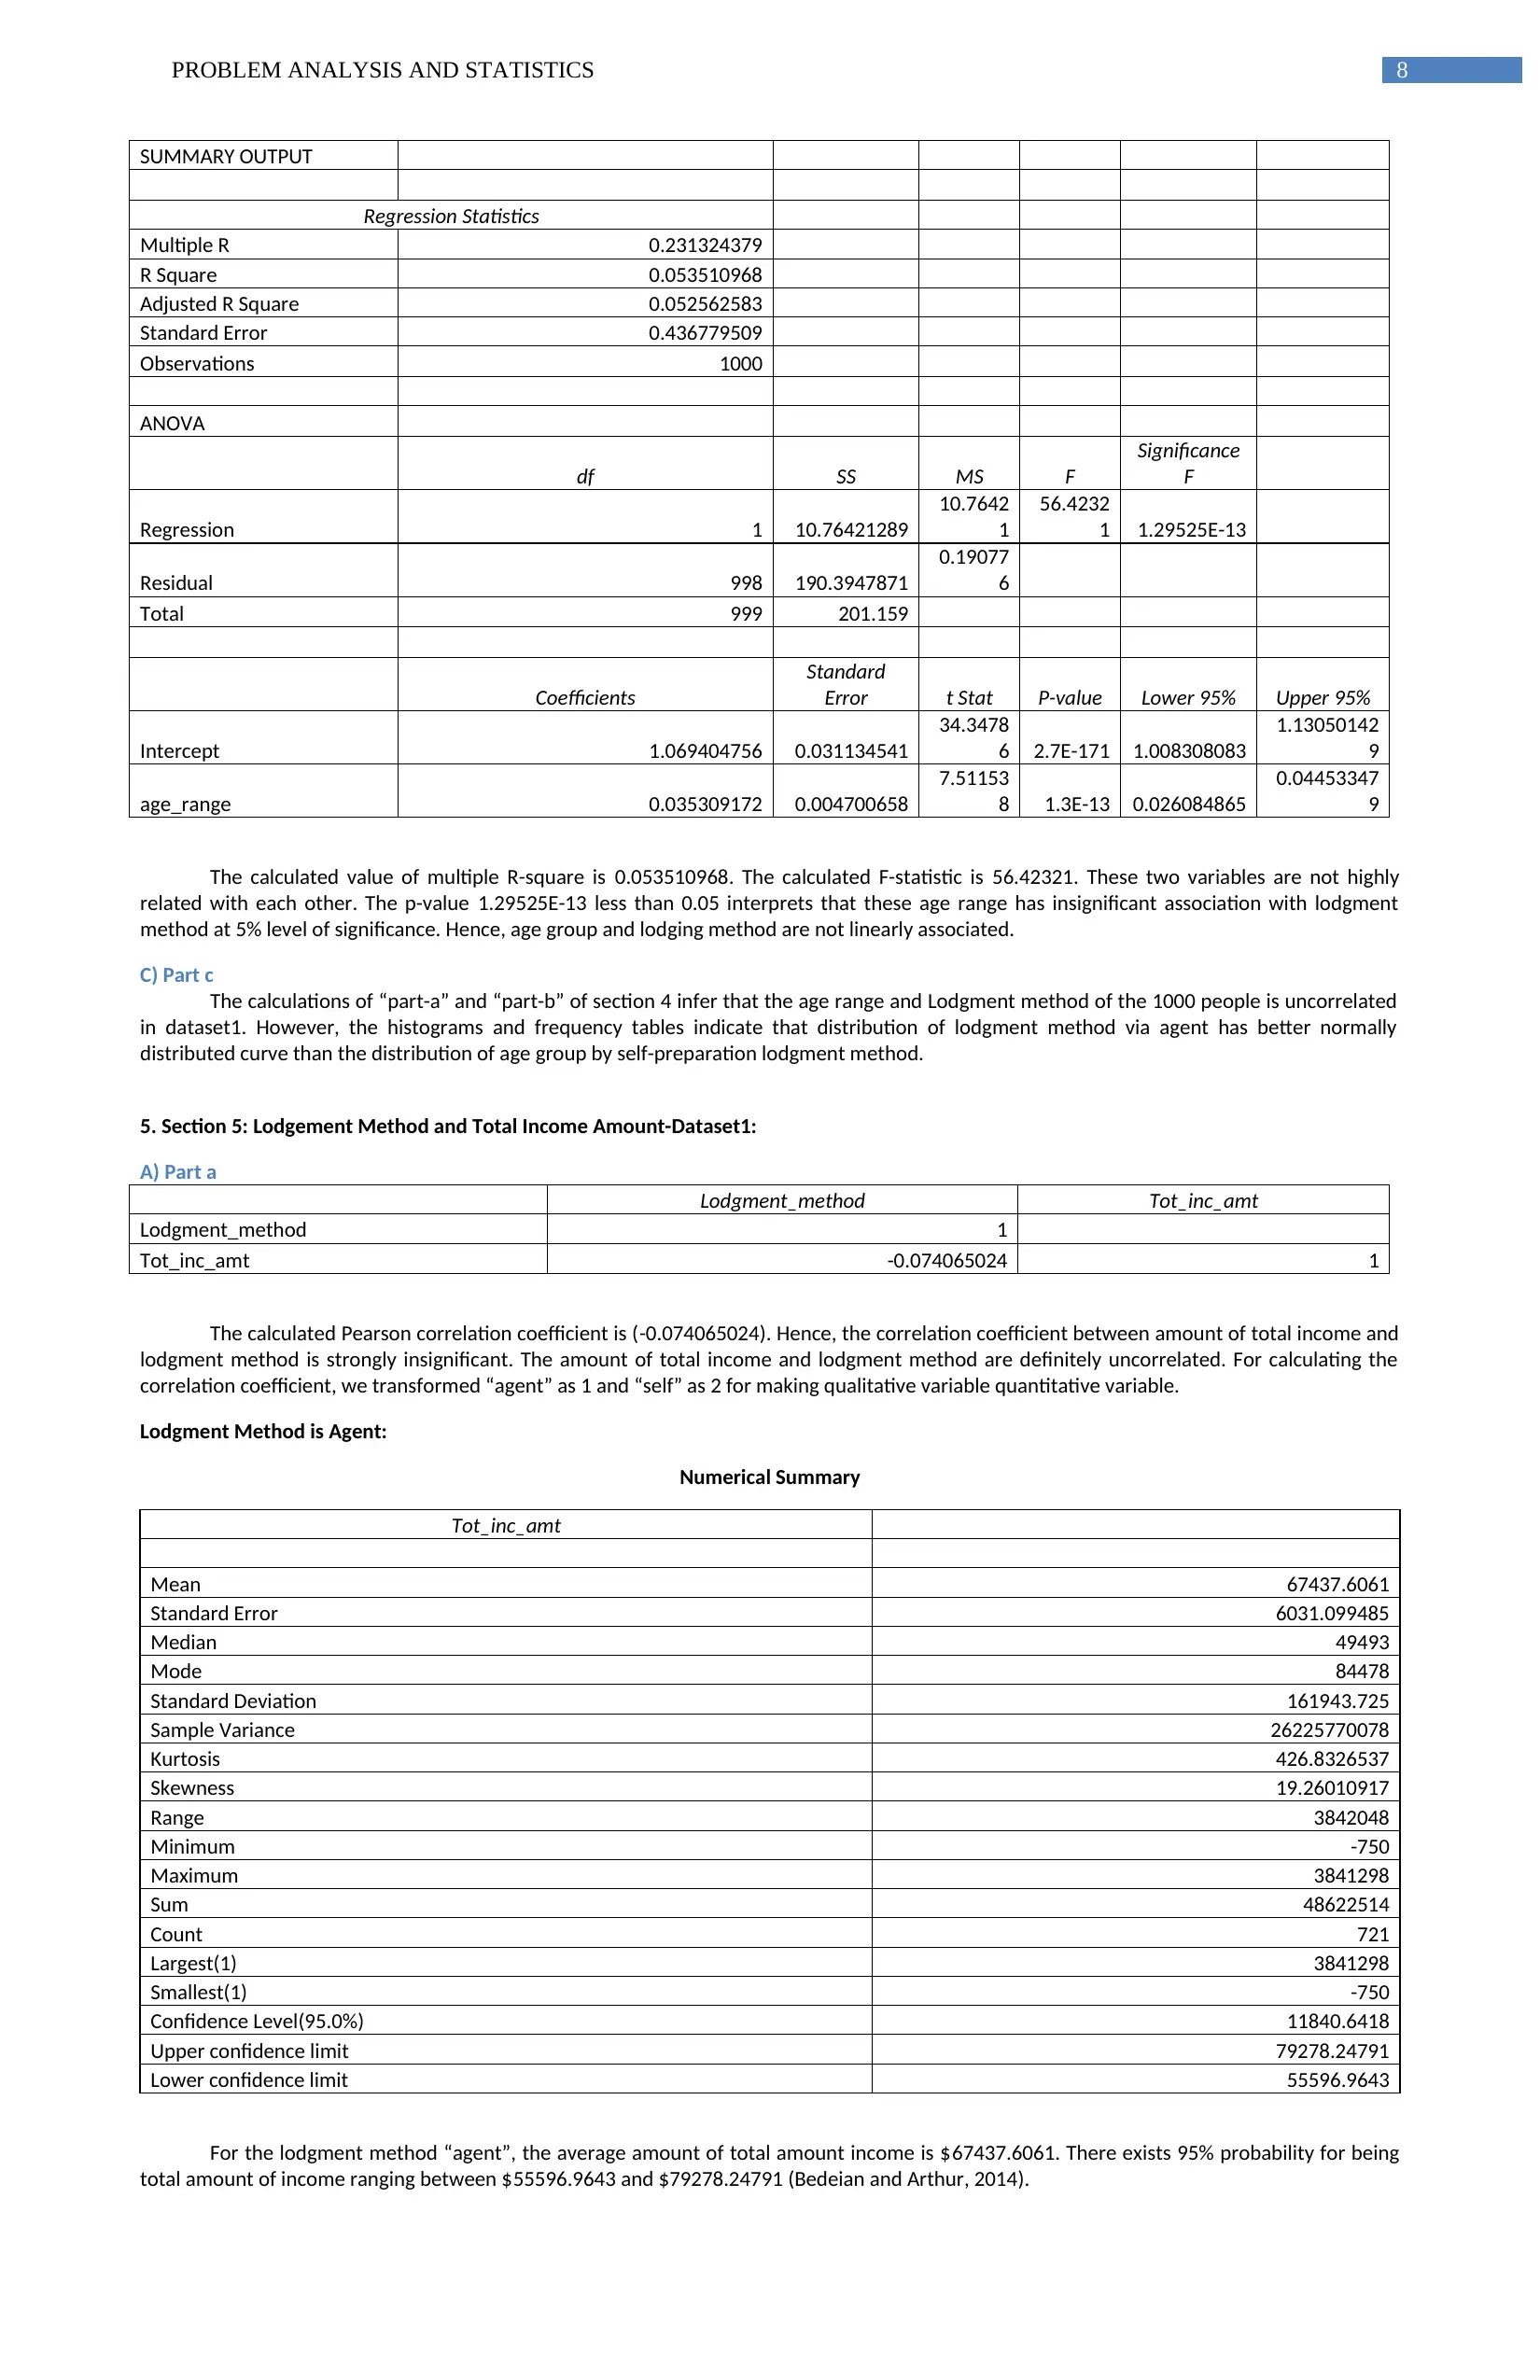
SUMMARY OUTPUT
Regression Statistics
Multiple R 0.231324379
R Square 0.053510968
Adjusted R Square 0.052562583
Standard Error 0.436779509
Observations 1000
ANOVA
df SS MS F
Significance
F
Regression 1 10.76421289
10.7642
1
56.4232
1 1.29525E-13
Residual 998 190.3947871
0.19077
6
Total 999 201.159
Coefficients
Standard
Error t Stat P-value Lower 95% Upper 95%
Intercept 1.069404756 0.031134541
34.3478
6 2.7E-171 1.008308083
1.13050142
9
age_range 0.035309172 0.004700658
7.51153
8 1.3E-13 0.026084865
0.04453347
9
The calculated value of multiple R-square is 0.053510968. The calculated F-statistic is 56.42321. These two variables are not highly
related with each other. The p-value 1.29525E-13 less than 0.05 interprets that these age range has insignificant association with lodgment
method at 5% level of significance. Hence, age group and lodging method are not linearly associated.
C) Part c
The calculations of “part-a” and “part-b” of section 4 infer that the age range and Lodgment method of the 1000 people is uncorrelated
in dataset1. However, the histograms and frequency tables indicate that distribution of lodgment method via agent has better normally
distributed curve than the distribution of age group by self-preparation lodgment method.
5. Section 5: Lodgement Method and Total Income Amount-Dataset1:
A) Part a
Lodgment_method Tot_inc_amt
Lodgment_method 1
Tot_inc_amt -0.074065024 1
The calculated Pearson correlation coefficient is (-0.074065024). Hence, the correlation coefficient between amount of total income and
lodgment method is strongly insignificant. The amount of total income and lodgment method are definitely uncorrelated. For calculating the
correlation coefficient, we transformed “agent” as 1 and “self” as 2 for making qualitative variable quantitative variable.
Lodgment Method is Agent:
Numerical Summary
Tot_inc_amt
Mean 67437.6061
Standard Error 6031.099485
Median 49493
Mode 84478
Standard Deviation 161943.725
Sample Variance 26225770078
Kurtosis 426.8326537
Skewness 19.26010917
Range 3842048
Minimum -750
Maximum 3841298
Sum 48622514
Count 721
Largest(1) 3841298
Smallest(1) -750
Confidence Level(95.0%) 11840.6418
Upper confidence limit 79278.24791
Lower confidence limit 55596.9643
For the lodgment method “agent”, the average amount of total amount income is $67437.6061. There exists 95% probability for being
total amount of income ranging between $55596.9643 and $79278.24791 (Bedeian and Arthur, 2014).
⊘ This is a preview!⊘
Do you want full access?
Subscribe today to unlock all pages.
Trusted by 1+ million students worldwide
9PROBLEM ANALYSIS AND STATISTICS
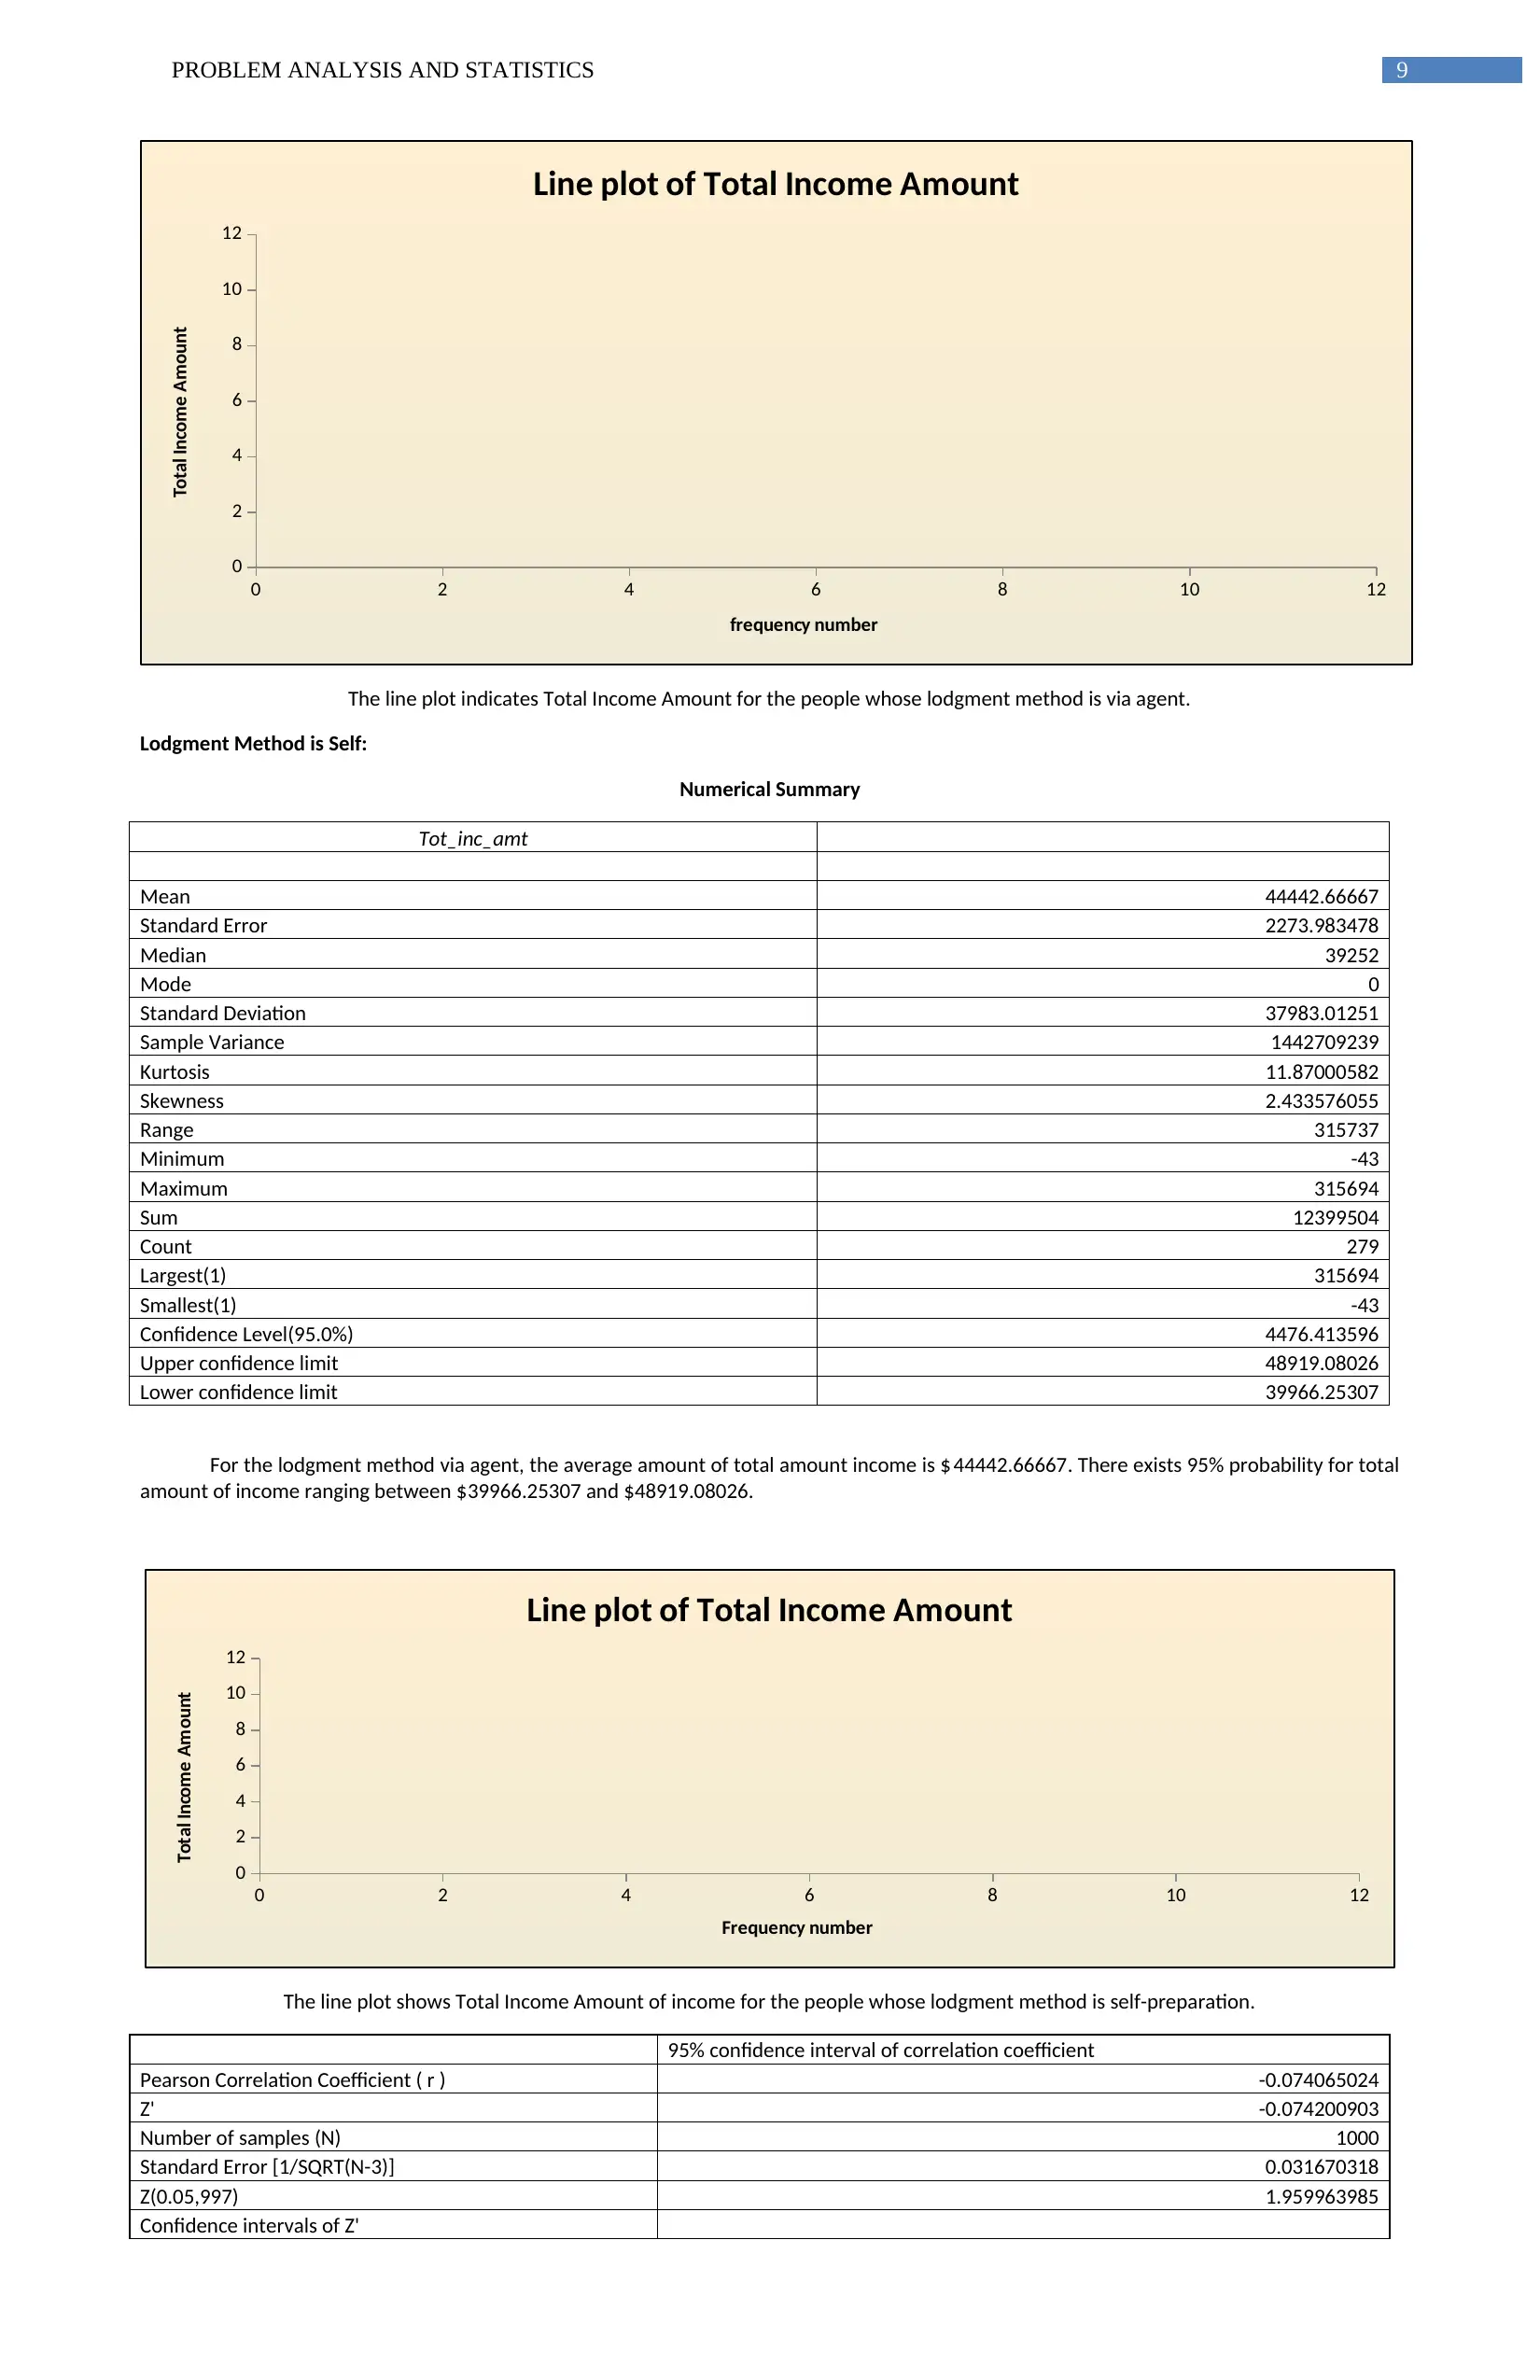
0 2 4 6 8 10 12
0
2
4
6
8
10
12
Line plot of Total Income Amount
frequency number
Total Income Amount
The line plot indicates Total Income Amount for the people whose lodgment method is via agent.
Lodgment Method is Self:
Numerical Summary
Tot_inc_amt
Mean 44442.66667
Standard Error 2273.983478
Median 39252
Mode 0
Standard Deviation 37983.01251
Sample Variance 1442709239
Kurtosis 11.87000582
Skewness 2.433576055
Range 315737
Minimum -43
Maximum 315694
Sum 12399504
Count 279
Largest(1) 315694
Smallest(1) -43
Confidence Level(95.0%) 4476.413596
Upper confidence limit 48919.08026
Lower confidence limit 39966.25307
For the lodgment method via agent, the average amount of total amount income is $ 44442.66667. There exists 95% probability for total
amount of income ranging between $39966.25307 and $48919.08026.
0 2 4 6 8 10 12
0
2
4
6
8
10
12
Line plot of Total Income Amount
Frequency number
Total Income Amount
The line plot shows Total Income Amount of income for the people whose lodgment method is self-preparation.
95% confidence interval of correlation coefficient
Pearson Correlation Coefficient ( r ) -0.074065024
Z' -0.074200903
Number of samples (N) 1000
Standard Error [1/SQRT(N-3)] 0.031670318
Z(0.05,997) 1.959963985
Confidence intervals of Z'
0 2 4 6 8 10 12
0
2
4
6
8
10
12
Line plot of Total Income Amount
frequency number
Total Income Amount
The line plot indicates Total Income Amount for the people whose lodgment method is via agent.
Lodgment Method is Self:
Numerical Summary
Tot_inc_amt
Mean 44442.66667
Standard Error 2273.983478
Median 39252
Mode 0
Standard Deviation 37983.01251
Sample Variance 1442709239
Kurtosis 11.87000582
Skewness 2.433576055
Range 315737
Minimum -43
Maximum 315694
Sum 12399504
Count 279
Largest(1) 315694
Smallest(1) -43
Confidence Level(95.0%) 4476.413596
Upper confidence limit 48919.08026
Lower confidence limit 39966.25307
For the lodgment method via agent, the average amount of total amount income is $ 44442.66667. There exists 95% probability for total
amount of income ranging between $39966.25307 and $48919.08026.
0 2 4 6 8 10 12
0
2
4
6
8
10
12
Line plot of Total Income Amount
Frequency number
Total Income Amount
The line plot shows Total Income Amount of income for the people whose lodgment method is self-preparation.
95% confidence interval of correlation coefficient
Pearson Correlation Coefficient ( r ) -0.074065024
Z' -0.074200903
Number of samples (N) 1000
Standard Error [1/SQRT(N-3)] 0.031670318
Z(0.05,997) 1.959963985
Confidence intervals of Z'
Paraphrase This Document
Need a fresh take? Get an instant paraphrase of this document with our AI Paraphraser
10PROBLEM ANALYSIS AND STATISTICS
Lower limit of Z' -0.136273585
Upper limit of Z' -0.01212822
Confidence intervals of r
Lower limit of r -0.135436248
Upper limit of r -0.012127626
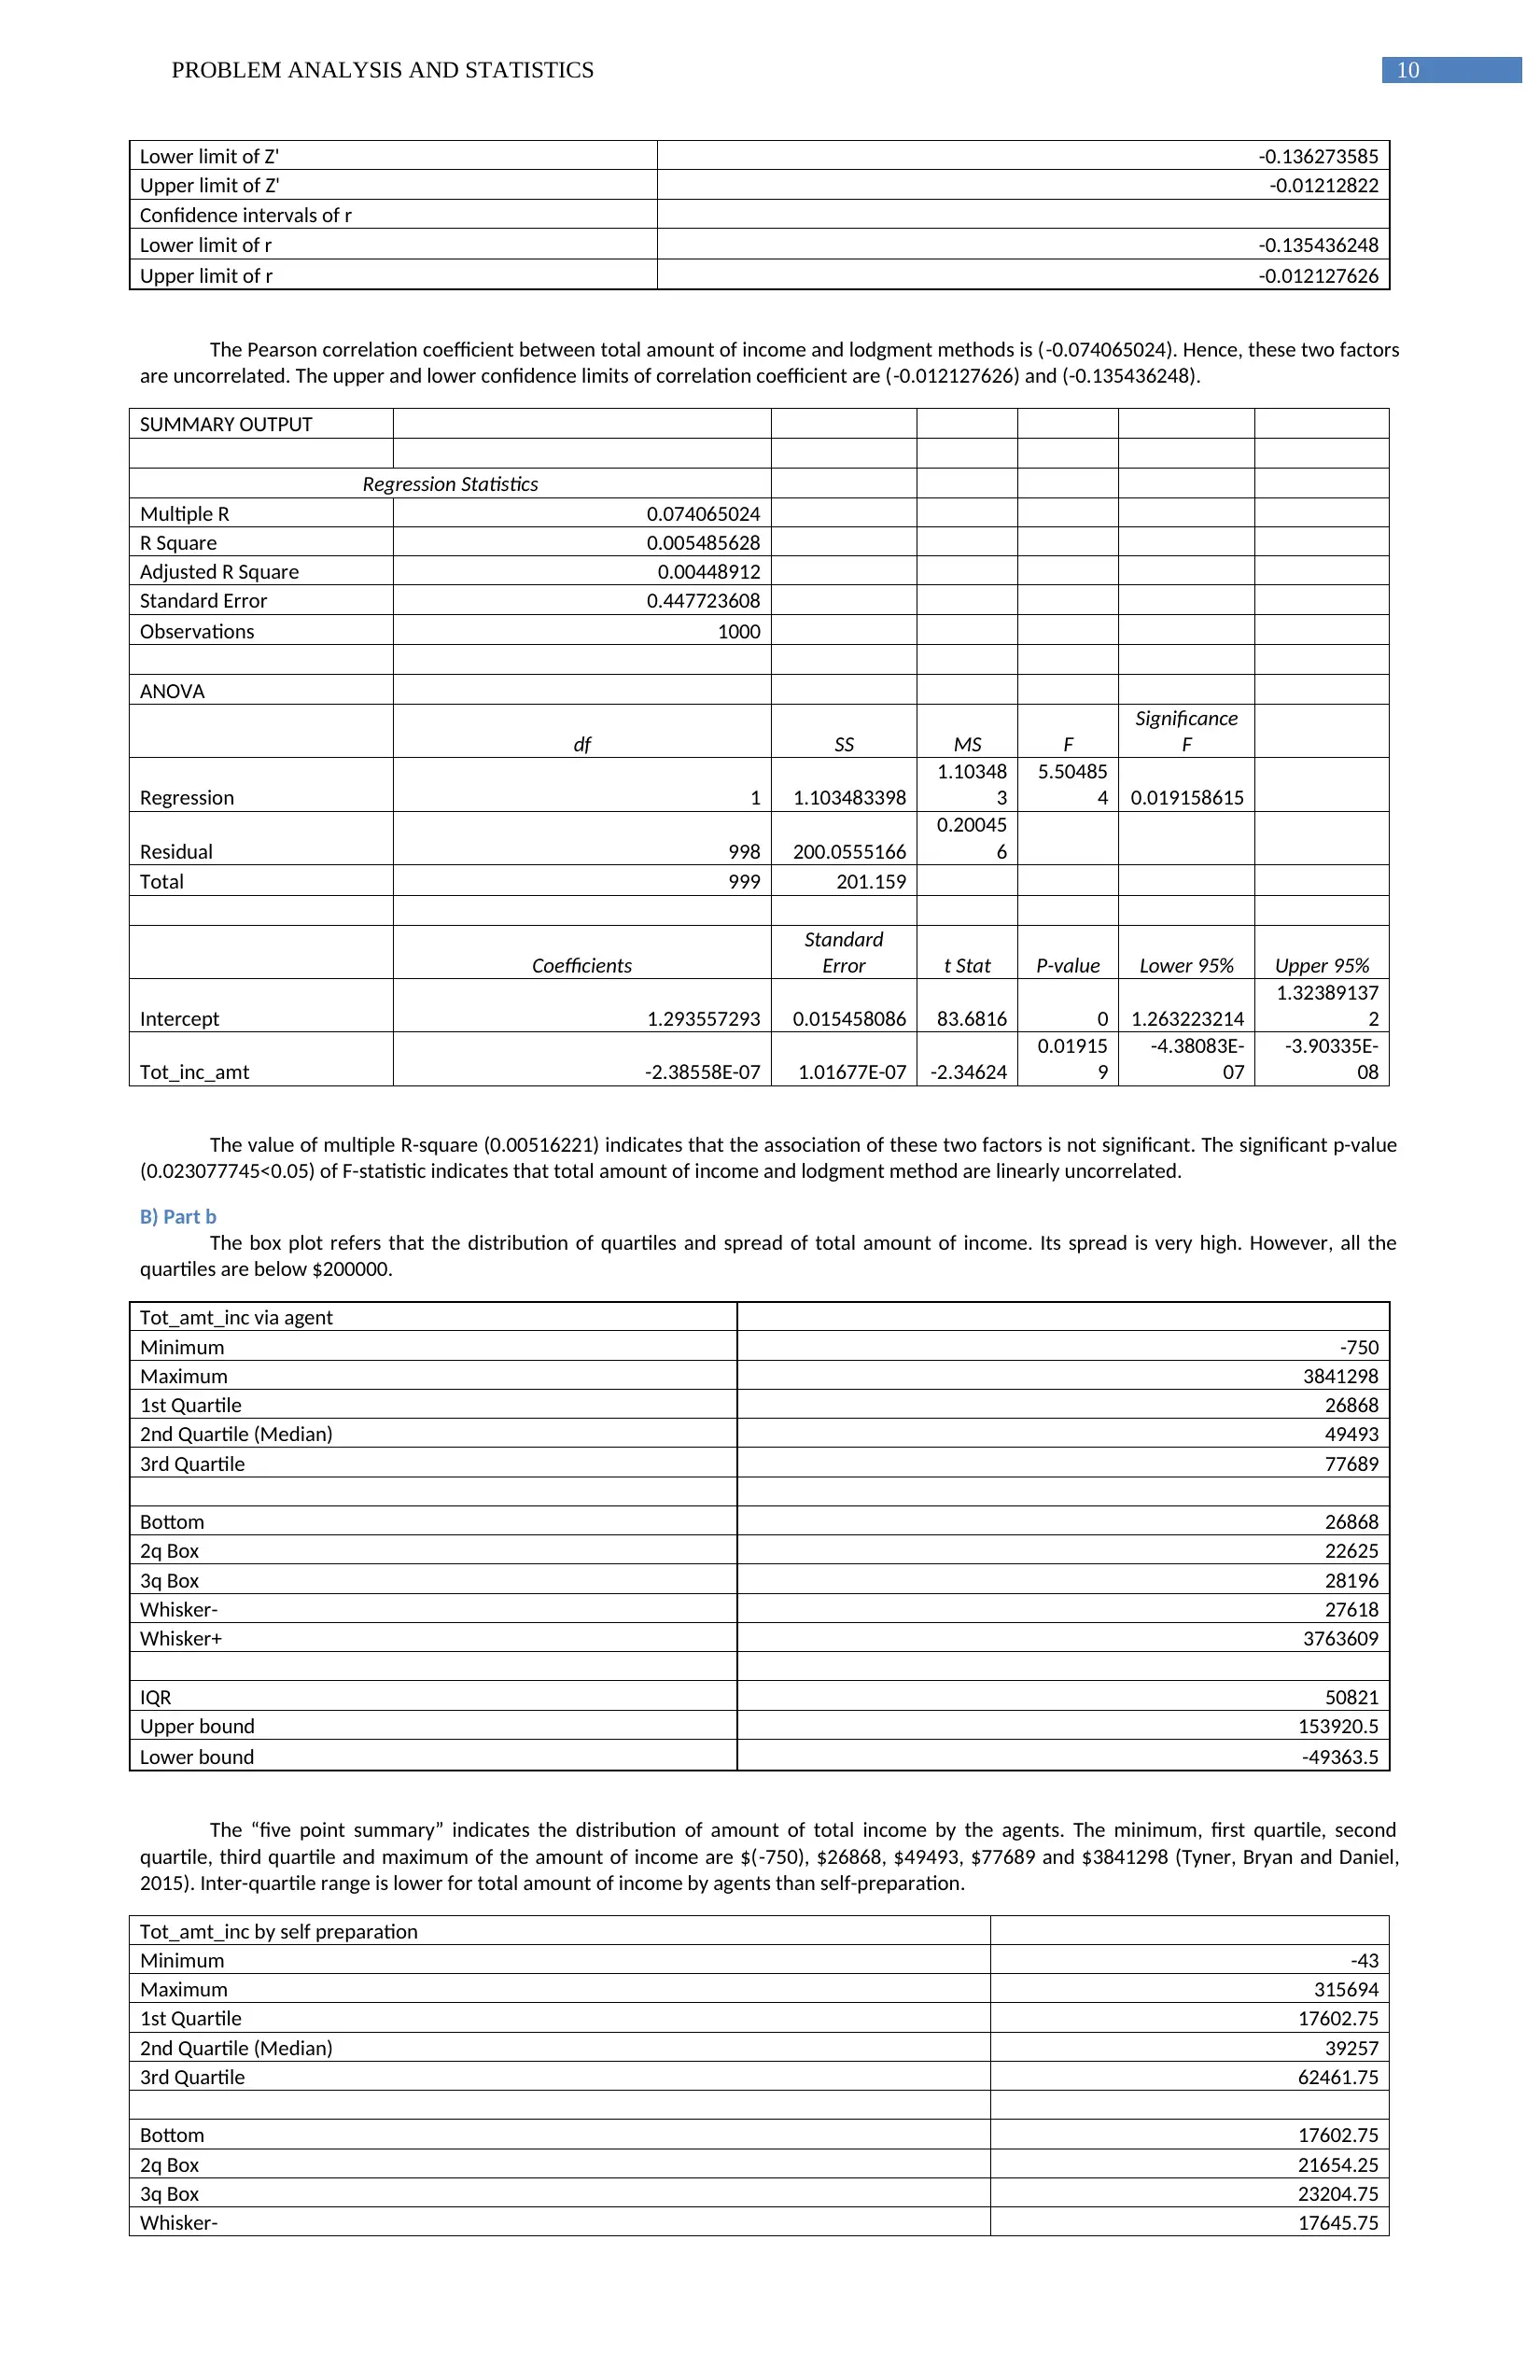
The Pearson correlation coefficient between total amount of income and lodgment methods is (-0.074065024). Hence, these two factors
are uncorrelated. The upper and lower confidence limits of correlation coefficient are (-0.012127626) and (-0.135436248).
SUMMARY OUTPUT
Regression Statistics
Multiple R 0.074065024
R Square 0.005485628
Adjusted R Square 0.00448912
Standard Error 0.447723608
Observations 1000
ANOVA
df SS MS F
Significance
F
Regression 1 1.103483398
1.10348
3
5.50485
4 0.019158615
Residual 998 200.0555166
0.20045
6
Total 999 201.159
Coefficients
Standard
Error t Stat P-value Lower 95% Upper 95%
Intercept 1.293557293 0.015458086 83.6816 0 1.263223214
1.32389137
2
Tot_inc_amt -2.38558E-07 1.01677E-07 -2.34624
0.01915
9
-4.38083E-
07
-3.90335E-
08
The value of multiple R-square (0.00516221) indicates that the association of these two factors is not significant. The significant p-value
(0.023077745<0.05) of F-statistic indicates that total amount of income and lodgment method are linearly uncorrelated.
B) Part b
The box plot refers that the distribution of quartiles and spread of total amount of income. Its spread is very high. However, all the
quartiles are below $200000.
Tot_amt_inc via agent
Minimum -750
Maximum 3841298
1st Quartile 26868
2nd Quartile (Median) 49493
3rd Quartile 77689
Bottom 26868
2q Box 22625
3q Box 28196
Whisker- 27618
Whisker+ 3763609
IQR 50821
Upper bound 153920.5
Lower bound -49363.5
The “five point summary” indicates the distribution of amount of total income by the agents. The minimum, first quartile, second
quartile, third quartile and maximum of the amount of income are $(-750), $26868, $49493, $77689 and $3841298 (Tyner, Bryan and Daniel,
2015). Inter-quartile range is lower for total amount of income by agents than self-preparation.
Tot_amt_inc by self preparation
Minimum -43
Maximum 315694
1st Quartile 17602.75
2nd Quartile (Median) 39257
3rd Quartile 62461.75
Bottom 17602.75
2q Box 21654.25
3q Box 23204.75
Whisker- 17645.75
Lower limit of Z' -0.136273585
Upper limit of Z' -0.01212822
Confidence intervals of r
Lower limit of r -0.135436248
Upper limit of r -0.012127626
The Pearson correlation coefficient between total amount of income and lodgment methods is (-0.074065024). Hence, these two factors
are uncorrelated. The upper and lower confidence limits of correlation coefficient are (-0.012127626) and (-0.135436248).
SUMMARY OUTPUT
Regression Statistics
Multiple R 0.074065024
R Square 0.005485628
Adjusted R Square 0.00448912
Standard Error 0.447723608
Observations 1000
ANOVA
df SS MS F
Significance
F
Regression 1 1.103483398
1.10348
3
5.50485
4 0.019158615
Residual 998 200.0555166
0.20045
6
Total 999 201.159
Coefficients
Standard
Error t Stat P-value Lower 95% Upper 95%
Intercept 1.293557293 0.015458086 83.6816 0 1.263223214
1.32389137
2
Tot_inc_amt -2.38558E-07 1.01677E-07 -2.34624
0.01915
9
-4.38083E-
07
-3.90335E-
08
The value of multiple R-square (0.00516221) indicates that the association of these two factors is not significant. The significant p-value
(0.023077745<0.05) of F-statistic indicates that total amount of income and lodgment method are linearly uncorrelated.
B) Part b
The box plot refers that the distribution of quartiles and spread of total amount of income. Its spread is very high. However, all the
quartiles are below $200000.
Tot_amt_inc via agent
Minimum -750
Maximum 3841298
1st Quartile 26868
2nd Quartile (Median) 49493
3rd Quartile 77689
Bottom 26868
2q Box 22625
3q Box 28196
Whisker- 27618
Whisker+ 3763609
IQR 50821
Upper bound 153920.5
Lower bound -49363.5
The “five point summary” indicates the distribution of amount of total income by the agents. The minimum, first quartile, second
quartile, third quartile and maximum of the amount of income are $(-750), $26868, $49493, $77689 and $3841298 (Tyner, Bryan and Daniel,
2015). Inter-quartile range is lower for total amount of income by agents than self-preparation.
Tot_amt_inc by self preparation
Minimum -43
Maximum 315694
1st Quartile 17602.75
2nd Quartile (Median) 39257
3rd Quartile 62461.75
Bottom 17602.75
2q Box 21654.25
3q Box 23204.75
Whisker- 17645.75
11PROBLEM ANALYSIS AND STATISTICS
Whisker+ 253232.25
IQR 44859
Upper bound 129750.25
Lower bound -49685.75
The “five point summary” indicates the distribution of amount of total income by self-preparation. The minimum, first quartile, second
quartile, third quartile and maximum of the amount of income are $(-43), $17602.75, $39257, $62461.75 and $315694. Inter-quartile range is
higher for total amount of income by self-preparation.
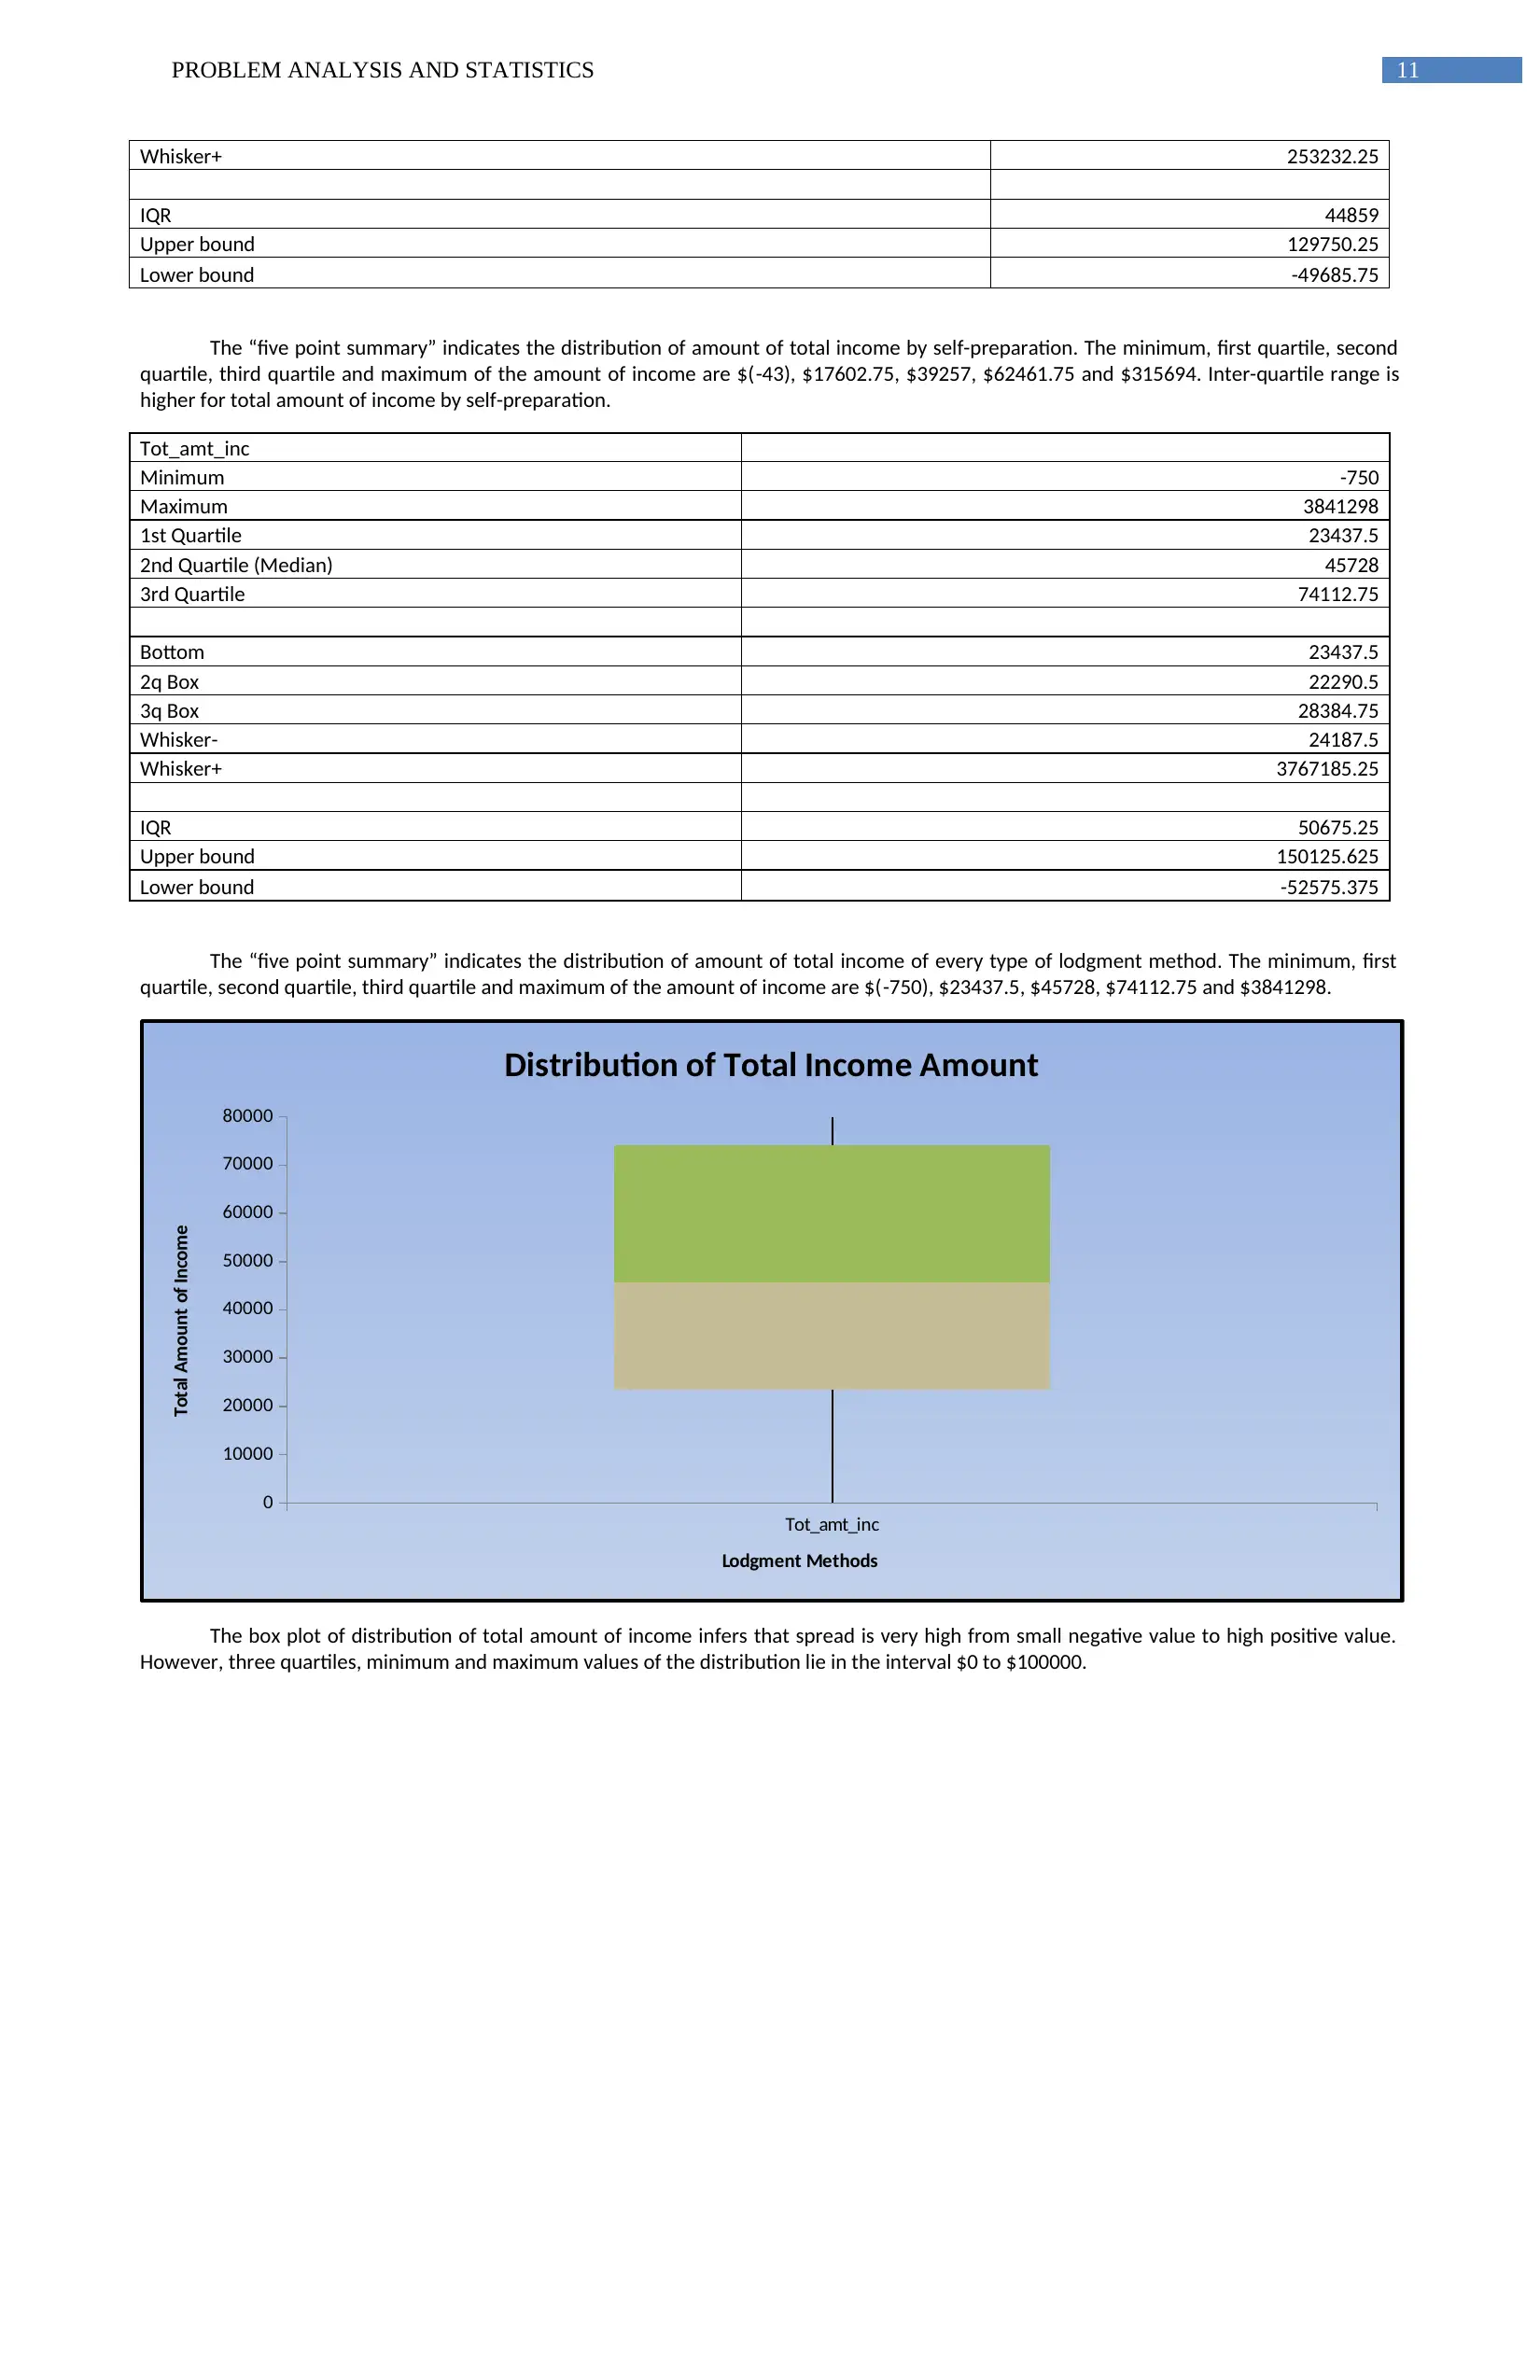
Tot_amt_inc
Minimum -750
Maximum 3841298
1st Quartile 23437.5
2nd Quartile (Median) 45728
3rd Quartile 74112.75
Bottom 23437.5
2q Box 22290.5
3q Box 28384.75
Whisker- 24187.5
Whisker+ 3767185.25
IQR 50675.25
Upper bound 150125.625
Lower bound -52575.375
The “five point summary” indicates the distribution of amount of total income of every type of lodgment method. The minimum, first
quartile, second quartile, third quartile and maximum of the amount of income are $(-750), $23437.5, $45728, $74112.75 and $3841298.
Tot_amt_inc
0
10000
20000
30000
40000
50000
60000
70000
80000
Distribution of Total Income Amount
Lodgment Methods
Total Amount of Income
The box plot of distribution of total amount of income infers that spread is very high from small negative value to high positive value.
However, three quartiles, minimum and maximum values of the distribution lie in the interval $0 to $100000.
Whisker+ 253232.25
IQR 44859
Upper bound 129750.25
Lower bound -49685.75
The “five point summary” indicates the distribution of amount of total income by self-preparation. The minimum, first quartile, second
quartile, third quartile and maximum of the amount of income are $(-43), $17602.75, $39257, $62461.75 and $315694. Inter-quartile range is
higher for total amount of income by self-preparation.
Tot_amt_inc
Minimum -750
Maximum 3841298
1st Quartile 23437.5
2nd Quartile (Median) 45728
3rd Quartile 74112.75
Bottom 23437.5
2q Box 22290.5
3q Box 28384.75
Whisker- 24187.5
Whisker+ 3767185.25
IQR 50675.25
Upper bound 150125.625
Lower bound -52575.375
The “five point summary” indicates the distribution of amount of total income of every type of lodgment method. The minimum, first
quartile, second quartile, third quartile and maximum of the amount of income are $(-750), $23437.5, $45728, $74112.75 and $3841298.
Tot_amt_inc
0
10000
20000
30000
40000
50000
60000
70000
80000
Distribution of Total Income Amount
Lodgment Methods
Total Amount of Income
The box plot of distribution of total amount of income infers that spread is very high from small negative value to high positive value.
However, three quartiles, minimum and maximum values of the distribution lie in the interval $0 to $100000.
⊘ This is a preview!⊘
Do you want full access?
Subscribe today to unlock all pages.
Trusted by 1+ million students worldwide
1 out of 35
Related Documents


Your All-in-One AI-Powered Toolkit for Academic Success.
+13062052269
info@desklib.com
Available 24*7 on WhatsApp / Email
![[object Object]](/_next/static/media/star-bottom.7253800d.svg)
Unlock your academic potential
Copyright © 2020–2026 A2Z Services. All Rights Reserved. Developed and managed by ZUCOL.