Fundamentals of Finance Group Project: TCS & Infosys Analysis
VerifiedAdded on 2023/01/06
|57
|6863
|22
Project
AI Summary
This finance project analyzes the financial performance of Tata Consultancy Services (TCS) and Infosys. The project utilizes ratio analysis, including liquidity, leverage, activity, profitability, and market ratios, calculated over a five-year period. The DuPont framework is employed to evaluate profitability drivers. The analysis includes horizontal, vertical, and trend analysis of key financial statement items. The project culminates in providing specific recommendations for various stakeholders, including creditors, banks, financial institutions, investors, the government, and company management, based on the findings of the financial analysis. The report focuses on interpreting the calculated ratios and comparing the performance of both companies, providing valuable insights into their financial health and strategic positioning. The project also includes an analysis of market ratios such as P/B and P/E ratio for both the companies and suggests whether the stocks are overvalued or undervalued.
Fundamentals of Finance
Group Project
Faculty in Charge: Prof. Shalini Kalra Sahi
Presented By:
IB-A, Group 8
Anshuman Mishra 21PGIB010
Arshnoor Singh 21PGIB012
G Chandra Sekhar 21PGIB030
Gaurav Kumar Jha 21PGIB032
Kritesh Kaushal 21PGIB044
Mayanka Soni 21PGIB052
Companies selected for Analysis:
Group Project
Faculty in Charge: Prof. Shalini Kalra Sahi
Presented By:
IB-A, Group 8
Anshuman Mishra 21PGIB010
Arshnoor Singh 21PGIB012
G Chandra Sekhar 21PGIB030
Gaurav Kumar Jha 21PGIB032
Kritesh Kaushal 21PGIB044
Mayanka Soni 21PGIB052
Companies selected for Analysis:
Paraphrase This Document
Need a fresh take? Get an instant paraphrase of this document with our AI Paraphraser
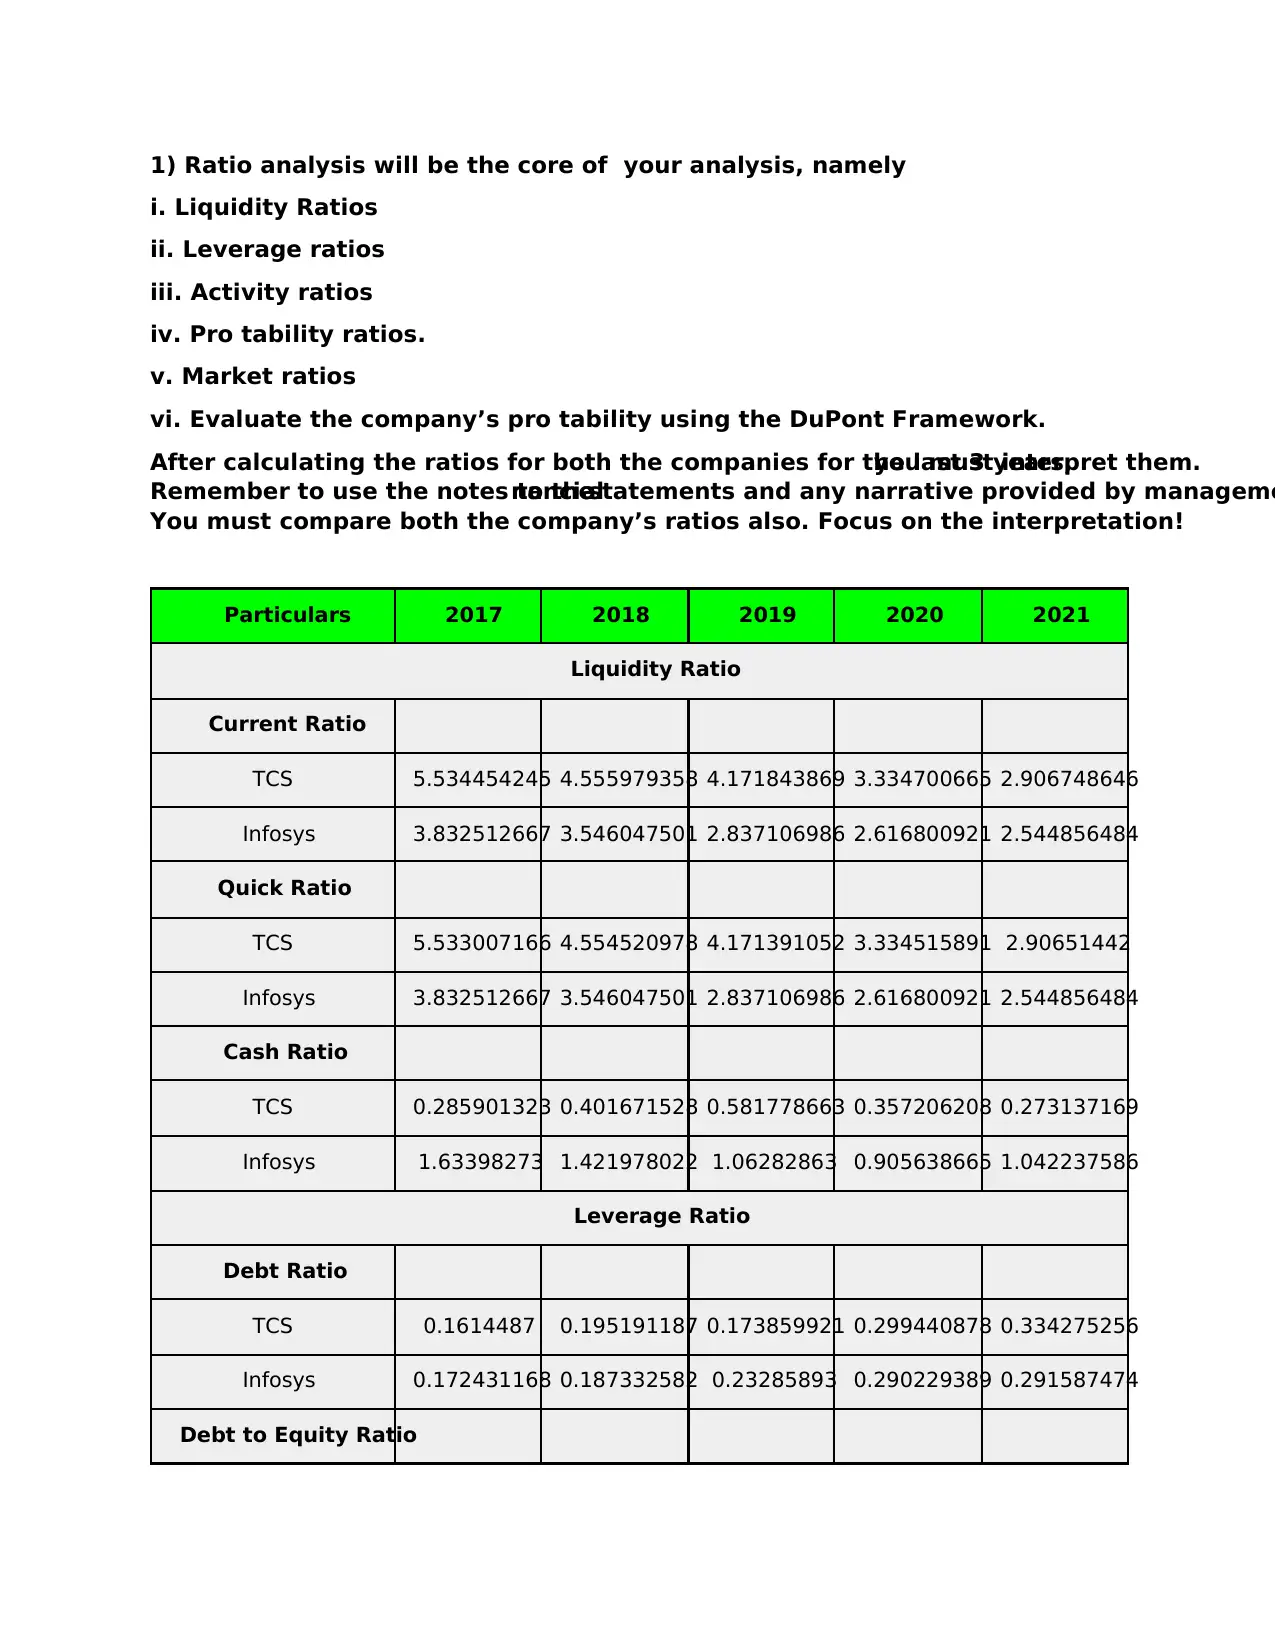
1) Ratio analysis will be the core of your analysis, namely
i. Liquidity Ratios
ii. Leverage ratios
iii. Activity ratios
iv. Pro tability ratios.
v. Market ratios
vi. Evaluate the company’s pro tability using the DuPont Framework.
After calculating the ratios for both the companies for the last 3 years,you must interpret them.
Remember to use the notes to thenancialstatements and any narrative provided by manageme
You must compare both the company’s ratios also. Focus on the interpretation!
Particulars 2017 2018 2019 2020 2021
Liquidity Ratio
Current Ratio
TCS 5.534454245 4.555979358 4.171843869 3.334700665 2.906748646
Infosys 3.832512667 3.546047501 2.837106986 2.616800921 2.544856484
Quick Ratio
TCS 5.533007166 4.554520978 4.171391052 3.334515891 2.90651442
Infosys 3.832512667 3.546047501 2.837106986 2.616800921 2.544856484
Cash Ratio
TCS 0.285901323 0.401671528 0.581778663 0.357206208 0.273137169
Infosys 1.63398273 1.421978022 1.06282863 0.905638665 1.042237586
Leverage Ratio
Debt Ratio
TCS 0.1614487 0.195191187 0.173859921 0.299440878 0.334275256
Infosys 0.172431168 0.187332582 0.23285893 0.290229389 0.291587474
Debt to Equity Ratio
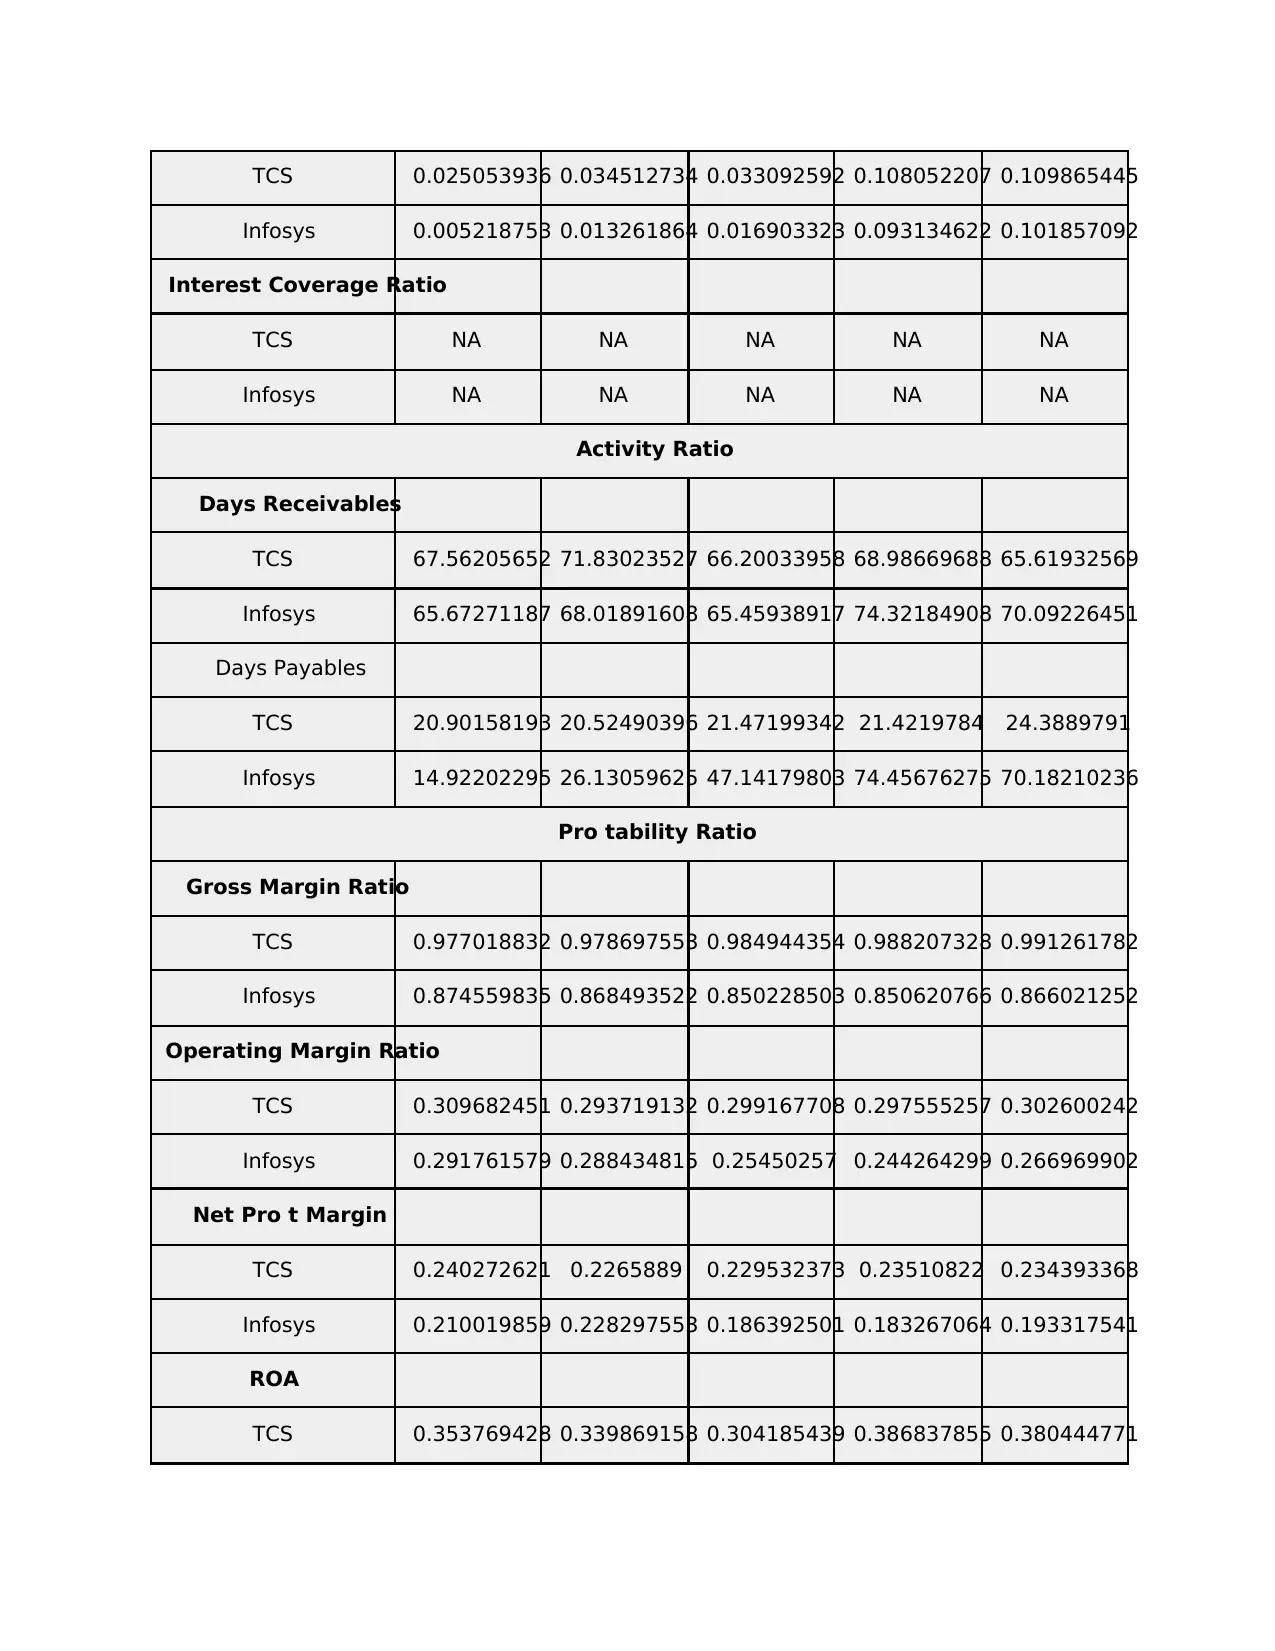
TCS 0.025053936 0.034512734 0.033092592 0.108052207 0.109865445
Infosys 0.005218753 0.013261864 0.016903323 0.093134622 0.101857092
Interest Coverage Ratio
TCS NA NA NA NA NA
Infosys NA NA NA NA NA
Activity Ratio
Days Receivables
TCS 67.56205652 71.83023527 66.20033958 68.98669688 65.61932569
Infosys 65.67271187 68.01891608 65.45938917 74.32184908 70.09226451
Days Payables
TCS 20.90158193 20.52490396 21.47199342 21.4219784 24.3889791
Infosys 14.92202295 26.13059625 47.14179803 74.45676275 70.18210236
Pro tability Ratio
Gross Margin Ratio
TCS 0.977018832 0.978697553 0.984944354 0.988207328 0.991261782
Infosys 0.874559835 0.868493522 0.850228503 0.850620766 0.866021252
Operating Margin Ratio
TCS 0.309682451 0.293719132 0.299167708 0.297555257 0.302600242
Infosys 0.291761579 0.288434815 0.25450257 0.244264299 0.266969902
Net Pro t Margin
TCS 0.240272621 0.2265889 0.229532373 0.23510822 0.234393368
Infosys 0.210019859 0.228297553 0.186392501 0.183267064 0.193317541
ROA
TCS 0.353769428 0.339869158 0.304185439 0.386837855 0.380444771
⊘ This is a preview!⊘
Do you want full access?
Subscribe today to unlock all pages.
Trusted by 1+ million students worldwide
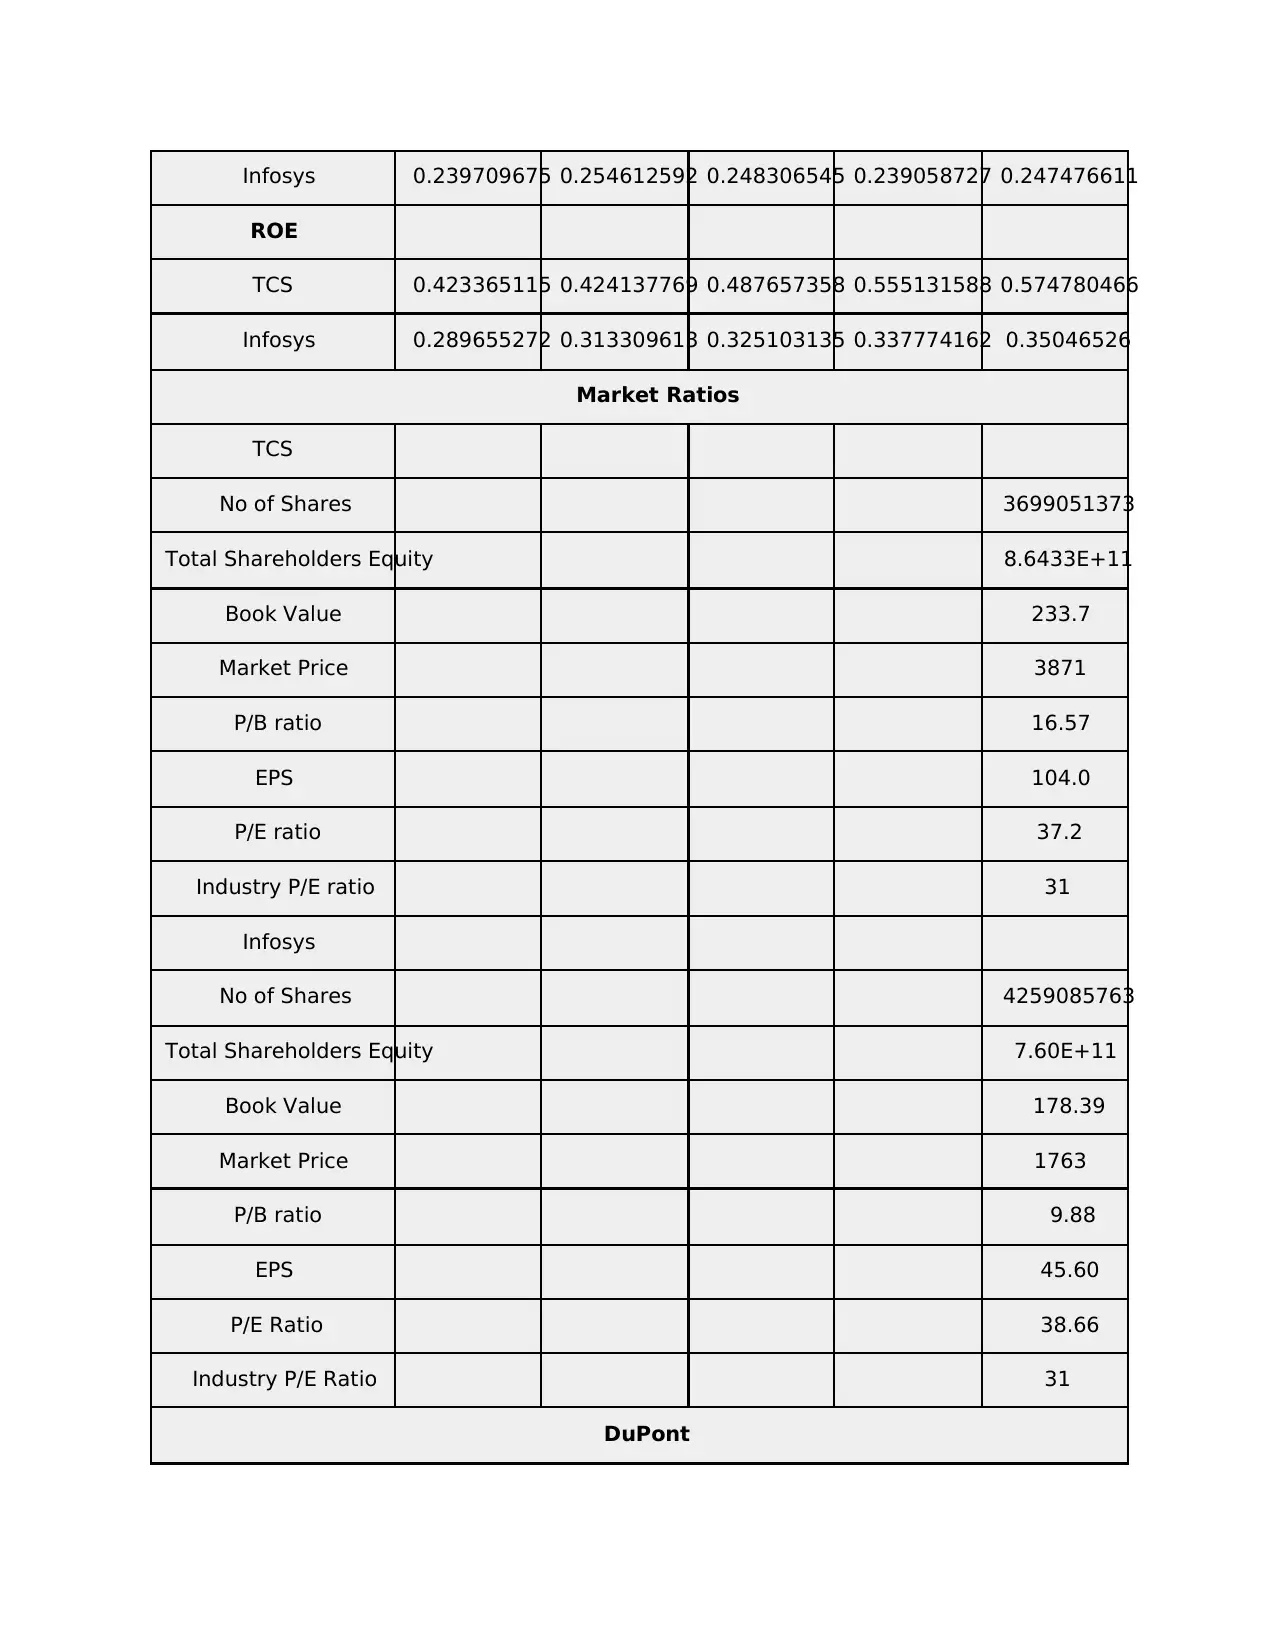
Infosys 0.239709675 0.254612592 0.248306545 0.239058727 0.247476611
ROE
TCS 0.423365115 0.424137769 0.487657358 0.555131588 0.574780466
Infosys 0.289655272 0.313309613 0.325103135 0.337774162 0.35046526
Market Ratios
TCS
No of Shares 3699051373
Total Shareholders Equity 8.6433E+11
Book Value 233.7
Market Price 3871
P/B ratio 16.57
EPS 104.0
P/E ratio 37.2
Industry P/E ratio 31
Infosys
No of Shares 4259085763
Total Shareholders Equity 7.60E+11
Book Value 178.39
Market Price 1763
P/B ratio 9.88
EPS 45.60
P/E Ratio 38.66
Industry P/E Ratio 31
DuPont
Paraphrase This Document
Need a fresh take? Get an instant paraphrase of this document with our AI Paraphraser
TCS
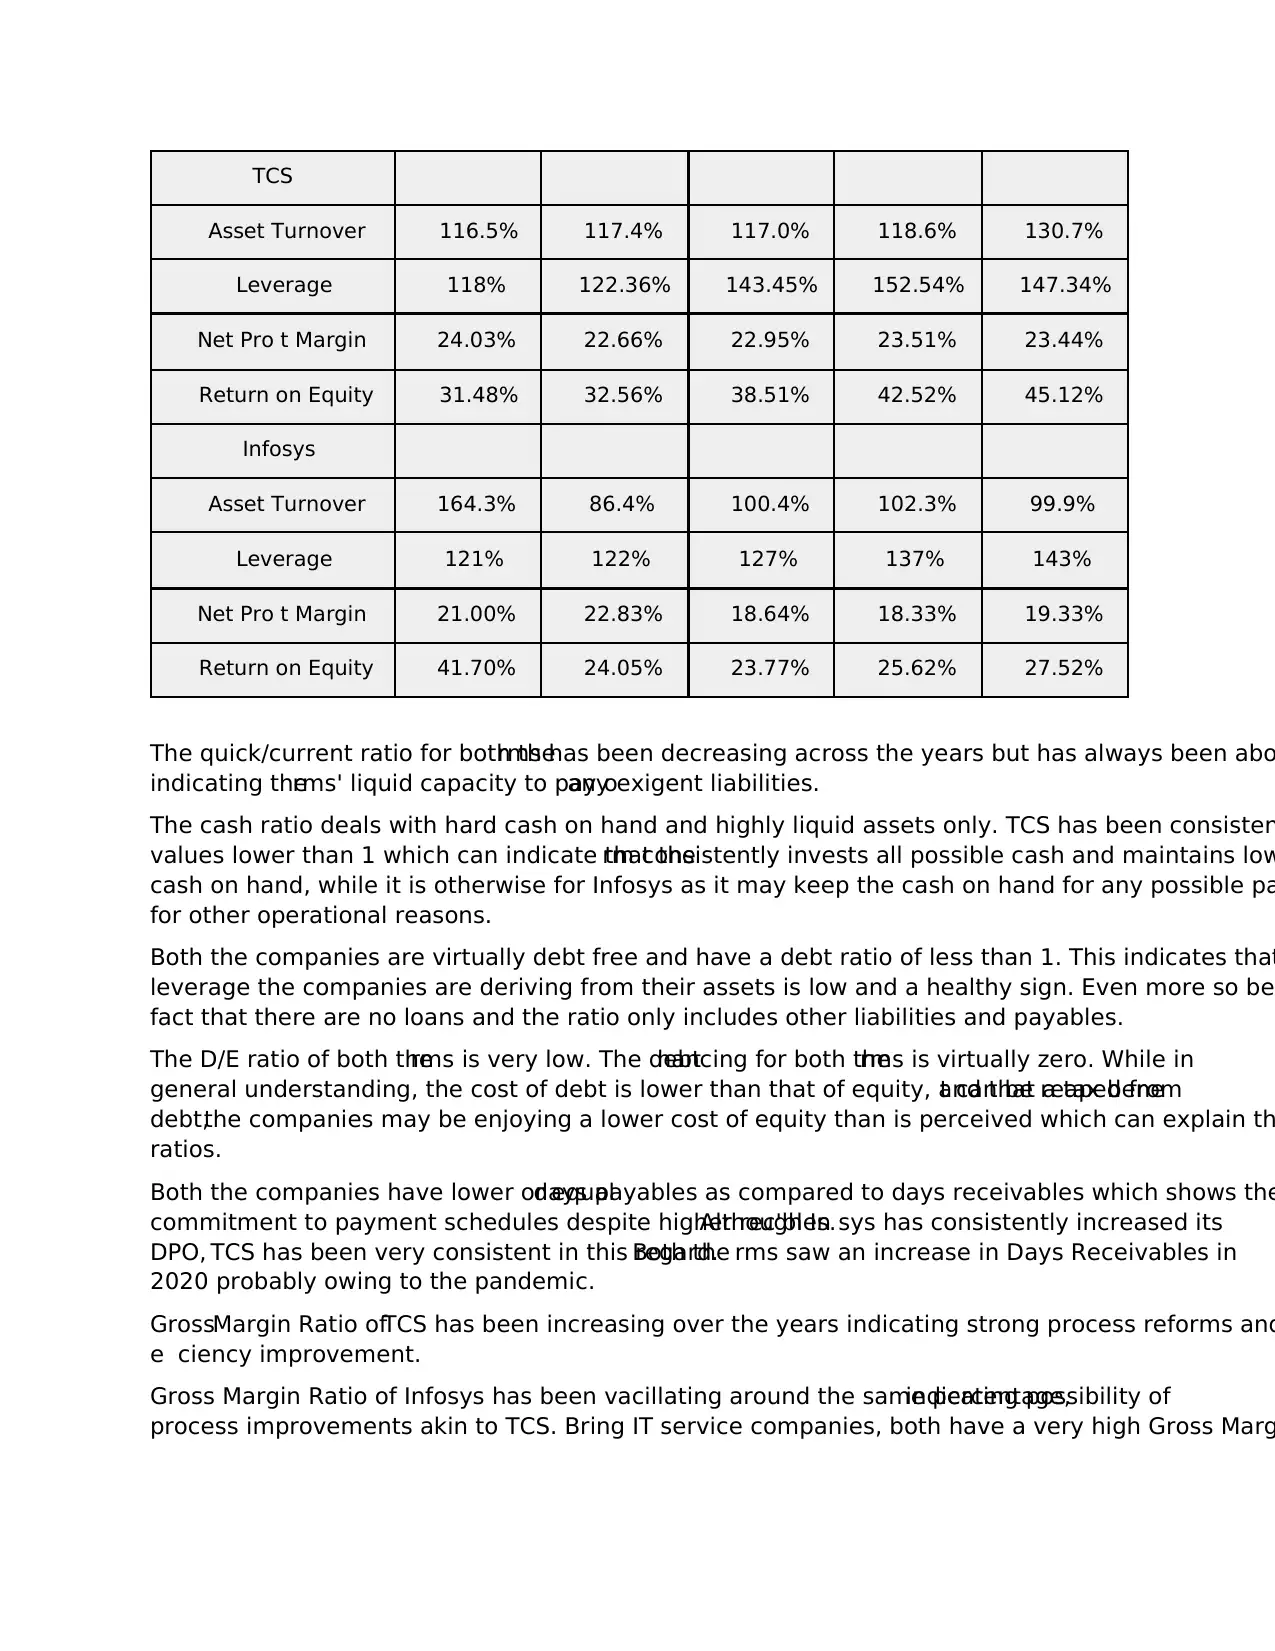
Asset Turnover 116.5% 117.4% 117.0% 118.6% 130.7%
Leverage 118% 122.36% 143.45% 152.54% 147.34%
Net Pro t Margin 24.03% 22.66% 22.95% 23.51% 23.44%
Return on Equity 31.48% 32.56% 38.51% 42.52% 45.12%
Infosys
Asset Turnover 164.3% 86.4% 100.4% 102.3% 99.9%
Leverage 121% 122% 127% 137% 143%
Net Pro t Margin 21.00% 22.83% 18.64% 18.33% 19.33%
Return on Equity 41.70% 24.05% 23.77% 25.62% 27.52%
The quick/current ratio for both therms has been decreasing across the years but has always been abo
indicating therms' liquid capacity to pay oany exigent liabilities.
The cash ratio deals with hard cash on hand and highly liquid assets only. TCS has been consisten
values lower than 1 which can indicate that therm consistently invests all possible cash and maintains low
cash on hand, while it is otherwise for Infosys as it may keep the cash on hand for any possible pa
for other operational reasons.
Both the companies are virtually debt free and have a debt ratio of less than 1. This indicates that
leverage the companies are deriving from their assets is low and a healthy sign. Even more so bec
fact that there are no loans and the ratio only includes other liabilities and payables.
The D/E ratio of both therms is very low. The debtnancing for both therms is virtually zero. While in
general understanding, the cost of debt is lower than that of equity, and that a tax benet can be reaped from
debt,the companies may be enjoying a lower cost of equity than is perceived which can explain th
ratios.
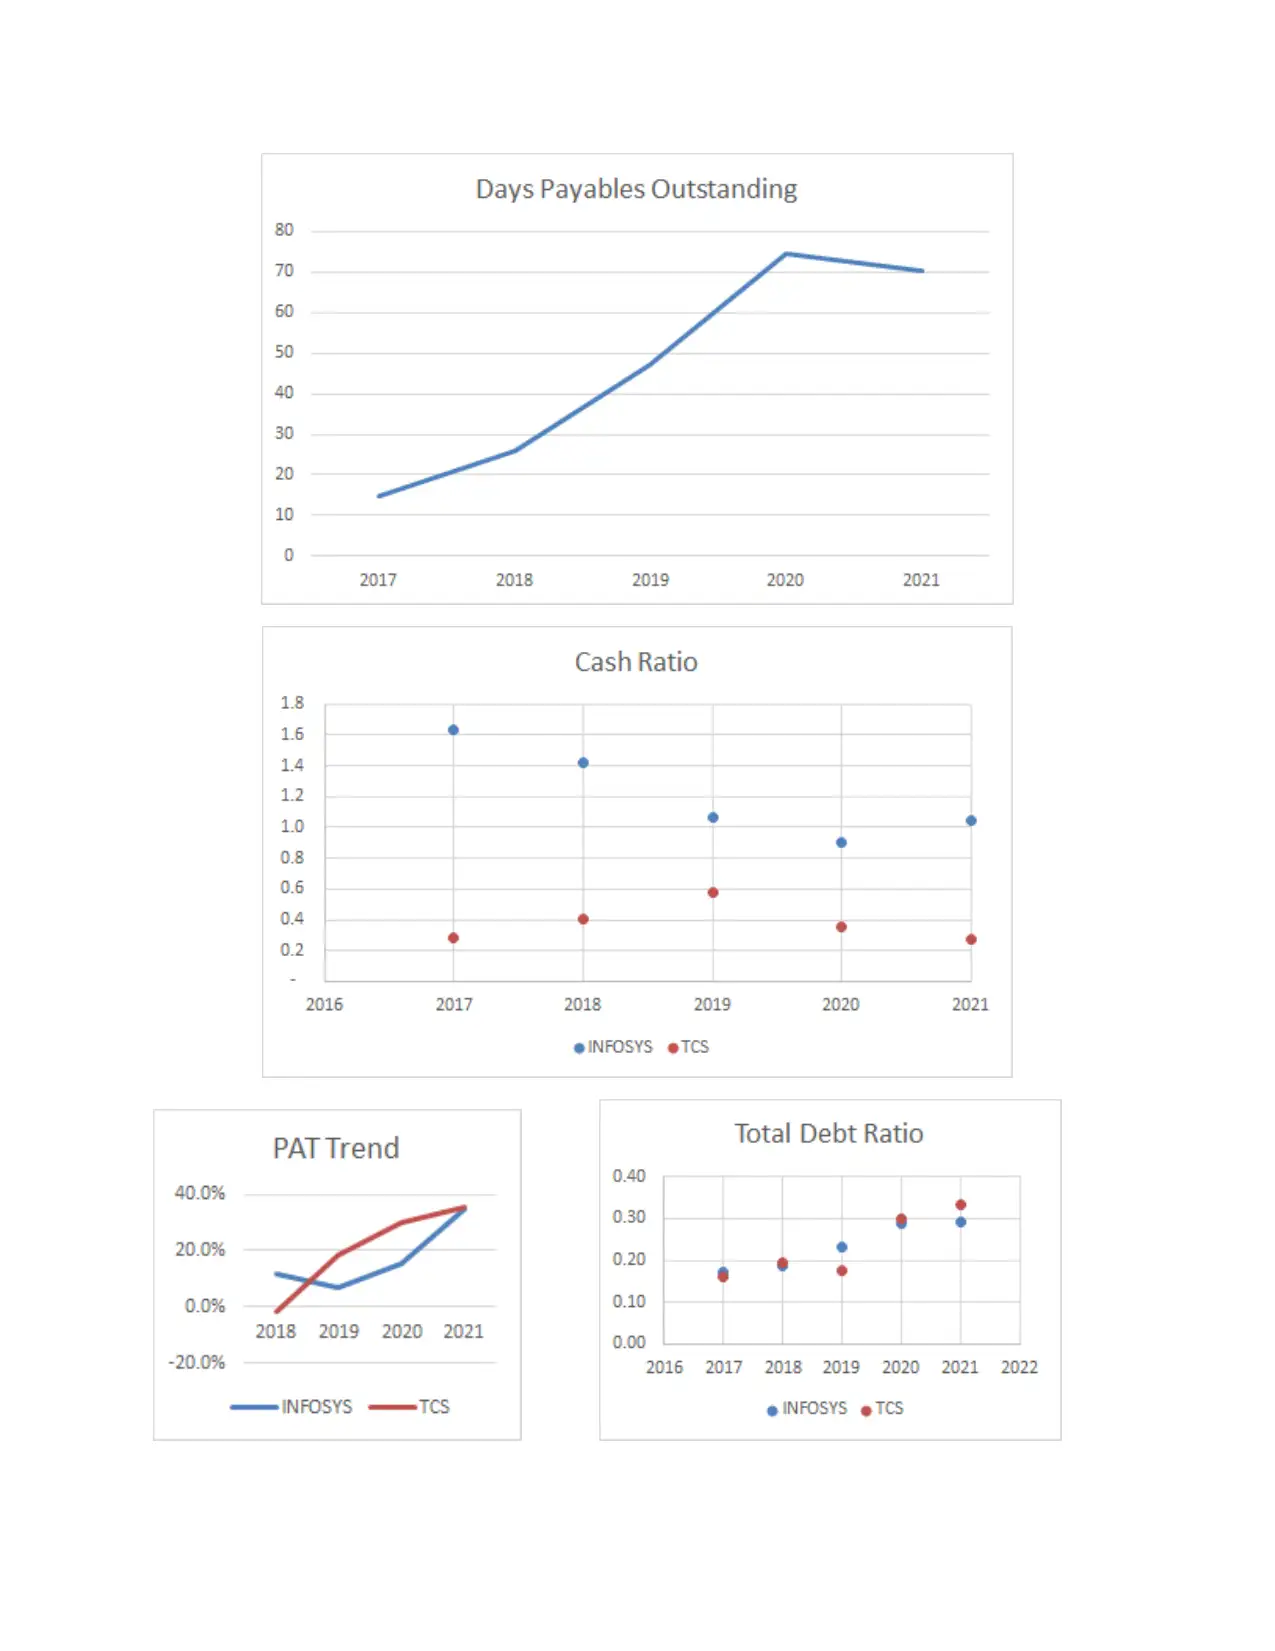
Both the companies have lower or equaldays payables as compared to days receivables which shows the
commitment to payment schedules despite higher rec'bles.Although In sys has consistently increased its
DPO, TCS has been very consistent in this regard.Both the rms saw an increase in Days Receivables in
2020 probably owing to the pandemic.
GrossMargin Ratio ofTCS has been increasing over the years indicating strong process reforms and
e ciency improvement.
Gross Margin Ratio of Infosys has been vacillating around the same percentage,indicating possibility of
process improvements akin to TCS. Bring IT service companies, both have a very high Gross Marg
Asset Turnover 116.5% 117.4% 117.0% 118.6% 130.7%
Leverage 118% 122.36% 143.45% 152.54% 147.34%
Net Pro t Margin 24.03% 22.66% 22.95% 23.51% 23.44%
Return on Equity 31.48% 32.56% 38.51% 42.52% 45.12%
Infosys
Asset Turnover 164.3% 86.4% 100.4% 102.3% 99.9%
Leverage 121% 122% 127% 137% 143%
Net Pro t Margin 21.00% 22.83% 18.64% 18.33% 19.33%
Return on Equity 41.70% 24.05% 23.77% 25.62% 27.52%
The quick/current ratio for both therms has been decreasing across the years but has always been abo
indicating therms' liquid capacity to pay oany exigent liabilities.
The cash ratio deals with hard cash on hand and highly liquid assets only. TCS has been consisten
values lower than 1 which can indicate that therm consistently invests all possible cash and maintains low
cash on hand, while it is otherwise for Infosys as it may keep the cash on hand for any possible pa
for other operational reasons.
Both the companies are virtually debt free and have a debt ratio of less than 1. This indicates that
leverage the companies are deriving from their assets is low and a healthy sign. Even more so bec
fact that there are no loans and the ratio only includes other liabilities and payables.
The D/E ratio of both therms is very low. The debtnancing for both therms is virtually zero. While in
general understanding, the cost of debt is lower than that of equity, and that a tax benet can be reaped from
debt,the companies may be enjoying a lower cost of equity than is perceived which can explain th
ratios.
Both the companies have lower or equaldays payables as compared to days receivables which shows the
commitment to payment schedules despite higher rec'bles.Although In sys has consistently increased its
DPO, TCS has been very consistent in this regard.Both the rms saw an increase in Days Receivables in
2020 probably owing to the pandemic.
GrossMargin Ratio ofTCS has been increasing over the years indicating strong process reforms and
e ciency improvement.
Gross Margin Ratio of Infosys has been vacillating around the same percentage,indicating possibility of
process improvements akin to TCS. Bring IT service companies, both have a very high Gross Marg
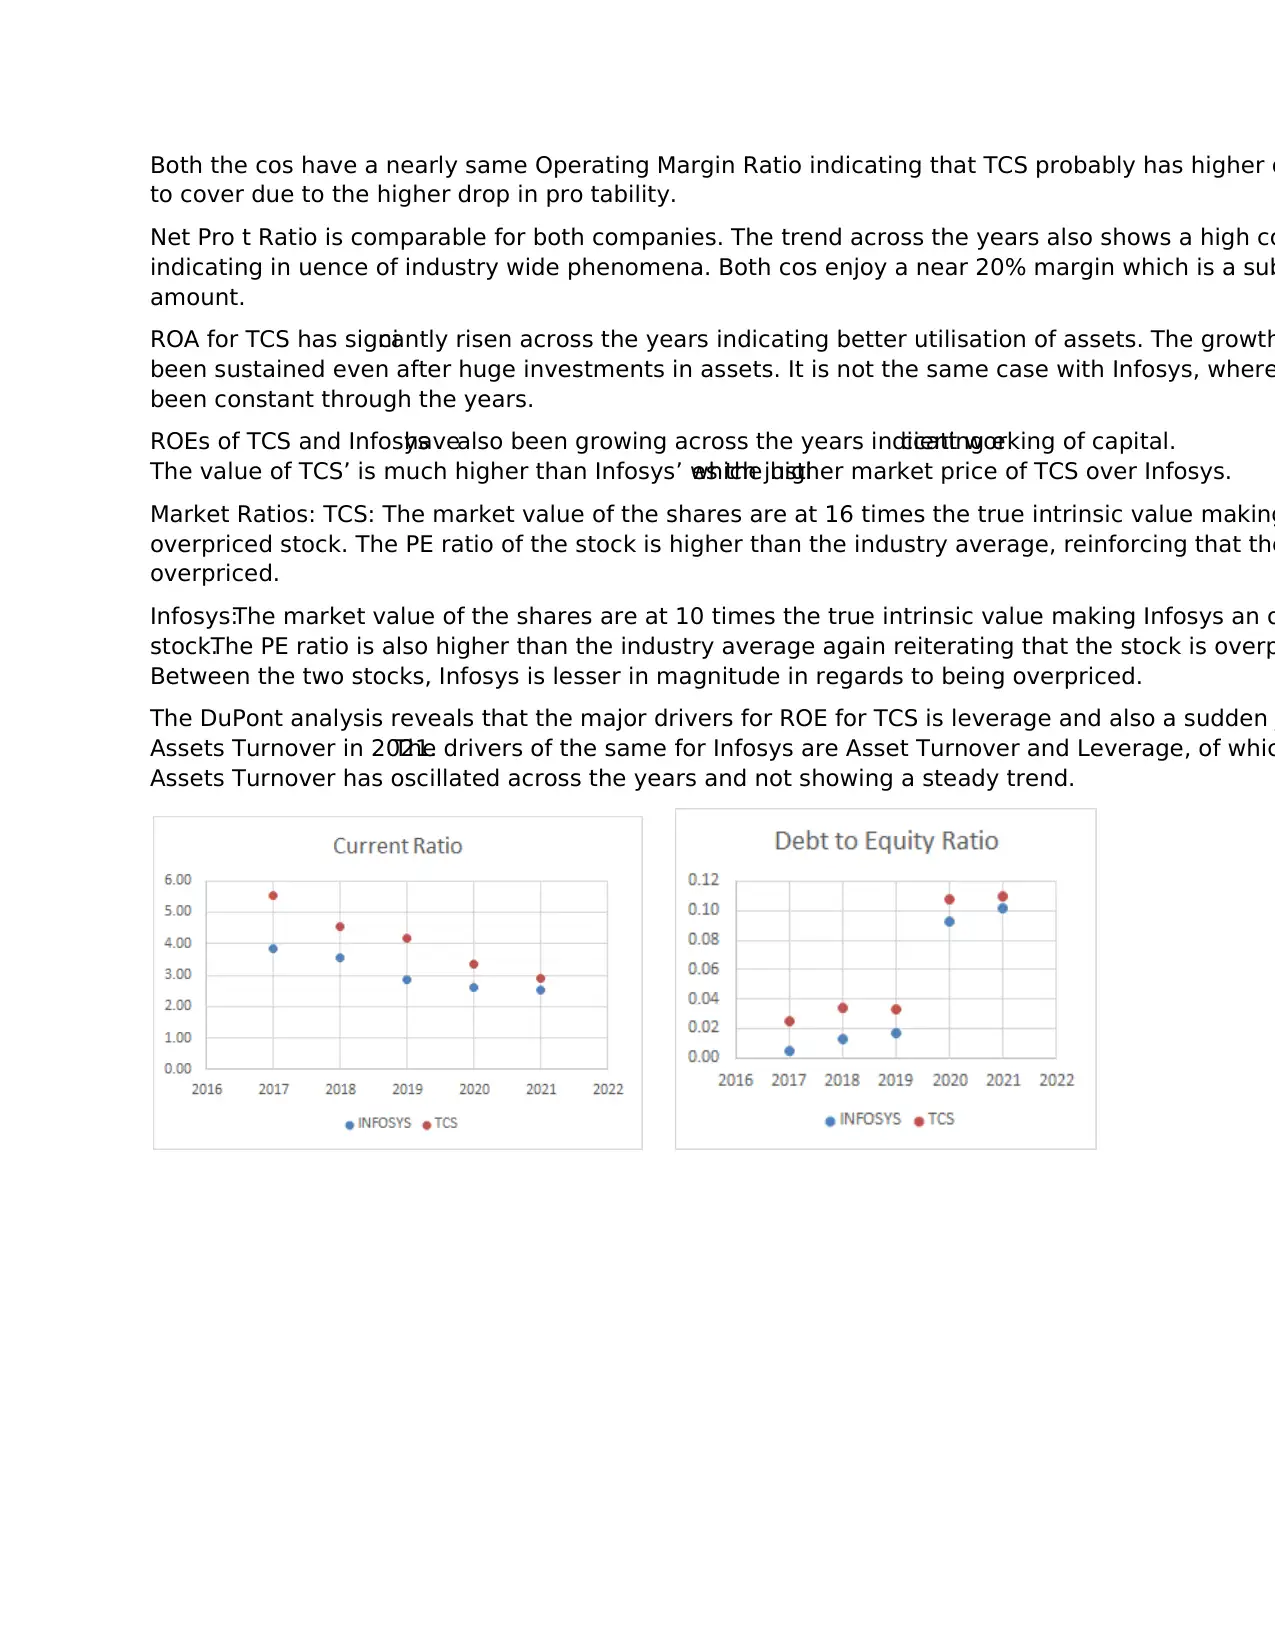
Both the cos have a nearly same Operating Margin Ratio indicating that TCS probably has higher o
to cover due to the higher drop in pro tability.
Net Pro t Ratio is comparable for both companies. The trend across the years also shows a high co
indicating in uence of industry wide phenomena. Both cos enjoy a near 20% margin which is a sub
amount.
ROA for TCS has signicantly risen across the years indicating better utilisation of assets. The growth
been sustained even after huge investments in assets. It is not the same case with Infosys, where
been constant through the years.
ROEs of TCS and Infosyshavealso been growing across the years indicating ecient working of capital.
The value of TCS’ is much higher than Infosys’ which justies the higher market price of TCS over Infosys.
Market Ratios: TCS: The market value of the shares are at 16 times the true intrinsic value making
overpriced stock. The PE ratio of the stock is higher than the industry average, reinforcing that the
overpriced.
Infosys:The market value of the shares are at 10 times the true intrinsic value making Infosys an o
stock.The PE ratio is also higher than the industry average again reiterating that the stock is overp
Between the two stocks, Infosys is lesser in magnitude in regards to being overpriced.
The DuPont analysis reveals that the major drivers for ROE for TCS is leverage and also a sudden
Assets Turnover in 2021.The drivers of the same for Infosys are Asset Turnover and Leverage, of whic
Assets Turnover has oscillated across the years and not showing a steady trend.
⊘ This is a preview!⊘
Do you want full access?
Subscribe today to unlock all pages.
Trusted by 1+ million students worldwide
Paraphrase This Document
Need a fresh take? Get an instant paraphrase of this document with our AI Paraphraser
2) Also do the horizontal , vertical and trend analysis for both the companiesnancial statement
items, which you consider as important, and analyse the results.
TCS:
Horizontal Analysis:
Share Capital: The YoY results show that there were two instances of decrease in the share capi
indicate therm required liquidity.The 96% surge in 18-19 indicates that there was an investment or an
upcoming one.The decrease in SHE in 20-21 indicates that the company possibly required some liqu
and sold shares.
Long Term Liabilities:The decrease in long term liabilities,which includes debt,presents interesting
results as there is a decline thatatlines at zero, at a time when the co raised its share capital by nealy 1
and invested the funds. This indicates the reliance and con dence the co has on the project and suciency of
funds.
Short Term Liabilities: The Short term liabilities have been steady across the years and have ri
possibly indicating a sudden necessary borrowing or liability induced by the pandemic.
Intangible Assets: The huge ascent in Intangible As demonstrates the co's solid investment in R
which shows positive future development.
Vertical Analysis:
Long Term Liabilities:The % of LTL has drastically decreased across the years,indicating that TCS’
monthly cashow in near term would not be restricted.
Short Term Liabilities: The % of LTL has drastically decreased across the years, a positive sign
that TCS is not at the mercy of high-cycle risks i.e less likely to be caught in a debt trap.
Cash and Bank Balances: The Cash and Bank Balances saw a downtrend from 2019 onwards, w
possibly indicate toward TCS investing their cash at hand into dierent ventures such as technological
advancements and cloud stacks, talked about in the directors report.
Trend Analysis:
Fixed Assets: The total FA have constantly risen across time indicating that the co has been exp
operations across the geography
Total Operating Revenue: The Operating Revenues has been steadily increasing across the yea
the co's strong foothold and growth in the sector.
Operating and Direct Expenses: The operating and direct expenses have been decreasing con
which shows that the company has been improving its eciency of doing business.
EBITDA: EBIT has been improving and growing consistently which shows that the company has b
improving its performance even under the changing scenarios and will continue to do so.
PAT: PAT has also been improving at a steady rate and shows that the company has been on a st
trajectory.
Infosys:
Horizontal Analysis:
Equity:The YoY results show that there were two instances of decrease in the share capitalwhich can
indicate therm required liquidity. The near 100% surge in 18-19 indicates that there was an investm
an upcoming one. The increase in SHE in 20-21 indicates that the company retained a good portio
pro ts or possibly even liquidate some assets.
Long Term Liabilities: The increase in the LTL is on account of increase in deferred tax liabilitie
long term liabilities which do not include any loans taken.
Short Term Liabilities: There is a signicant increase in the short term liabilities across the years, which
again does not include any loans taken.
Intangible Assets: The signicant rise in Intangible As indicates the co's strong investment in R&d and t
which indicates positive future growth.
Vertical Analysis:
Long Term Liabilities: The % of LTL has drastically increased across the years.
Short Term Liabilities: The % of LTL has drastically increased across the years.
Cash and Bank Balances: Although Cash and Balances have maintained a near steady share of
volume has been varying across the years and a signicant rise in the 20-21 may be, in part, attributed to the
rise in DSO.
Trend Analysis:
Fixed Assets:The totalFA has constantly risen across time indicating that the co has been expanding
operations across the geography.
TotalOperating Revenue:The Ope Rev has been steadily increasing across the years showing the co
strong foothold and growth in the sector. The max growth also coincides with the sudden growth i
Capital indicating an expansion in that period.
Operating and Direct Expenses: The Opex have also been steadily rising across the years but
2021 despite an increase in sales. This may be owed to the WFH policies implemented that have s
direct costs or any process improvement too.
EBITDA: EBIT, Op Income has been steady in its growth, instilling con dence in the co's performan
the future as well.
PAT: PAT also resonates with the steady growth. The lesser than usual growth in 2019 may be att
the signicant spendings that may have occurred due to the expansion as discussed in previous poi
⊘ This is a preview!⊘
Do you want full access?
Subscribe today to unlock all pages.
Trusted by 1+ million students worldwide
3) Based on the ratio analysisndings, what suggestion would you give to the following stakeh
of both the companies:(please mention the ratios which you think are relevant for the conc
stakeholders also)
i. Creditors
ii. Banks and Financial institutions
iii. Investors
iv. Government
v. Management
TCS
Creditors: The days payables for the company have been consistent across the years around 22
can indicate similar future performance thus assuring that payments will not be late. Further, the
co has been growing consistently which indicates growing biz needs and sustained business.
Banks and Financial institutions: TCS has had a high interest coverage ratio over the years an
free. Possible borrowings in the future can be expected to be paid back.
Investors: The P/B ratio is quite high and the PE ratio is above the industry average value, makin
overpriced. EPS is at 104. ROE has been steadily growing over the years, and there is no debt whi
growing eciency at using shareholder funds.
Government:Deferred tax liabilities have grown and fallen and have remained consistent.The fallis a
positive sign that it is being cleared.
Management: Capital is virtually debt free and therefore ROE may be substituted to measure theciency
of capitalutilisation;ROE is at 54% and the cost of equity is at 45% which works In the favour of the
company. Methods can be explored to widen the gap further to maximise the utilisation of funds.
Infosys
Creditors: The days payables have been cinistenyl rising, but a possible downward trend may be
due to a fallin the value in 2021. Expecting similar performance, payments can be later than anticip
Nevertheless,the company has been doing welland has a growing PAT across years indicating growing
business and growing needs which may be capitalised on.
Banks and FinancialInstitutions: Infosys has been debt free in the timeline mentioned.The operating
pro ts however have been signicantly high and growing which can indicate the company's ability to pay
back any possible borrowings.
Investors: The P/B ratio is quite high and the PE ratio is above the industry average value, makin
overpriced. EPS is at 45. ROE has been steadily growing over the years, and there is no debt which
growing eciency at using shareholder funds.
Paraphrase This Document
Need a fresh take? Get an instant paraphrase of this document with our AI Paraphraser
Government: Deferred tax liabilities have been constantly growing and need to be settled o . Thi
if sustained, is a cause of concern.
Management: Capital is virtually debt free and therefore ROE may be substituted to measure theciency
of capital utilisation. ROE is at 35% whereas the cost of equity is signicantly higher. This calls for further
analysis and action to shift the scales in favour.
4) For each of the 2 companies that you have analysed:
a. Explain how the Chairman’smessage and the Board’sreportis usef ulin understanding the
information in thenancial statements.
TCS
The Chairman’sspeech and Board Report in the TCS AnnualReport of 2020-21 provided a concise
overview of the overall health of the company. It spoke about the impact the pandemic had, the a
up by TCS to combat the same, extending support for employeesand how the business front managed to
survive, adapt and embrace the new changes in norms which were brought on this year. It spoke
growth trajectory taking a hit initially,but recovering over a span of 9 months and realized a strong exit
bearing a greater market share, solid pro tability and highest ever order book. This information is
useful because we as stakeholders and analysts can gauge the responsiveness of TCS during thisnancial year
and better understand the standings of dierent nancialratios while performing horizontalanalysis of
data.
The reportalso talked abouttechnologicalchangesand disruption in the IT industry,and how the
recognizable change wasrealized in the hands of the consumer rather than what was going on at an
enterprise level.It stressed on the need for the requirement of digital transformation via cloud stacks
multi-year technology upgrade cycles - this highlight gives us better information while analyzing n
investments into inventory and others, as we have an insight into TCS’ future propositions and un
their prospective investment and costing decisions.
Infosys
The Chairman’s speech and Board Report in the Infosys AnnualReport of 2020-21 presented facts and
gures at a glance to provide an overview of the overallnancialhealth of the company. It addressed the
revenue growth,operating margin and increase in free cashows quantitatively, helping analysts like us to
better interpret thenancialstatements from an end-users perspective - having the key dening metrics
already highlighted.In addition to this,the board mentioned changes in administration with respect to
newly appointed and retiring directors in thisnancialyear.Administrative changes at top levels have a
signicant impact on shareholder sentiment and can impact the movement of stock prices and com
image.
Similar to TCS, Infosys highlighted the impact of the pandemic pre and post, and the rapid shift in
transformation,with the unprecedented scaleof cloud-rst technology -and how Infosysplanson
leveraging these technologies in their complex projects and number of deals they have signed thi
has been the highest in the history of Infosys. They spoke about hiring talentgures, and their monetary
commitment towardsghting the pandemic - clearly reected in the growing investor awareness. We can
better understand and see their investments into building digital capability and new cloud solution
re ected in their investments and see their business value grow. The variation in cashow statements can
better be interpreted after knowing the undertakings that Infosys has had thisnancial year, and we can
expect to spot a dierence and realize the justication in trends while conducting a horizontal and vertical
analysis.
b. Do the companies provide information that would enable investors and analysts to u
long term direction? ( comment based on 2020-21 annual report only)
Yes, companies do provide information to understand its long term direction. The annual report hi
lot of other important points which are ignored by most people, but seasoned analysts and investo
a lot about a company.
● The Director's Report: It discusses improvements that have occurred after the balance sheet d
than thenancials, it discusses development plans, worker productivity and close term developme
It likewise species the products and services presented during the year and their capacity,other than
abnormalexpenditures or negatives that have hit edges. Then, at that point, there is an evaluation
current year's possibilities, which is signicant for key examinations like fundamental analysis.
● CorporateGovernanceReport:It talksaboutadministration changesaboutboard ofdirectors,
nonexecutive directors, constraints on management and ownership concentration, executive com
and nancialinformation.Maintaining such a levelof transparency and accountability dealing with the
nuances of the business shows how stable a company is.
● Notesto Accounts:They elaboratenancial guresand are extremely importantin appropriately
interpreting companynancials, which subsequently help in gauging overallnancial health and standings
for a company.
● Director Salaries: A directors salary is not solely determined by their position but has a lot to d
performance, this factors in giving us a picture about company pro tability and overall health. An
use thesegures by market rate comparisons and industry-specic norms to determine the mindset a
company has for seeking its next steps.
c.How is the corporate governance report usef ul? What additional information would b
based on 2020-21 annual report only)
The Corporate governance report of a company shared as a part of the annualreport can provide many
insights into the ethical corporate behavior that the company follows, oversees thescal accountability and
ensuresscalaccountability and gives con dence that ethicalfairness is practiced for all stakeholders like
employees, customers, regulators, vendors and the society at large.
⊘ This is a preview!⊘
Do you want full access?
Subscribe today to unlock all pages.
Trusted by 1+ million students worldwide
1 out of 57
Related Documents


Your All-in-One AI-Powered Toolkit for Academic Success.
+13062052269
info@desklib.com
Available 24*7 on WhatsApp / Email
![[object Object]](/_next/static/media/star-bottom.7253800d.svg)
Unlock your academic potential
Copyright © 2020–2026 A2Z Services. All Rights Reserved. Developed and managed by ZUCOL.