Cross-sectional Survey: Big Data and Tech in Australian Beverages
VerifiedAdded on 2020/05/16
|9
|2776
|40
Homework Assignment
AI Summary
This assignment presents a cross-sectional questionnaire survey conducted to assess the awareness of big data and technology usage within the Australian beverage industry. The introduction defines big data and its key aspects, emphasizing its importance for data analysis and decision-making. The project objective is to analyze the awareness levels related to big data and technology use in the Australian beverage industry, focusing on retailers, suppliers, and trading partners. The literature review highlights the growing importance of digital technology and big data analytics in the food and beverage sector, referencing examples like Starbucks. The study formulates hypotheses regarding the association between awareness levels and demographic variables such as age, gender, and category. The research design involves a structured questionnaire with socio-demographic questions and statements to assess awareness on a dichotomous scale. A simple random sampling technique is used to collect data from a sample of 381 participants. The study will use descriptive statistics and the Chi-square test to analyze the data. The research is limited to the beverage industry and the respondents' locality and university affiliations. The study is expected to be completed within four months, and the findings will provide insights into awareness levels, demographic influences, and the potential for technology adoption in the Australian beverage industry.
A Survey on Awareness about Big Data and use of technology in the Australian Beverage
Industry: Cross-sectional Questionnaire Survey
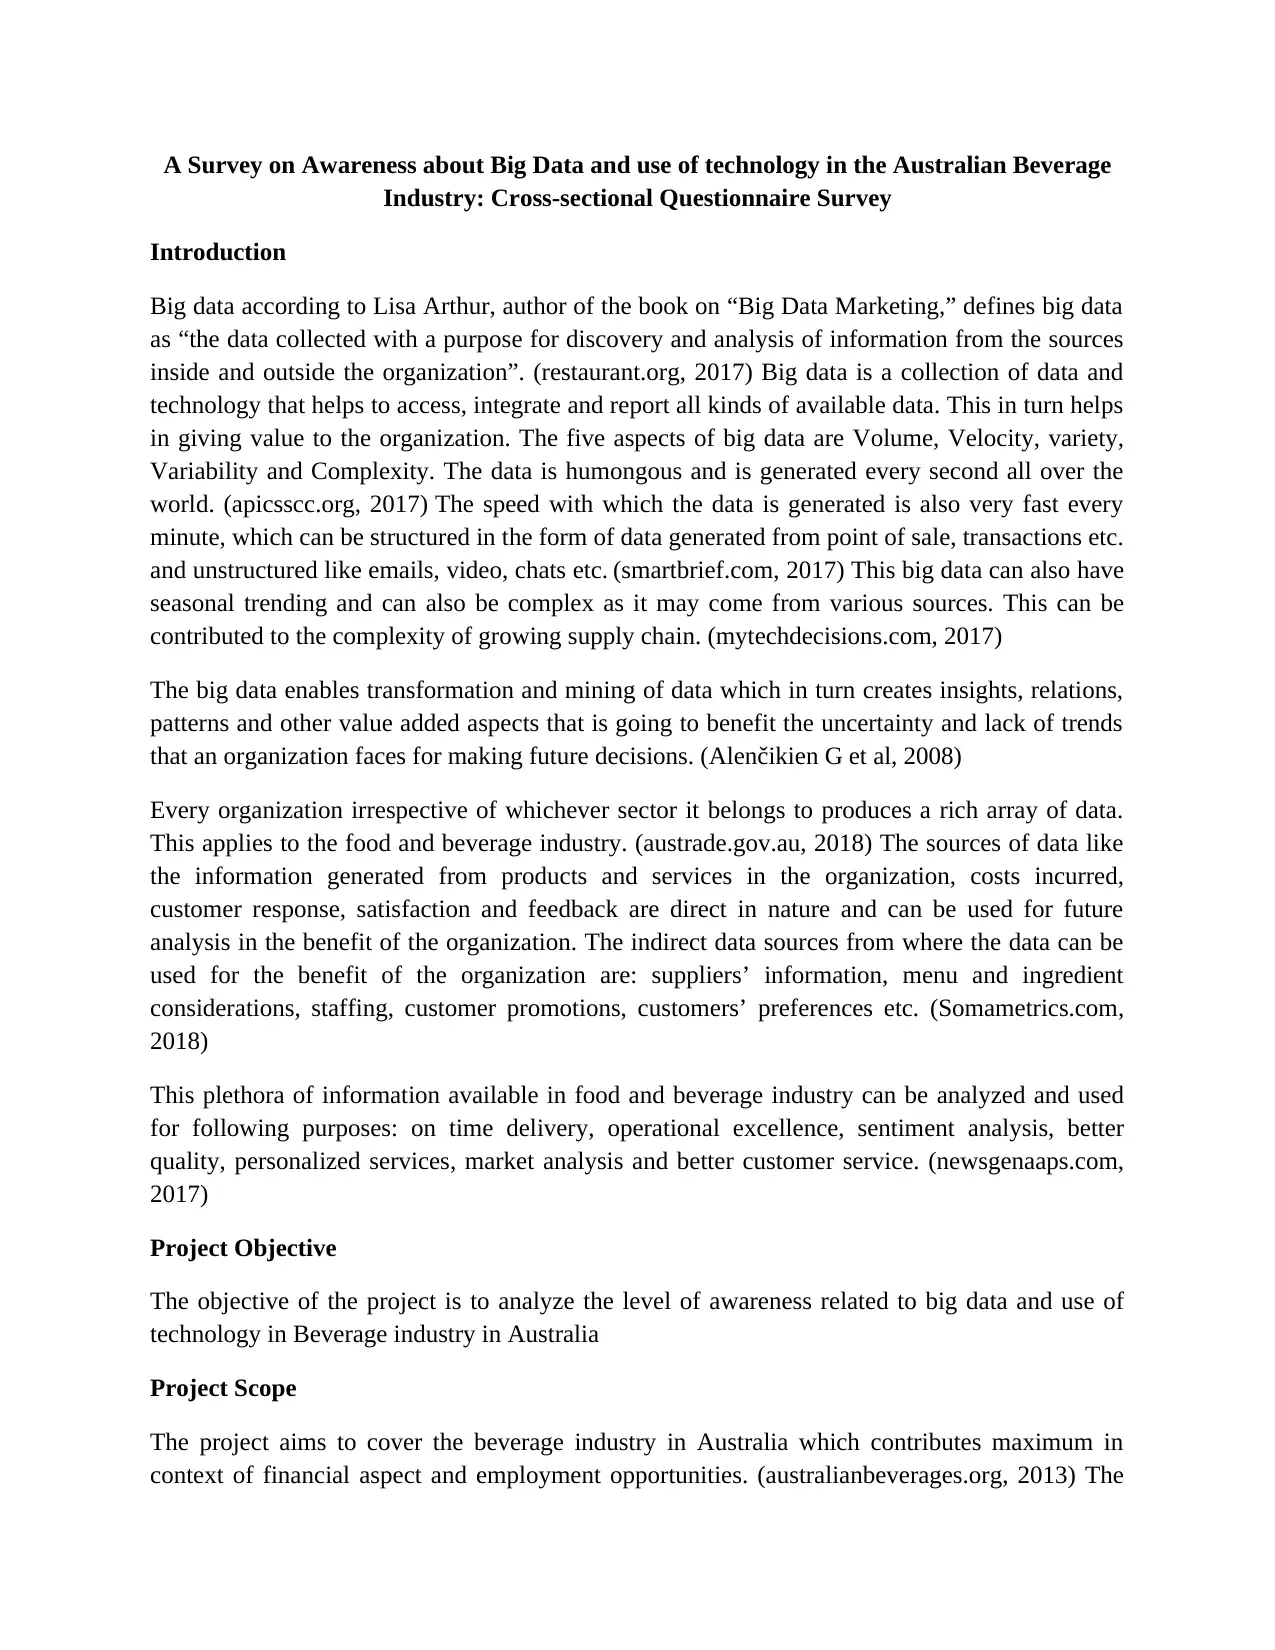
Introduction
Big data according to Lisa Arthur, author of the book on “Big Data Marketing,” defines big data
as “the data collected with a purpose for discovery and analysis of information from the sources
inside and outside the organization”. (restaurant.org, 2017) Big data is a collection of data and
technology that helps to access, integrate and report all kinds of available data. This in turn helps
in giving value to the organization. The five aspects of big data are Volume, Velocity, variety,
Variability and Complexity. The data is humongous and is generated every second all over the
world. (apicsscc.org, 2017) The speed with which the data is generated is also very fast every
minute, which can be structured in the form of data generated from point of sale, transactions etc.
and unstructured like emails, video, chats etc. (smartbrief.com, 2017) This big data can also have
seasonal trending and can also be complex as it may come from various sources. This can be
contributed to the complexity of growing supply chain. (mytechdecisions.com, 2017)
The big data enables transformation and mining of data which in turn creates insights, relations,
patterns and other value added aspects that is going to benefit the uncertainty and lack of trends
that an organization faces for making future decisions. (Alenčikien G et al, 2008)
Every organization irrespective of whichever sector it belongs to produces a rich array of data.
This applies to the food and beverage industry. (austrade.gov.au, 2018) The sources of data like
the information generated from products and services in the organization, costs incurred,
customer response, satisfaction and feedback are direct in nature and can be used for future
analysis in the benefit of the organization. The indirect data sources from where the data can be
used for the benefit of the organization are: suppliers’ information, menu and ingredient
considerations, staffing, customer promotions, customers’ preferences etc. (Somametrics.com,
2018)
This plethora of information available in food and beverage industry can be analyzed and used
for following purposes: on time delivery, operational excellence, sentiment analysis, better
quality, personalized services, market analysis and better customer service. (newsgenaaps.com,
2017)
Project Objective
The objective of the project is to analyze the level of awareness related to big data and use of
technology in Beverage industry in Australia
Project Scope
The project aims to cover the beverage industry in Australia which contributes maximum in
context of financial aspect and employment opportunities. (australianbeverages.org, 2013) The
Industry: Cross-sectional Questionnaire Survey
Introduction
Big data according to Lisa Arthur, author of the book on “Big Data Marketing,” defines big data
as “the data collected with a purpose for discovery and analysis of information from the sources
inside and outside the organization”. (restaurant.org, 2017) Big data is a collection of data and
technology that helps to access, integrate and report all kinds of available data. This in turn helps
in giving value to the organization. The five aspects of big data are Volume, Velocity, variety,
Variability and Complexity. The data is humongous and is generated every second all over the
world. (apicsscc.org, 2017) The speed with which the data is generated is also very fast every
minute, which can be structured in the form of data generated from point of sale, transactions etc.
and unstructured like emails, video, chats etc. (smartbrief.com, 2017) This big data can also have
seasonal trending and can also be complex as it may come from various sources. This can be
contributed to the complexity of growing supply chain. (mytechdecisions.com, 2017)
The big data enables transformation and mining of data which in turn creates insights, relations,
patterns and other value added aspects that is going to benefit the uncertainty and lack of trends
that an organization faces for making future decisions. (Alenčikien G et al, 2008)
Every organization irrespective of whichever sector it belongs to produces a rich array of data.
This applies to the food and beverage industry. (austrade.gov.au, 2018) The sources of data like
the information generated from products and services in the organization, costs incurred,
customer response, satisfaction and feedback are direct in nature and can be used for future
analysis in the benefit of the organization. The indirect data sources from where the data can be
used for the benefit of the organization are: suppliers’ information, menu and ingredient
considerations, staffing, customer promotions, customers’ preferences etc. (Somametrics.com,
2018)
This plethora of information available in food and beverage industry can be analyzed and used
for following purposes: on time delivery, operational excellence, sentiment analysis, better
quality, personalized services, market analysis and better customer service. (newsgenaaps.com,
2017)
Project Objective
The objective of the project is to analyze the level of awareness related to big data and use of
technology in Beverage industry in Australia
Project Scope
The project aims to cover the beverage industry in Australia which contributes maximum in
context of financial aspect and employment opportunities. (australianbeverages.org, 2013) The
Paraphrase This Document
Need a fresh take? Get an instant paraphrase of this document with our AI Paraphraser
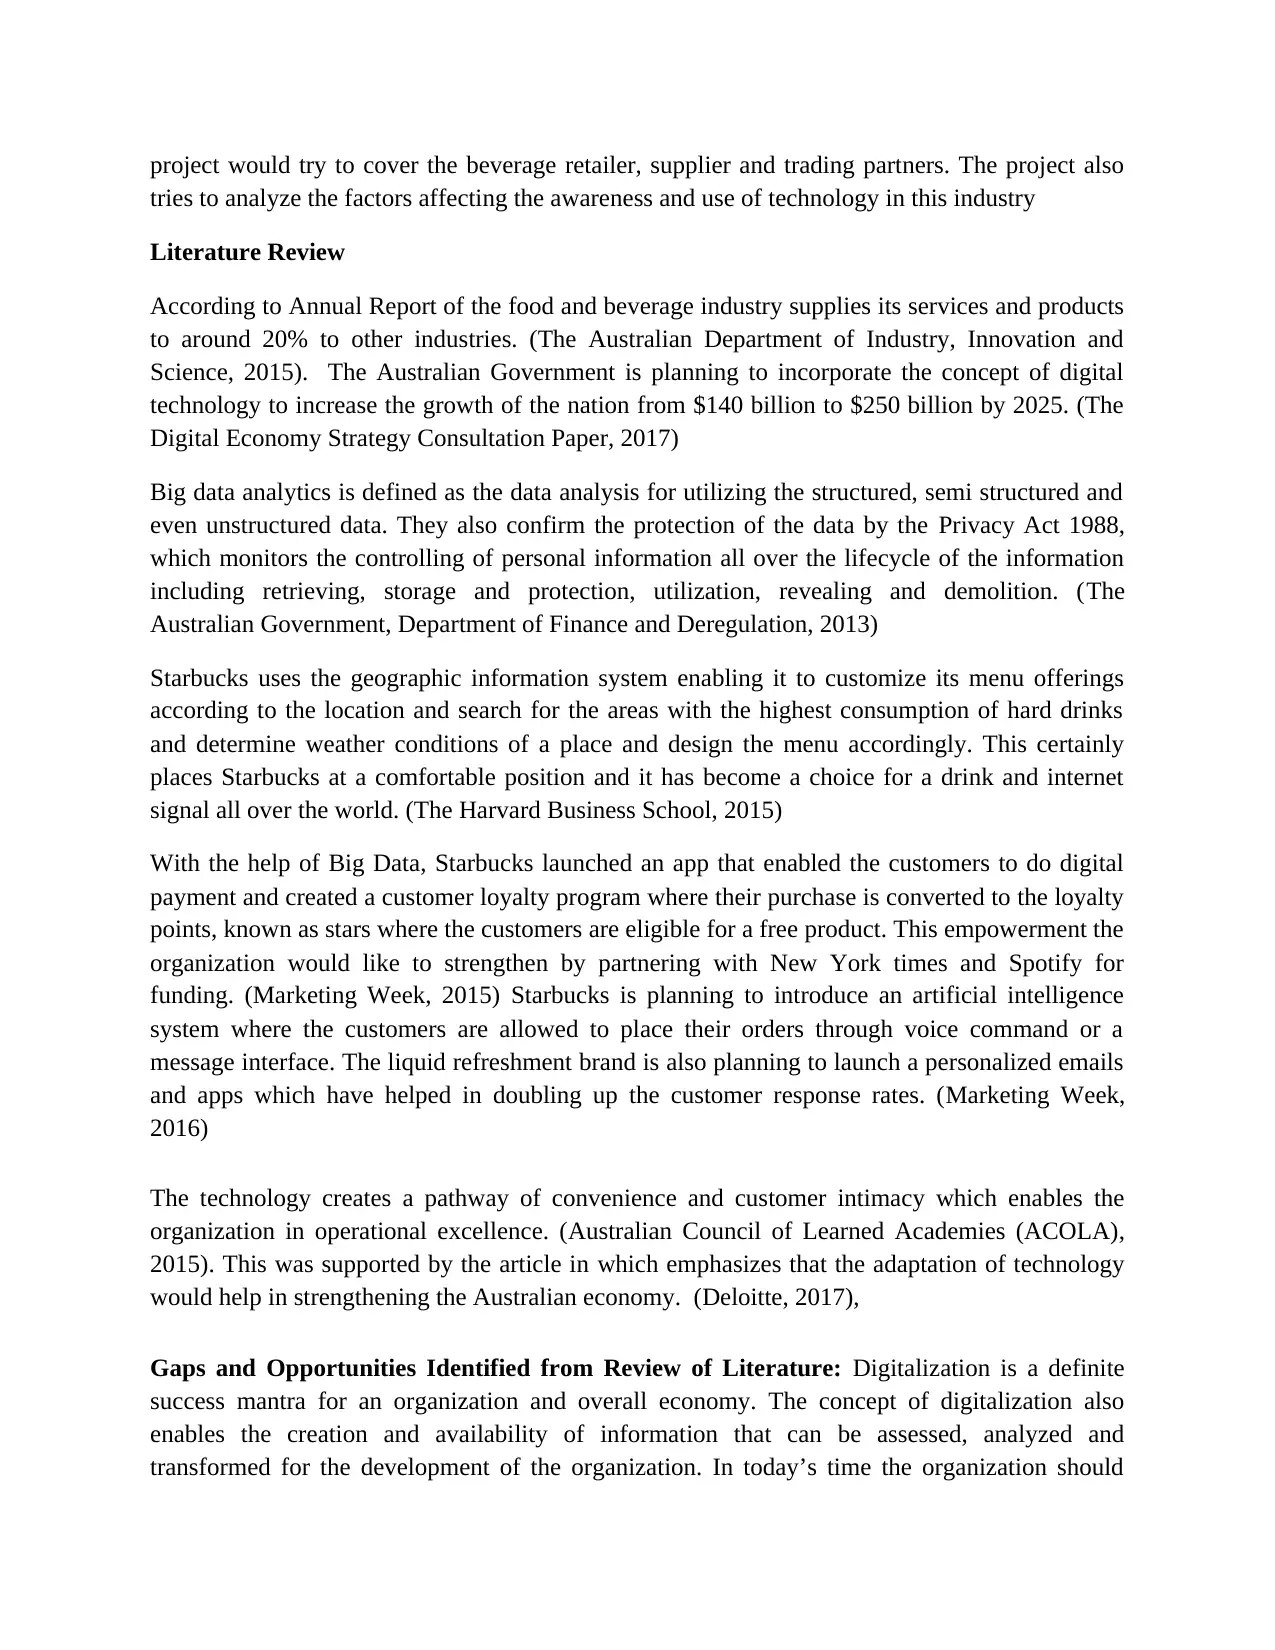
project would try to cover the beverage retailer, supplier and trading partners. The project also
tries to analyze the factors affecting the awareness and use of technology in this industry
Literature Review
According to Annual Report of the food and beverage industry supplies its services and products
to around 20% to other industries. (The Australian Department of Industry, Innovation and
Science, 2015). The Australian Government is planning to incorporate the concept of digital
technology to increase the growth of the nation from $140 billion to $250 billion by 2025. (The
Digital Economy Strategy Consultation Paper, 2017)
Big data analytics is defined as the data analysis for utilizing the structured, semi structured and
even unstructured data. They also confirm the protection of the data by the Privacy Act 1988,
which monitors the controlling of personal information all over the lifecycle of the information
including retrieving, storage and protection, utilization, revealing and demolition. (The
Australian Government, Department of Finance and Deregulation, 2013)
Starbucks uses the geographic information system enabling it to customize its menu offerings
according to the location and search for the areas with the highest consumption of hard drinks
and determine weather conditions of a place and design the menu accordingly. This certainly
places Starbucks at a comfortable position and it has become a choice for a drink and internet
signal all over the world. (The Harvard Business School, 2015)
With the help of Big Data, Starbucks launched an app that enabled the customers to do digital
payment and created a customer loyalty program where their purchase is converted to the loyalty
points, known as stars where the customers are eligible for a free product. This empowerment the
organization would like to strengthen by partnering with New York times and Spotify for
funding. (Marketing Week, 2015) Starbucks is planning to introduce an artificial intelligence
system where the customers are allowed to place their orders through voice command or a
message interface. The liquid refreshment brand is also planning to launch a personalized emails
and apps which have helped in doubling up the customer response rates. (Marketing Week,
2016)
The technology creates a pathway of convenience and customer intimacy which enables the
organization in operational excellence. (Australian Council of Learned Academies (ACOLA),
2015). This was supported by the article in which emphasizes that the adaptation of technology
would help in strengthening the Australian economy. (Deloitte, 2017),
Gaps and Opportunities Identified from Review of Literature: Digitalization is a definite
success mantra for an organization and overall economy. The concept of digitalization also
enables the creation and availability of information that can be assessed, analyzed and
transformed for the development of the organization. In today’s time the organization should
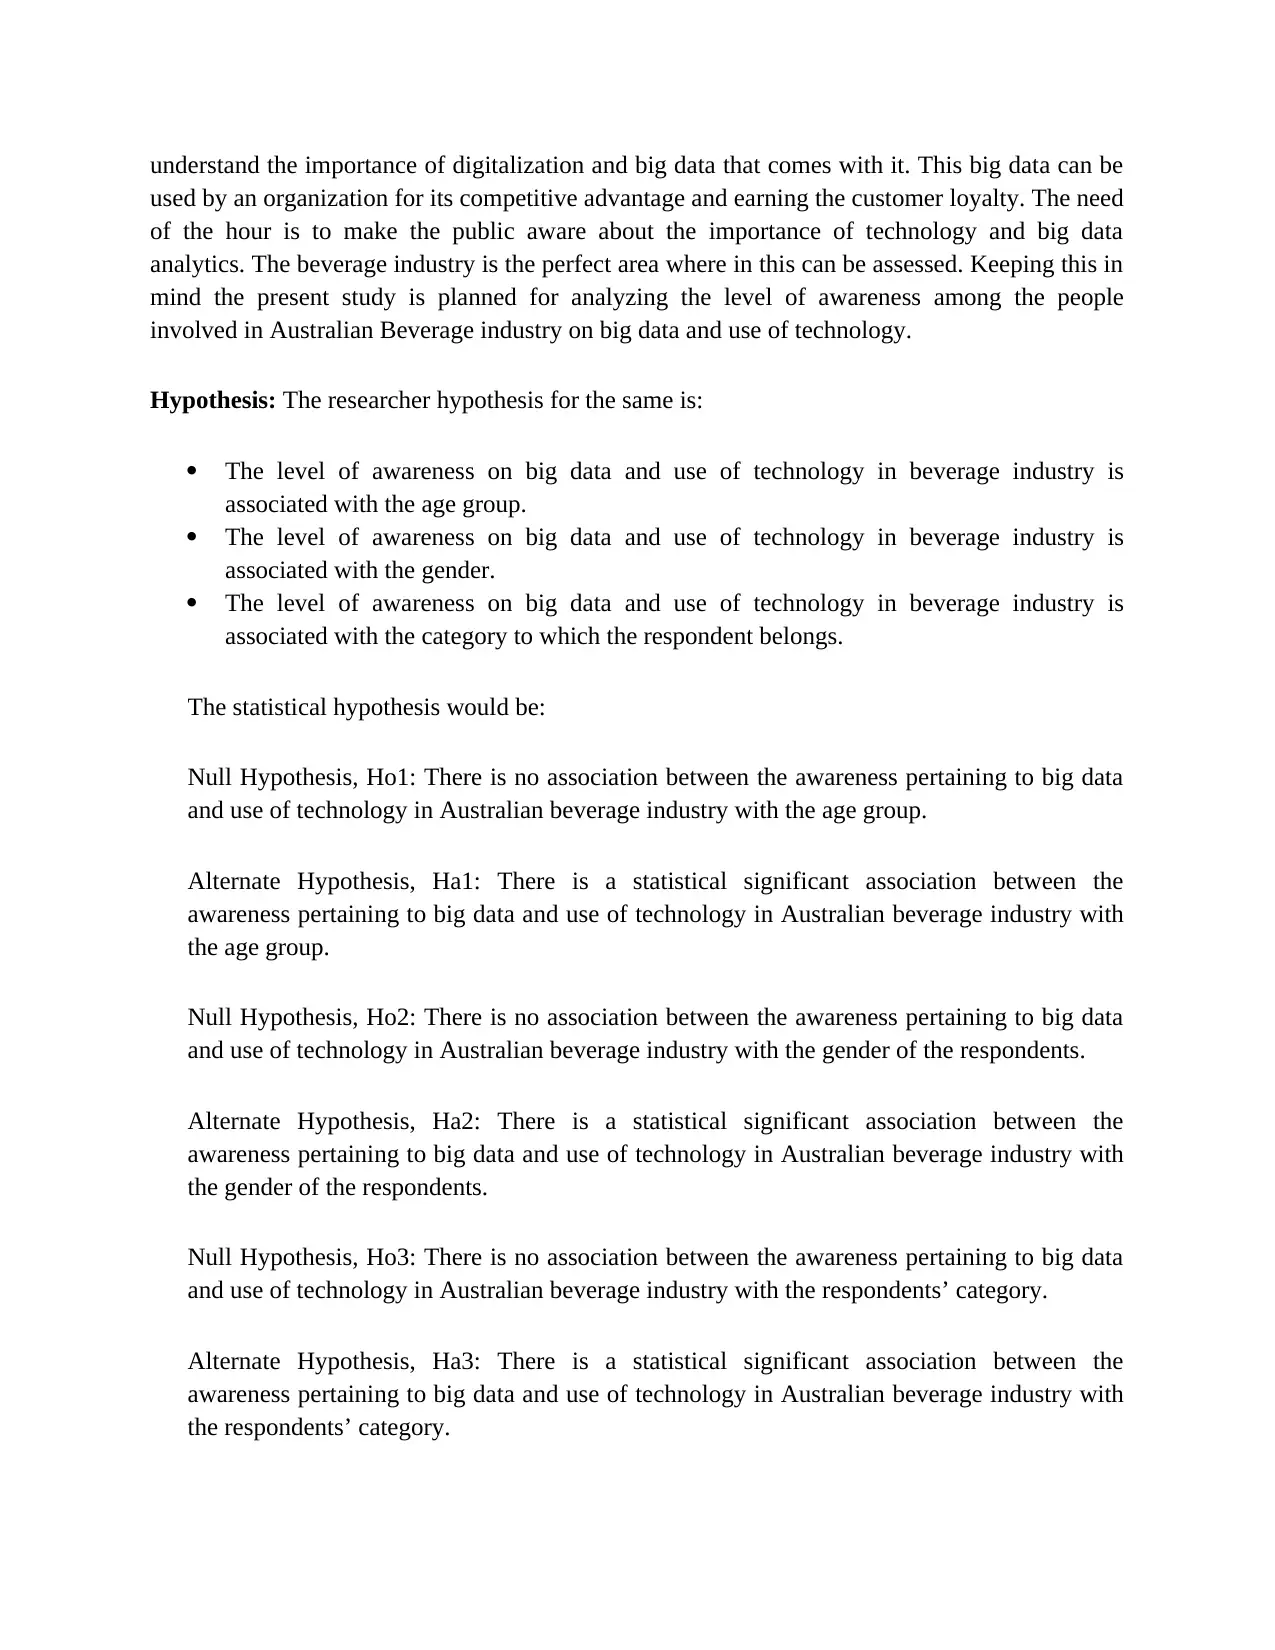
understand the importance of digitalization and big data that comes with it. This big data can be
used by an organization for its competitive advantage and earning the customer loyalty. The need
of the hour is to make the public aware about the importance of technology and big data
analytics. The beverage industry is the perfect area where in this can be assessed. Keeping this in
mind the present study is planned for analyzing the level of awareness among the people
involved in Australian Beverage industry on big data and use of technology.
Hypothesis: The researcher hypothesis for the same is:
The level of awareness on big data and use of technology in beverage industry is
associated with the age group.
The level of awareness on big data and use of technology in beverage industry is
associated with the gender.
The level of awareness on big data and use of technology in beverage industry is
associated with the category to which the respondent belongs.
The statistical hypothesis would be:
Null Hypothesis, Ho1: There is no association between the awareness pertaining to big data
and use of technology in Australian beverage industry with the age group.
Alternate Hypothesis, Ha1: There is a statistical significant association between the
awareness pertaining to big data and use of technology in Australian beverage industry with
the age group.
Null Hypothesis, Ho2: There is no association between the awareness pertaining to big data
and use of technology in Australian beverage industry with the gender of the respondents.
Alternate Hypothesis, Ha2: There is a statistical significant association between the
awareness pertaining to big data and use of technology in Australian beverage industry with
the gender of the respondents.
Null Hypothesis, Ho3: There is no association between the awareness pertaining to big data
and use of technology in Australian beverage industry with the respondents’ category.
Alternate Hypothesis, Ha3: There is a statistical significant association between the
awareness pertaining to big data and use of technology in Australian beverage industry with
the respondents’ category.
⊘ This is a preview!⊘
Do you want full access?
Subscribe today to unlock all pages.
Trusted by 1+ million students worldwide
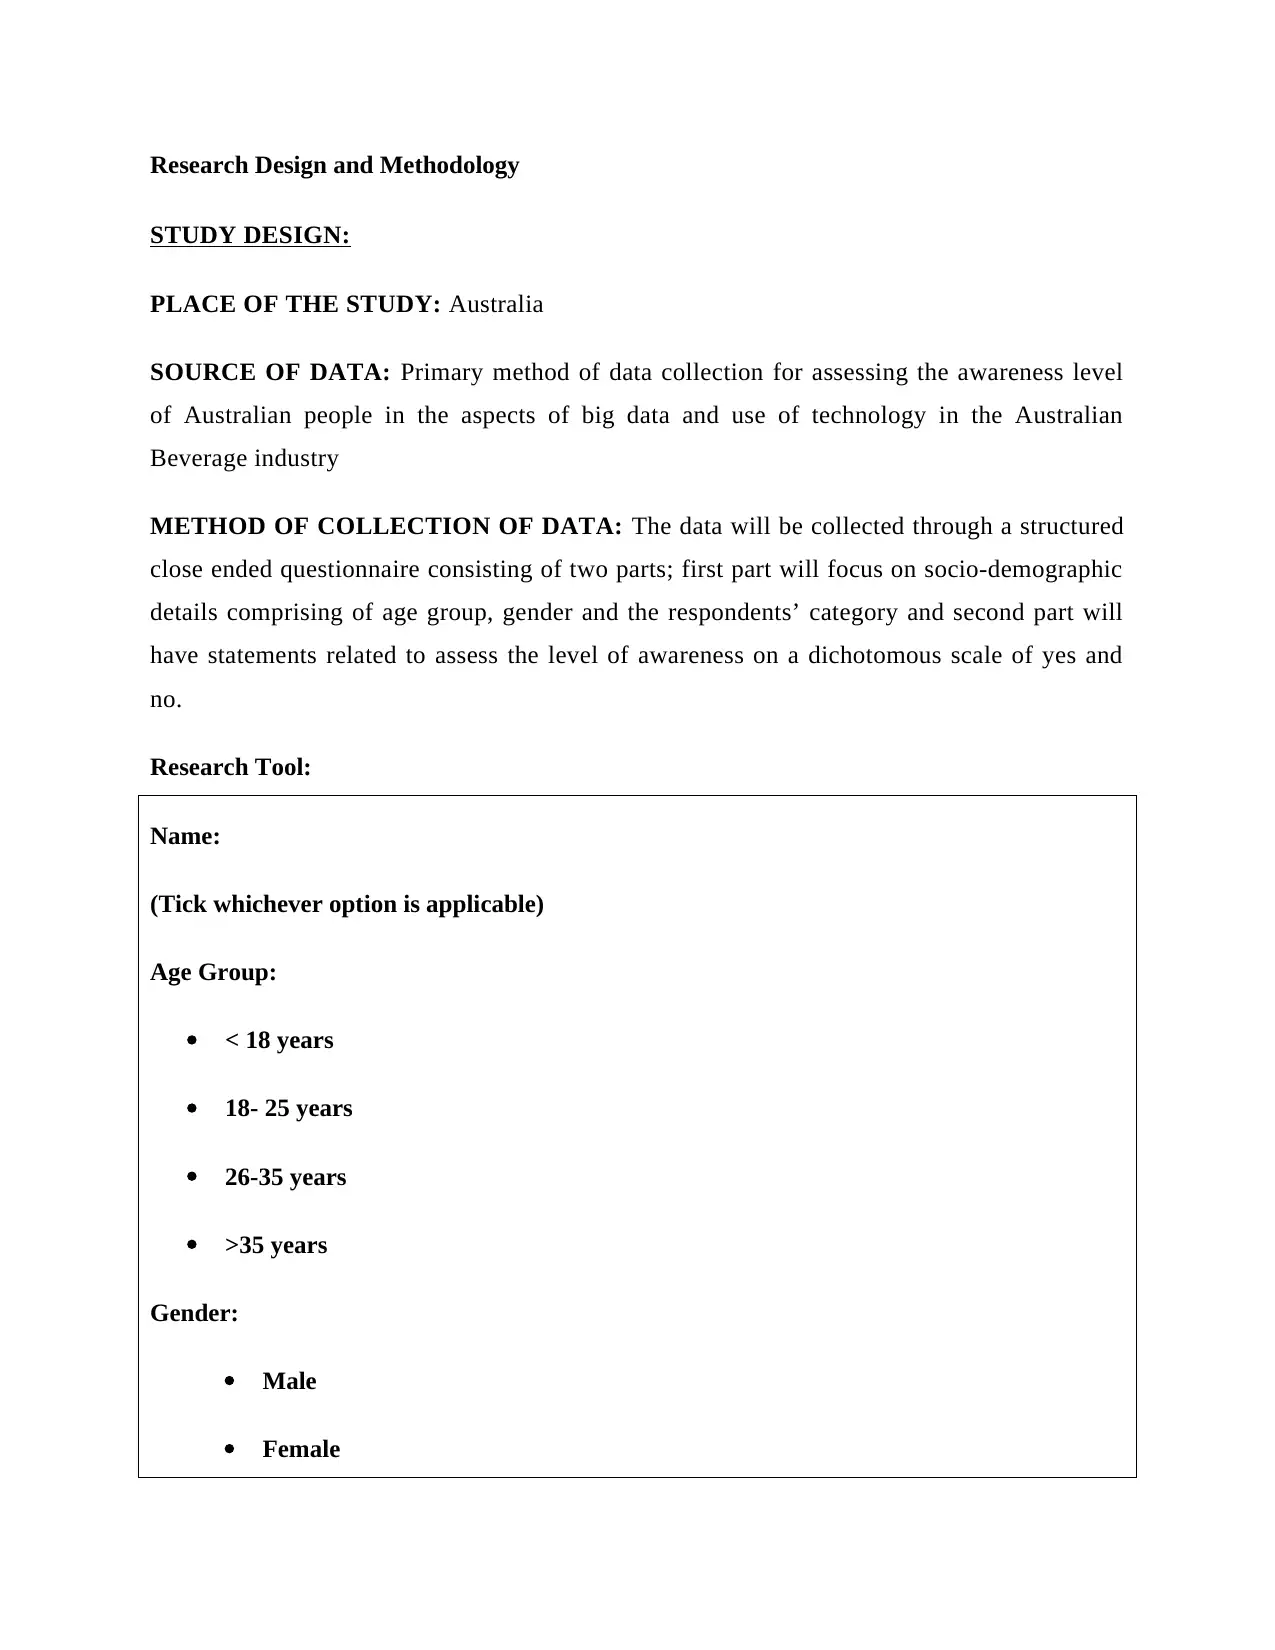
Research Design and Methodology
STUDY DESIGN:
PLACE OF THE STUDY: Australia
SOURCE OF DATA: Primary method of data collection for assessing the awareness level
of Australian people in the aspects of big data and use of technology in the Australian
Beverage industry
METHOD OF COLLECTION OF DATA: The data will be collected through a structured
close ended questionnaire consisting of two parts; first part will focus on socio-demographic
details comprising of age group, gender and the respondents’ category and second part will
have statements related to assess the level of awareness on a dichotomous scale of yes and
no.
Research Tool:
Name:
(Tick whichever option is applicable)
Age Group:
< 18 years
18- 25 years
26-35 years
>35 years
Gender:
Male
Female
Paraphrase This Document
Need a fresh take? Get an instant paraphrase of this document with our AI Paraphraser
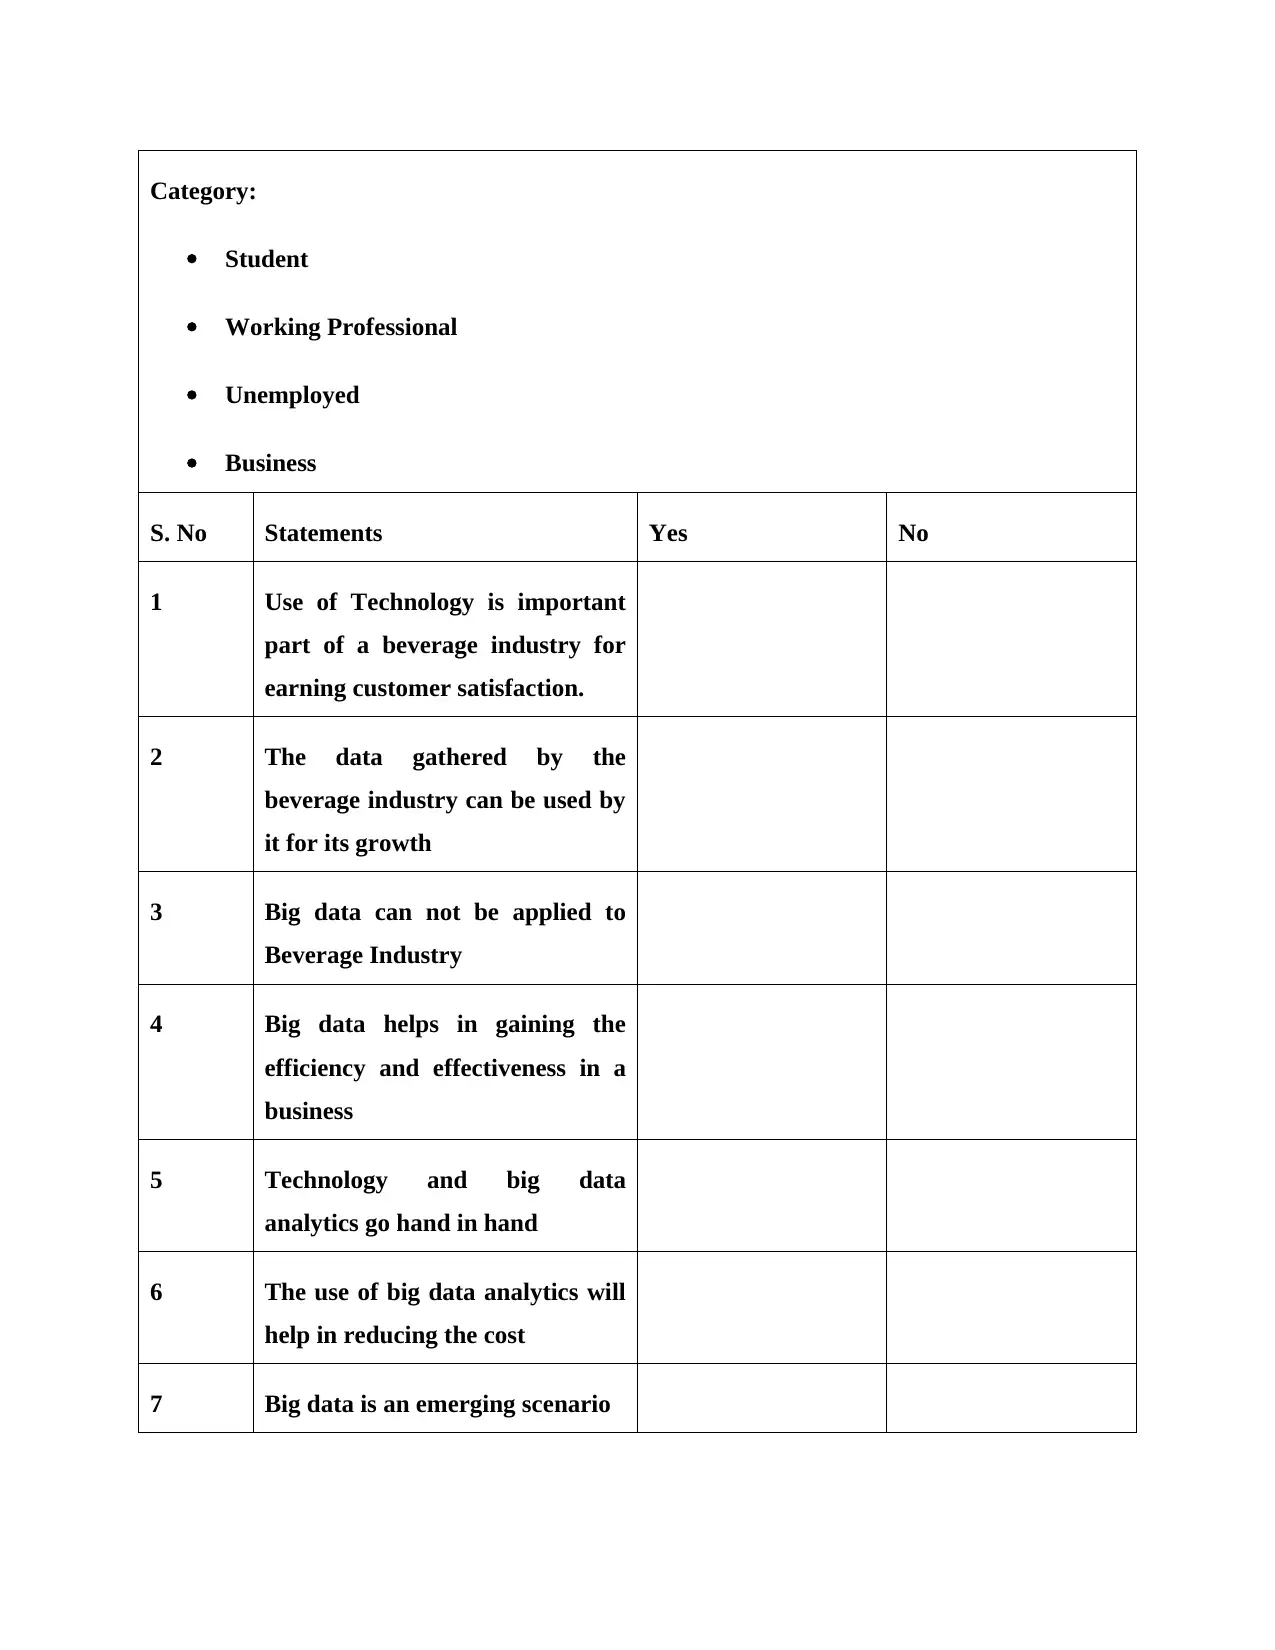
Category:
Student
Working Professional
Unemployed
Business
S. No Statements Yes No
1 Use of Technology is important
part of a beverage industry for
earning customer satisfaction.
2 The data gathered by the
beverage industry can be used by
it for its growth
3 Big data can not be applied to
Beverage Industry
4 Big data helps in gaining the
efficiency and effectiveness in a
business
5 Technology and big data
analytics go hand in hand
6 The use of big data analytics will
help in reducing the cost
7 Big data is an emerging scenario
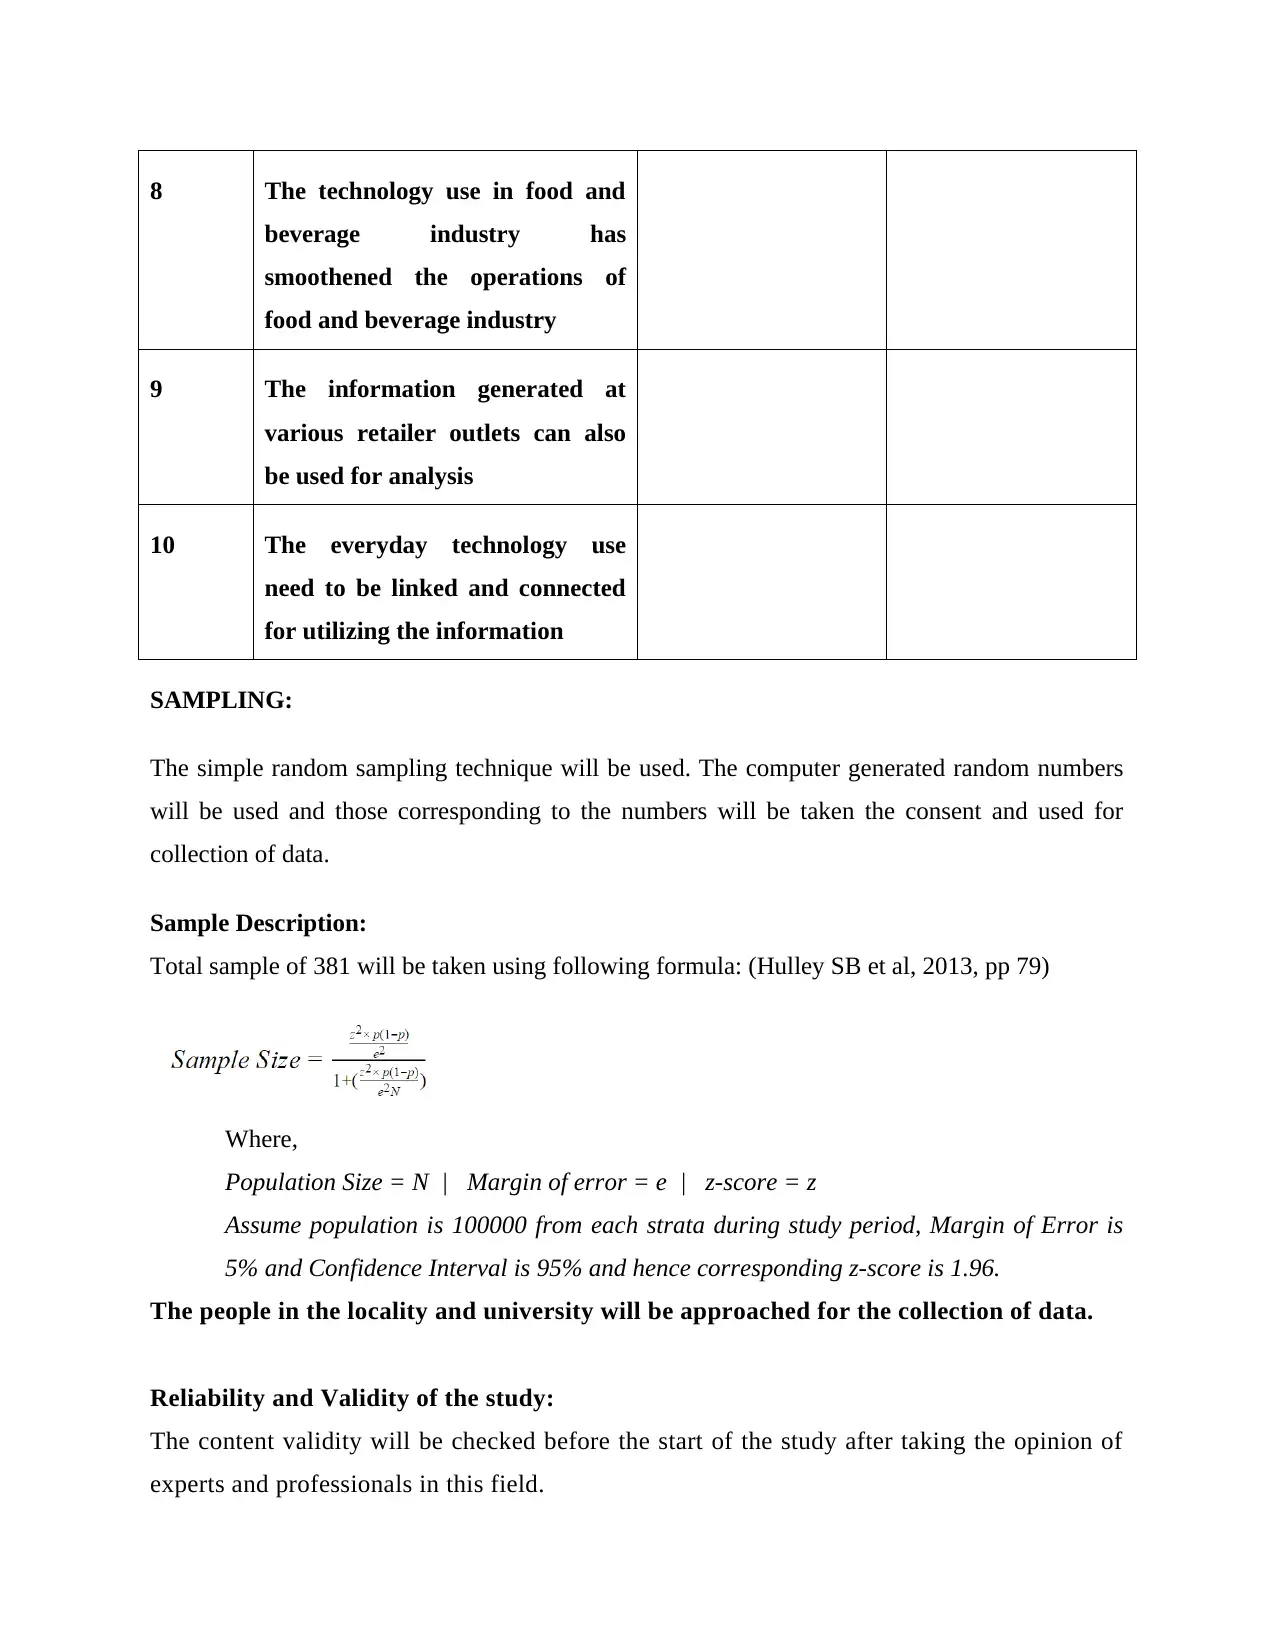
8 The technology use in food and
beverage industry has
smoothened the operations of
food and beverage industry
9 The information generated at
various retailer outlets can also
be used for analysis
10 The everyday technology use
need to be linked and connected
for utilizing the information
SAMPLING:
The simple random sampling technique will be used. The computer generated random numbers
will be used and those corresponding to the numbers will be taken the consent and used for
collection of data.
Sample Description:
Total sample of 381 will be taken using following formula: (Hulley SB et al, 2013, pp 79)
Where,
Population Size = N | Margin of error = e | z-score = z
Assume population is 100000 from each strata during study period, Margin of Error is
5% and Confidence Interval is 95% and hence corresponding z-score is 1.96.
The people in the locality and university will be approached for the collection of data.
Reliability and Validity of the study:
The content validity will be checked before the start of the study after taking the opinion of
experts and professionals in this field.
⊘ This is a preview!⊘
Do you want full access?
Subscribe today to unlock all pages.
Trusted by 1+ million students worldwide
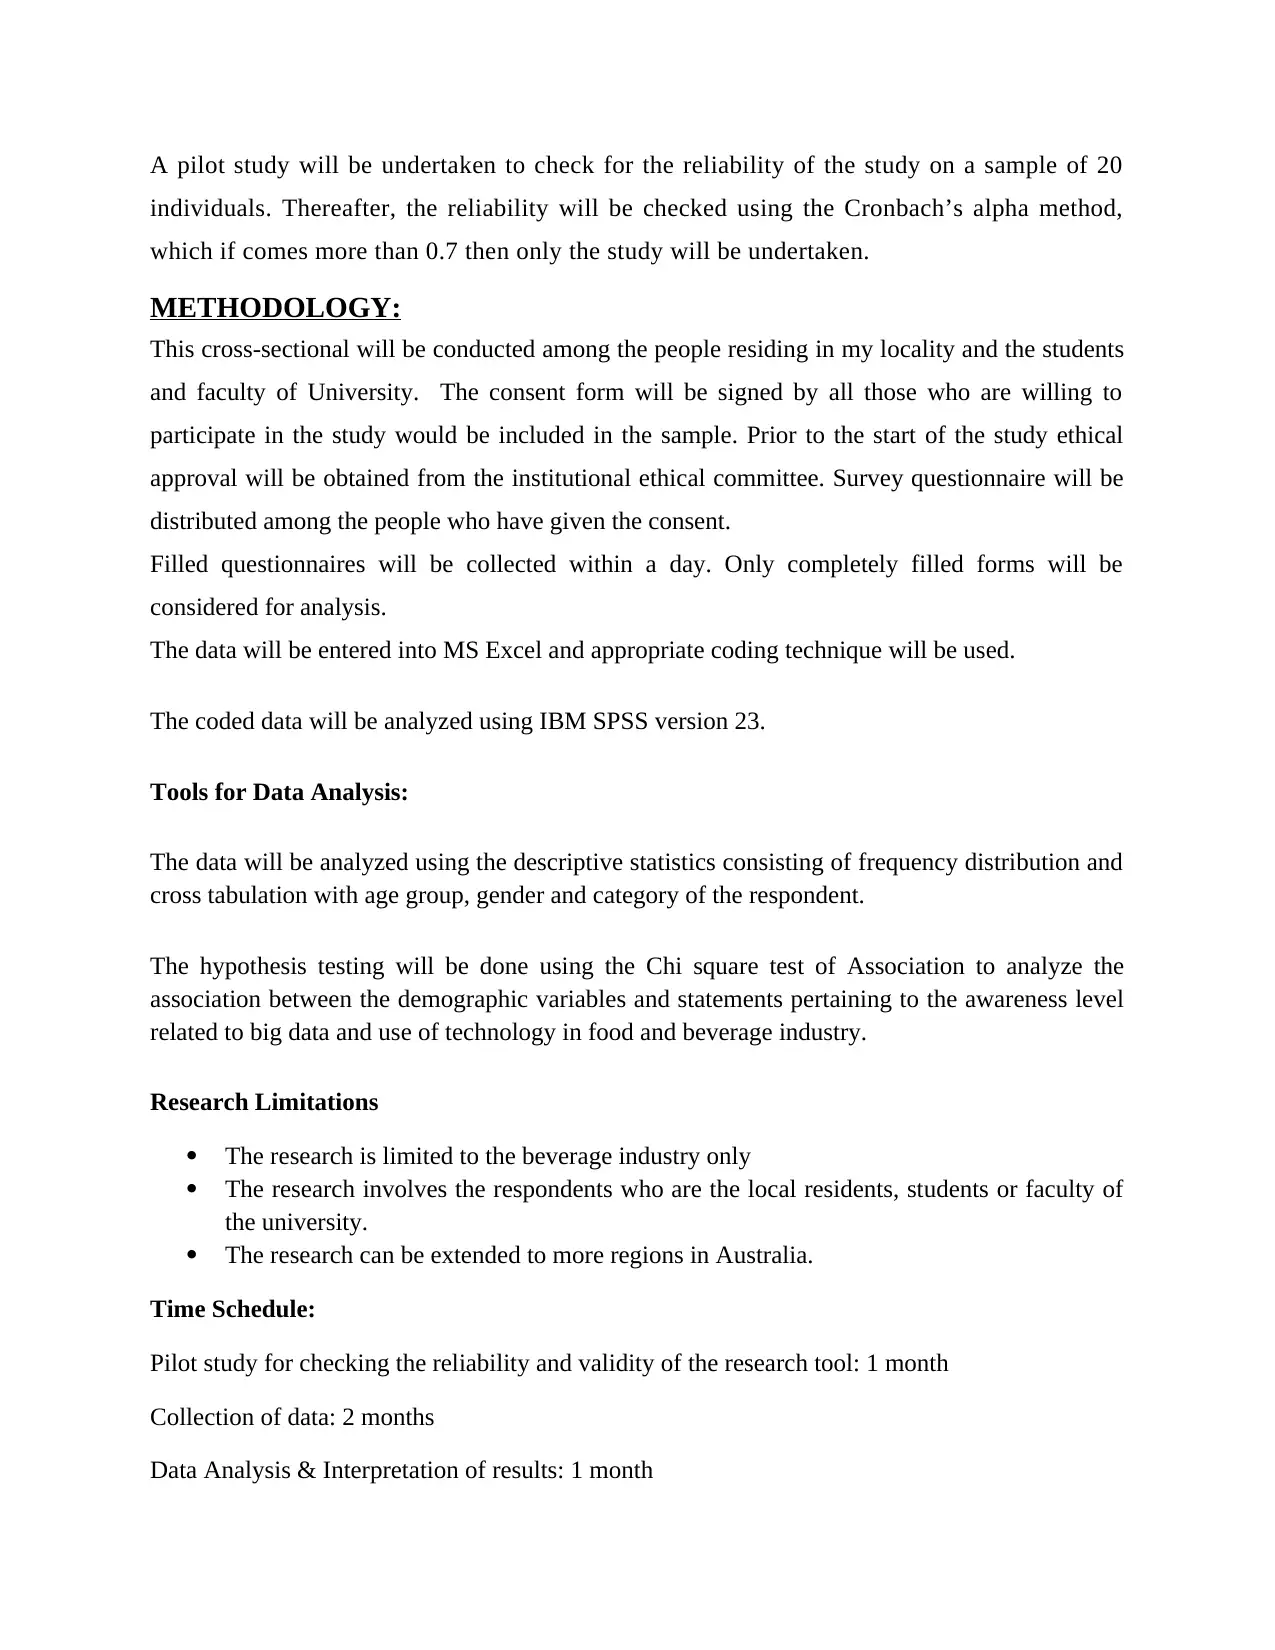
A pilot study will be undertaken to check for the reliability of the study on a sample of 20
individuals. Thereafter, the reliability will be checked using the Cronbach’s alpha method,
which if comes more than 0.7 then only the study will be undertaken.
METHODOLOGY:
This cross-sectional will be conducted among the people residing in my locality and the students
and faculty of University. The consent form will be signed by all those who are willing to
participate in the study would be included in the sample. Prior to the start of the study ethical
approval will be obtained from the institutional ethical committee. Survey questionnaire will be
distributed among the people who have given the consent.
Filled questionnaires will be collected within a day. Only completely filled forms will be
considered for analysis.
The data will be entered into MS Excel and appropriate coding technique will be used.
The coded data will be analyzed using IBM SPSS version 23.
Tools for Data Analysis:
The data will be analyzed using the descriptive statistics consisting of frequency distribution and
cross tabulation with age group, gender and category of the respondent.
The hypothesis testing will be done using the Chi square test of Association to analyze the
association between the demographic variables and statements pertaining to the awareness level
related to big data and use of technology in food and beverage industry.
Research Limitations
The research is limited to the beverage industry only
The research involves the respondents who are the local residents, students or faculty of
the university.
The research can be extended to more regions in Australia.
Time Schedule:
Pilot study for checking the reliability and validity of the research tool: 1 month
Collection of data: 2 months
Data Analysis & Interpretation of results: 1 month
Paraphrase This Document
Need a fresh take? Get an instant paraphrase of this document with our AI Paraphraser
Study will be completed within four months.
Conclusion:
The study will be helpful in analyzing the current level of awareness related to big data and use
of information technology among the population of Australia. The study will help in
understanding the role of socio-demographic variables like age, gender and category of the
respondent education background and occupation status in the awareness level for the big data
and use of technology in beverage industry. The study will generate the awareness among the
people involved in the food and beverage industry for the use of technology in their field which
then can be further used in big data analytics. The study would help in developing the training
module for training the individuals for big data analytics and digitalization for the growth of
Australian economy.
Reference List:
www.restaurant.org (2017). Big data and Restaurants: something to chew on.
Available at https://www.restaurant.org/Downloads/PDFs/BigData [ Accessed 24th
Jan 2018]
www.apicsscc.org. (2017). Exploring the big data revolution. Available at
http://www.apics.org/docs/default-source/industry-content/big-data-report.pdf?
Status=Master [ Accessed 24th Jan 2018]
www.smartbrief.com (2017). Incorporating big data into the beverage business.
Available at https://www.smartbrief.com/original/2017/05/incorporating-big-data-
beverage-business. [ Accessed 24th Jan 2018]
Www. mytechdecisions.com. (2017) Every Business Can Learn from Food and
Beverage Big Data Analytics. Available at https://mytechdecisions.com/it-
infrastructure/every-business-can-learn-food-beverage-big-data-analytics/ [ Accessed
24th Jan 2018]
Alenčikien G et al (2008). Study of Food Products and Beverages Industry. [pdf}
Methodological Centre for Vocational Education and Training. Available at
http://www.kpmpc.lt/Skelbimai/SEK_EN/EN-Maist.%20sekt08.07.30.pdf.
[ Accessed 24th Jan 2018]
www.austrade.gov.au (2018). Australian industry capabilities. Available at
https://www.austrade.gov.au/International/Buy/Australian-industry-capabilities/Food-
and-Beverage [ Accessed 24th Jan 2018]
www.somametrics.com (2018). Big data is transforming the food and beverage
industry. Available at http://www.somametrics.com/big-data-transforming-food-
beverage-industry/ [ Accessed 24th Jan 2018]
www.newsgenaaps.com (2017). 7 Uses of Big Data in Food and Beverages Industry.
Available at https://www.newgenapps.com/blog/7-uses-of-big-data-in-food-and-
beverages-industry [ Accessed 24th Jan 2018]
http://www.australianbeverages.org (2013). About us. Available at
http://www.australianbeverages.org/about-us/ [ Accessed 24th Jan 2018]
www.industry.gov.au (2017). The Digital Economy: Opening up the conversation.
Available at
https://www.industry.gov.au/innovation/Digital-Economy/Documents/Digital-
Economy-Strategy-Consultation-Paper.pdf [ Accessed 24th Jan 2018]
Altex Soft Inc. [US] (2017).Digital Transformation Stories: How Starbucks, Walmart
and Sephora Revolutionize Retail Industry. Available at
https://www.altexsoft.com/blog/business/digital-transformation-stories-how-
starbucks-walmart-and-sephora-revolutionize-retail-industry/ [ Accessed 24th Jan
2018]
Australian Government. Department of Finance and Deregulation (2013) .The
Australian Public Service Big Data Strategy Improved understanding through
enhanced data-analytics capability. Available at
https://www.finance.gov.au/sites/default/files/Big-Data-Strategy.pdf [ Accessed 24th
Jan 2018]
Harvard Business School (2015). Connectivity and Coffee. Available at
https://digit.hbs.org/submission/connectivity-and-coffee/ [ Accessed 24th Jan 2018]
Marketing Week (2015).How Starbucks is using technology to boost revenue.
Available at https://www.marketingweek.com/2015/10/30/how-starbucks-is-using-
technology-to-boost-revenue/ [ Accessed 24th Jan 2018]
Marketing Week (2016).Starbucks lets customers order a coffee via a chatbot.
Retrieved from https://www.marketingweek.com/2016/12/07/starbucks-ai-chatbot/
[ Accessed 24th Jan 2018]
ACOLA (2015).Technology and Australia’s Future. Available at
https://www.acola.org.au/PDF/SAF05/SAF05_Report_web_17Sept.pdf [ Accessed
24th Jan 2018]
Deloitte (2017). Australia’s Digital Pulse Policy priorities to fuel Australia’s digital
workforce boom. Available at
https://www2.deloitte.com/content/dam/Deloitte/au/Documents/Economics/deloitte-
au-economics-australias-digital-pulse-2017-010617.pdf [ Accessed 24th Jan 2018]
Hulley SB, Cummings SR, Browner WS, Grady D, Newman TB. (2013). Designing
clinical research: an epidemiologic approach. 4th ed. Philadelphia, PA: Lippincott
Williams & Wilkins; pp 79.
⊘ This is a preview!⊘
Do you want full access?
Subscribe today to unlock all pages.
Trusted by 1+ million students worldwide
1 out of 9
Related Documents


Your All-in-One AI-Powered Toolkit for Academic Success.
+13062052269
info@desklib.com
Available 24*7 on WhatsApp / Email
![[object Object]](/_next/static/media/star-bottom.7253800d.svg)
Unlock your academic potential
Copyright © 2020–2026 A2Z Services. All Rights Reserved. Developed and managed by ZUCOL.