University Essay: Technical Analysis and Efficient Market Hypothesis
VerifiedAdded on 2023/04/23
|13
|2912
|205
Essay
AI Summary
This essay provides a detailed analysis of technical analysis in the context of financial markets, focusing on its methods, tools, and application in predicting price movements. It explores the core principles of technical analysis, including the use of historical price data, charts, and patterns to identify trends and make trading decisions. The essay also critically examines the Efficient Market Hypothesis (EMH) and its implications for technical analysis, discussing the different forms of EMH (strong, semi-strong, and weak) and their impact on the ability to generate profits using technical strategies. The essay further delves into specific technical analysis tools such as Simple Moving Averages (SMA), Moving Average Convergence Divergence (MACD), Relative Strength Index (RSI), and Head and Shoulder patterns, illustrating their application with examples. The discussion includes the role of historical data, stationary processes, and empirical evidence supporting the use of technical analysis. The paper concludes by summarizing the key features of technical analysis, including its applicability across various markets and assets, and discusses the autocorrelation test in the context of market efficiency and volatility.

Running head: TECHNICAL ANALYSIS
Technical Analysis
Name of the Student:
Name of the University:
Author’s Note:
Technical Analysis
Name of the Student:
Name of the University:
Author’s Note:
Paraphrase This Document
Need a fresh take? Get an instant paraphrase of this document with our AI Paraphraser
1TECHNICAL ANALYSIS
“Technical analysis, the prediction of price movements based on past price
movements, has been shown to generate statistically significant profits despite
its incompatibility with most economists’ notions of efficient markets”.
Introduction
Technical Analysis is based on the application of software application that allows the
usage of the past data prices and incorporates the same for the purpose of the analysis of the
stock price movements. Several Indicators and Patterns is the common tool and approach that
is used for the classification and identification of the various trends in the stock market (El-
Ansary and Mohssen 2017). There are wide variety of charts and tools that are applied by
analysts and experts for forecasting and assessing the trend movement in the share price of
companies and indexes (Chen, Zhou and Dai 2015). It is used widely used and applicable for
commodities, stocks, indices, futures and other tradable instrument where the price data of
the financial instrument is available and the same is influenced with the help of the demand
and supply created in the overall markets.
Fundamental Analysis on the other hand deals with analysing the company based on
the financial statements of the company, financial performance and the future outlook of the
company under which the operations of the company is based. Where technical analysis
includes charts and market forces (demand and supply), fundamental analysis includes ratios,
financial statements, news and outlook for the company.
Efficient Market Hypothesis
Efficient Market Hypothesis says that the share price today reflected in the market is
full potential share price whereby informational efficiency occurs in the capital market. This
means that the predictions, expectations and historical prices movements are already
2TECHNICAL ANALYSIS
incorporated in the form of current share price of the company (Jiang, Tong and Song 2017).
A Key assumption made by the EMH is that it is not possible to beat the market and earn
abnormal profits in the market. The EMH defines the market structure into three broad
perspective as Strong Form EMH, Semi-Strong EMH and Weak Form EMH.
In accordance with the Efficient Market Hypothesis it is to be noted that in case of
Strong Form EMH nothing can be done to earn profit as all the forecast, predictions and
information’s are already incorporated in the share price of the company. In case of Semi-
Strong EMH insider information can allow the investors ear abnormal profits. In case of
weak form efficiency past prices data can be used for predicting the value of the stocks.
Technical Analysis can be used for identifying the trends and patterns followed by the share
price, but on the other hand it is also important to consider the consistency of price data.
Role of Historical Data
The only crux between the two common forms discussed, which the EMH is and
technical analysis is the application of the historical data for the purpose of the analysis. It is
often argued and said that patterns and charts followed by an asset or security in the past is of
great importance (Ye et al. 2016). However, identification of these patterns and charts are the
crucial steps in technical analysis which helps the investors in identifying the trend that is
followed which then becomes easier for the purpose of trading. For earning above average
market return it is necessary for the investors and analysts to identify and analyse the correct
data at correct time for successfully executing a trade.
Stationary in the historical data is of key importance which should prevail for the
purpose of trading and analysis. Stationary Process in Statistics and data analysis is a
stochastic process where the mean & variance of the data do not change consequently over a
period of time it is stable over the trend period (Edwards, Magee and Bassetti 2018).
⊘ This is a preview!⊘
Do you want full access?
Subscribe today to unlock all pages.
Trusted by 1+ million students worldwide
3TECHNICAL ANALYSIS
Role of Technical Analysis
There are various techniques and strategy applied for the purpose of the analysis of
the stock prices of the company and the same should be taken into consideration for the
purpose of the analysis. The process of technical analysis is to carry out price forecasting for
the assets or index thereby anticipating the price level of the shares (Cervelló-Royo, Guijarro
and Michniuk 2015). Price and Volume charts and the movement in the same are some of the
key tools that are used in the forecasting of share prices. Sound Investment decision can be
better made when the trading decision is based on multiple factors and approaches and when
the validity of the trading decisions or strategy is already made. Obviously, it is to be noted
that technical analysis cannot really allow the movement or the prediction of the share prices
of the company but it can instead help the investors or the analyst predict the price movement
of the share price of the company (Nazário et al. 2017).
Combination of the price data of the company or the asset thereby combining the
various aspects of the technical aspects of the stocks like the open price, close price, high
price and low price and the volume of that particular data are taken into consideration for the
purpose of analysis. Timeframe of trading and trading strategy is the key factor while doing
the analysis it is important to define the term period of investment so that strategy and trading
could be done in accordance with the same (Nguyen and Shirai 2015). The timeframe of
investing could be intraday (1 Minute, 5 Minute, 30 Minute or so which is depended on the
trading strategy and the opinion about the stock or asset. Technical Analysis has always given
proven results and better trading results as the same is based on the analysis of the software’s
and other key technical assumption that allows the investors or the analyst identify and
execute a trade accordingly (Arthur 2018). In case of efficient market common technical
analysis tool application such as resistance and support level is done for identification of the
trends and prediction of the share price movement. If the share price falls below the
Paraphrase This Document
Need a fresh take? Get an instant paraphrase of this document with our AI Paraphraser
4TECHNICAL ANALYSIS
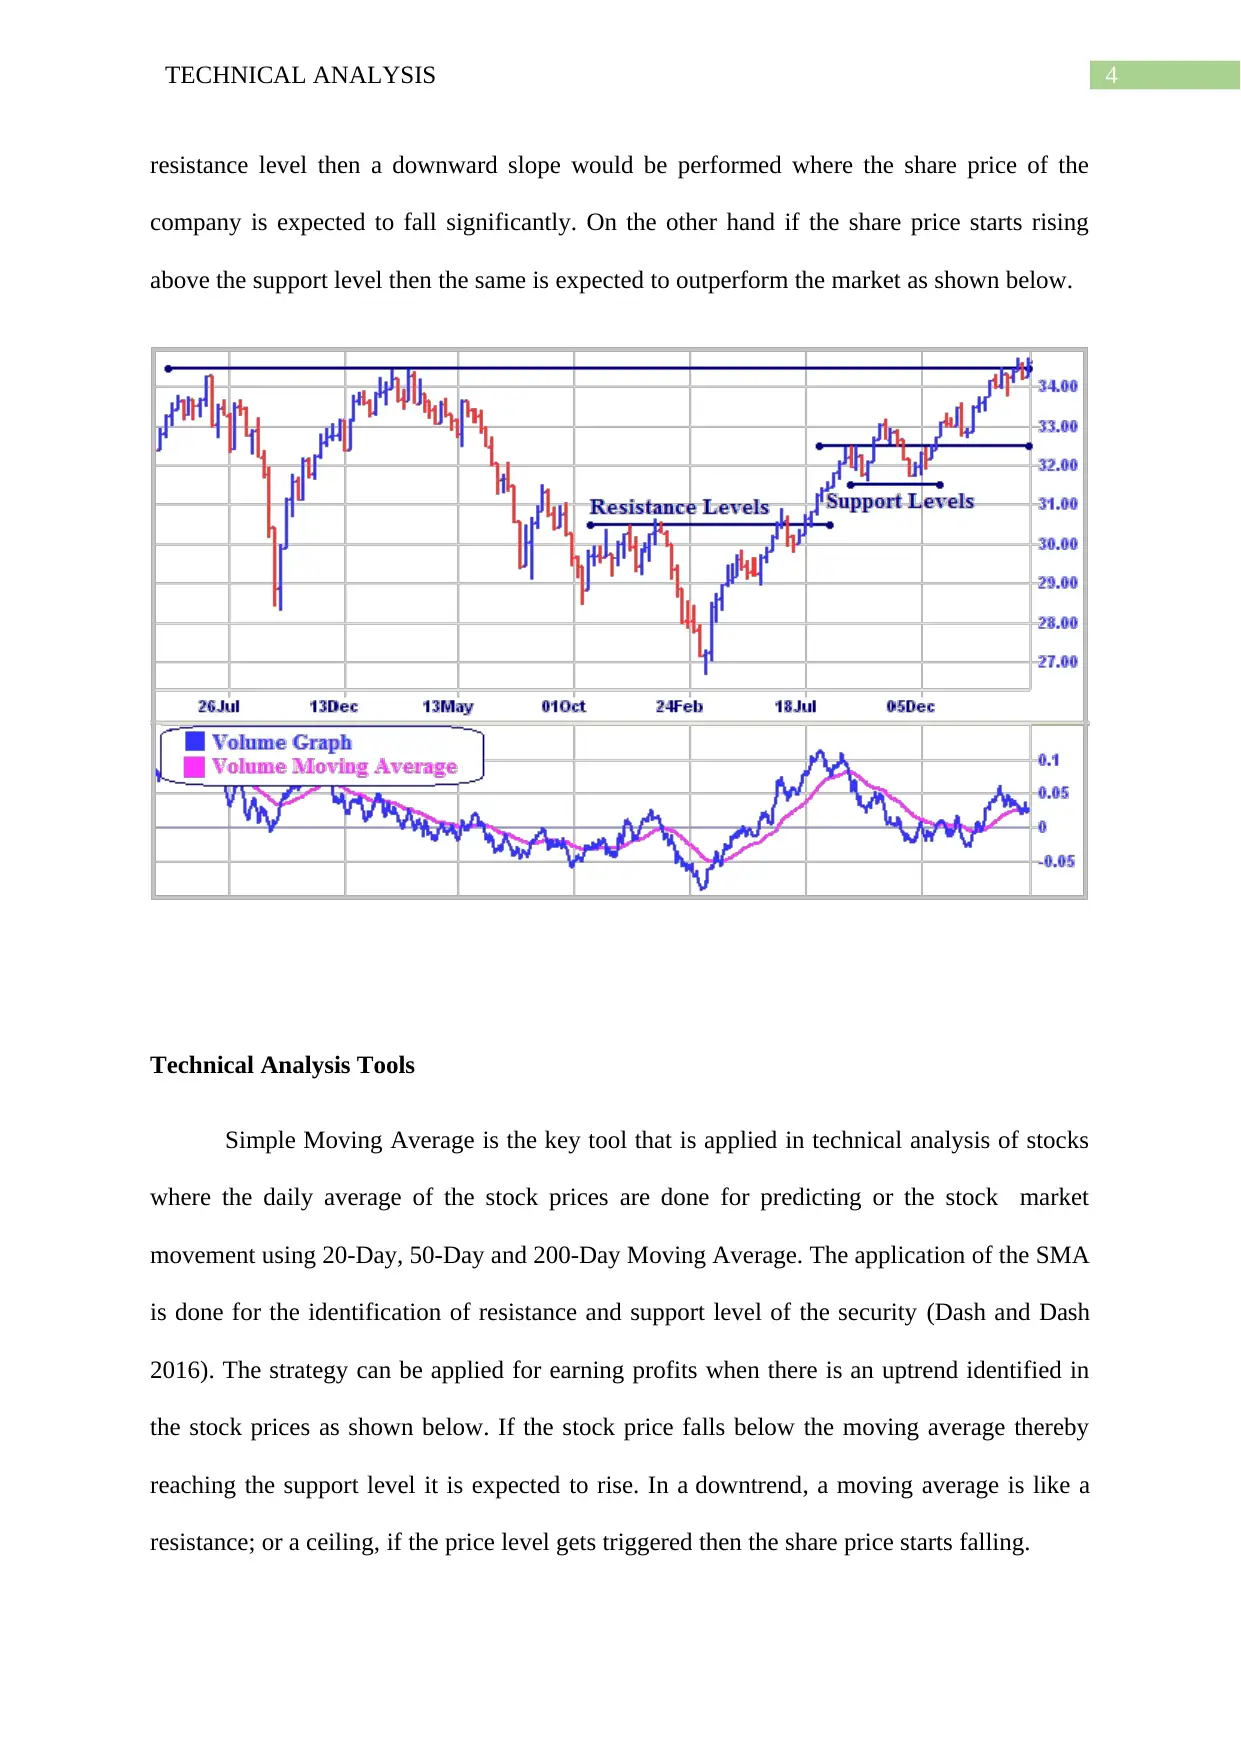
resistance level then a downward slope would be performed where the share price of the
company is expected to fall significantly. On the other hand if the share price starts rising
above the support level then the same is expected to outperform the market as shown below.
Technical Analysis Tools
Simple Moving Average is the key tool that is applied in technical analysis of stocks
where the daily average of the stock prices are done for predicting or the stock market
movement using 20-Day, 50-Day and 200-Day Moving Average. The application of the SMA
is done for the identification of resistance and support level of the security (Dash and Dash
2016). The strategy can be applied for earning profits when there is an uptrend identified in
the stock prices as shown below. If the stock price falls below the moving average thereby
reaching the support level it is expected to rise. In a downtrend, a moving average is like a
resistance; or a ceiling, if the price level gets triggered then the share price starts falling.
5TECHNICAL ANALYSIS
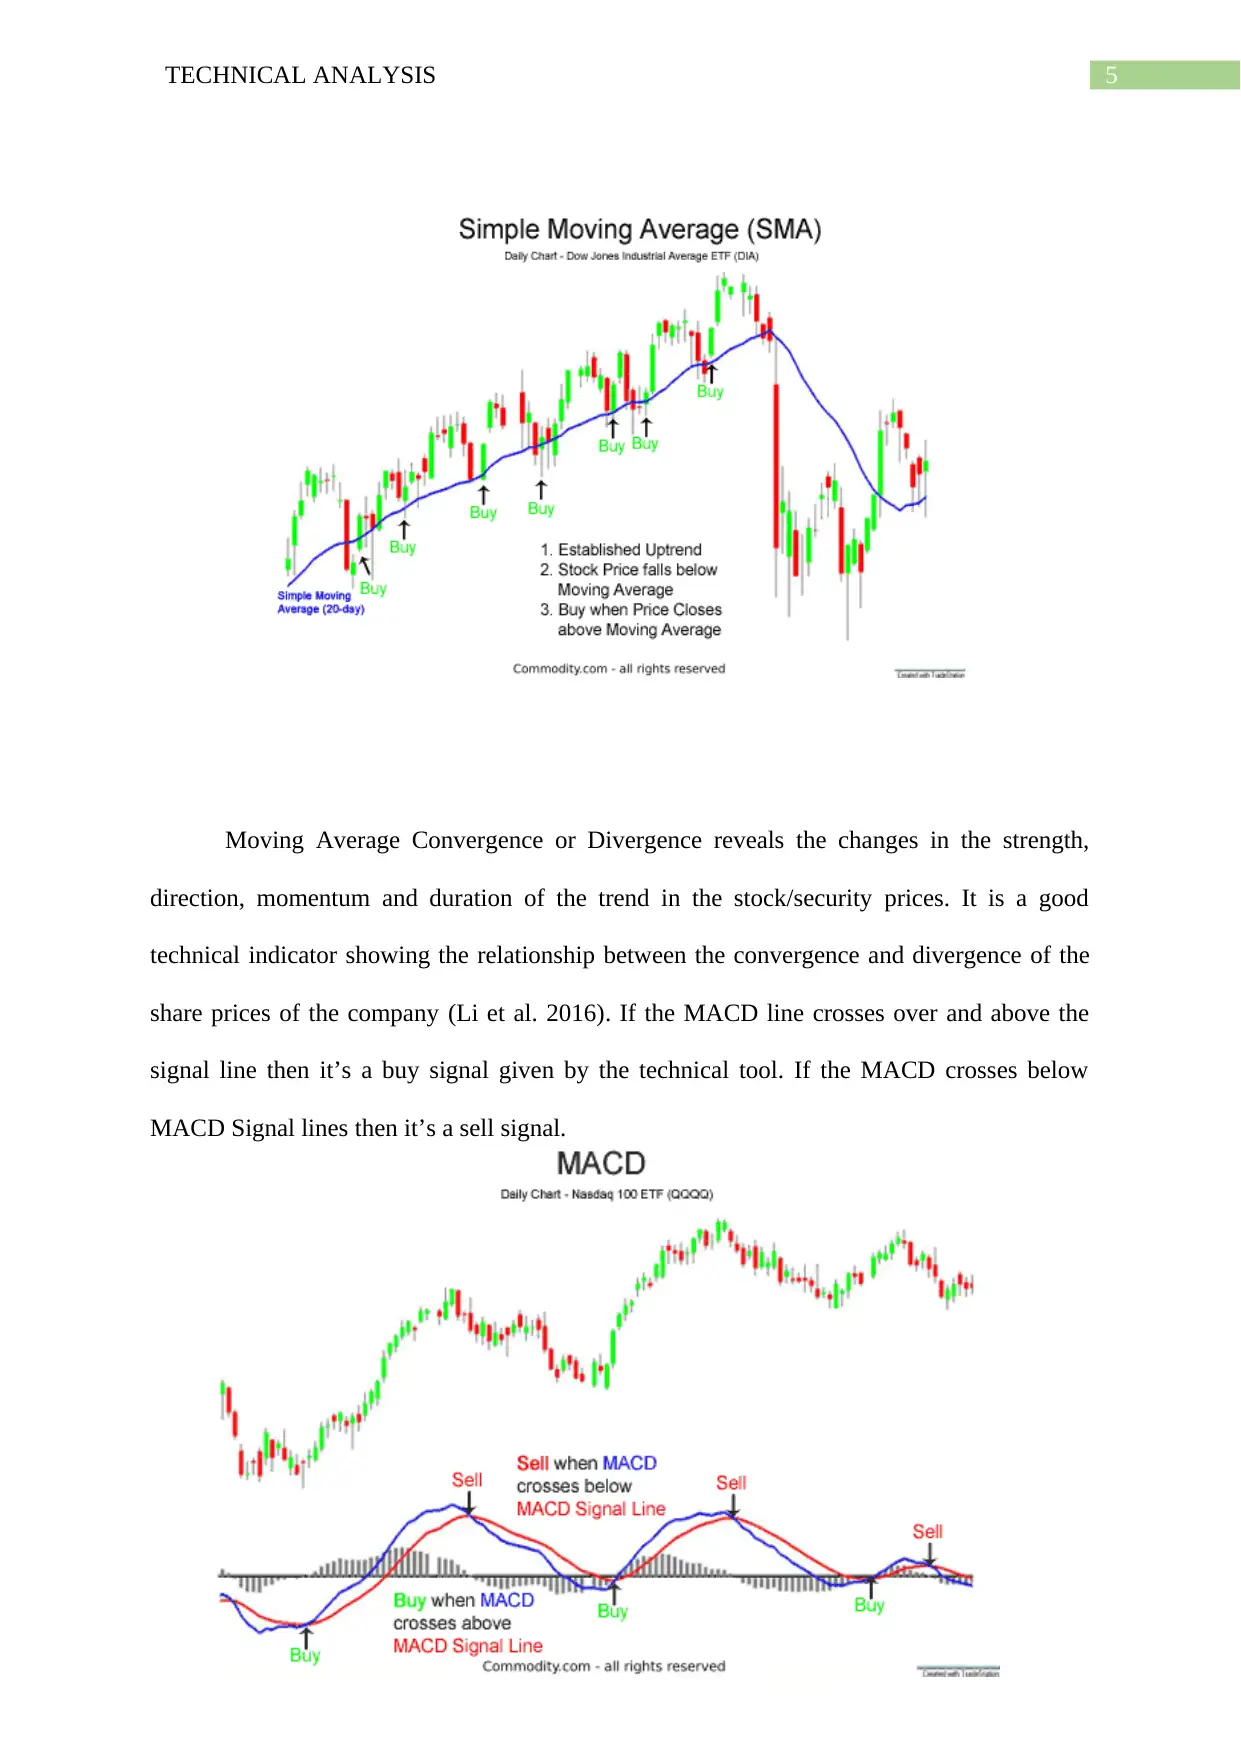
Moving Average Convergence or Divergence reveals the changes in the strength,
direction, momentum and duration of the trend in the stock/security prices. It is a good
technical indicator showing the relationship between the convergence and divergence of the
share prices of the company (Li et al. 2016). If the MACD line crosses over and above the
signal line then it’s a buy signal given by the technical tool. If the MACD crosses below
MACD Signal lines then it’s a sell signal.
⊘ This is a preview!⊘
Do you want full access?
Subscribe today to unlock all pages.
Trusted by 1+ million students worldwide
6TECHNICAL ANALYSIS
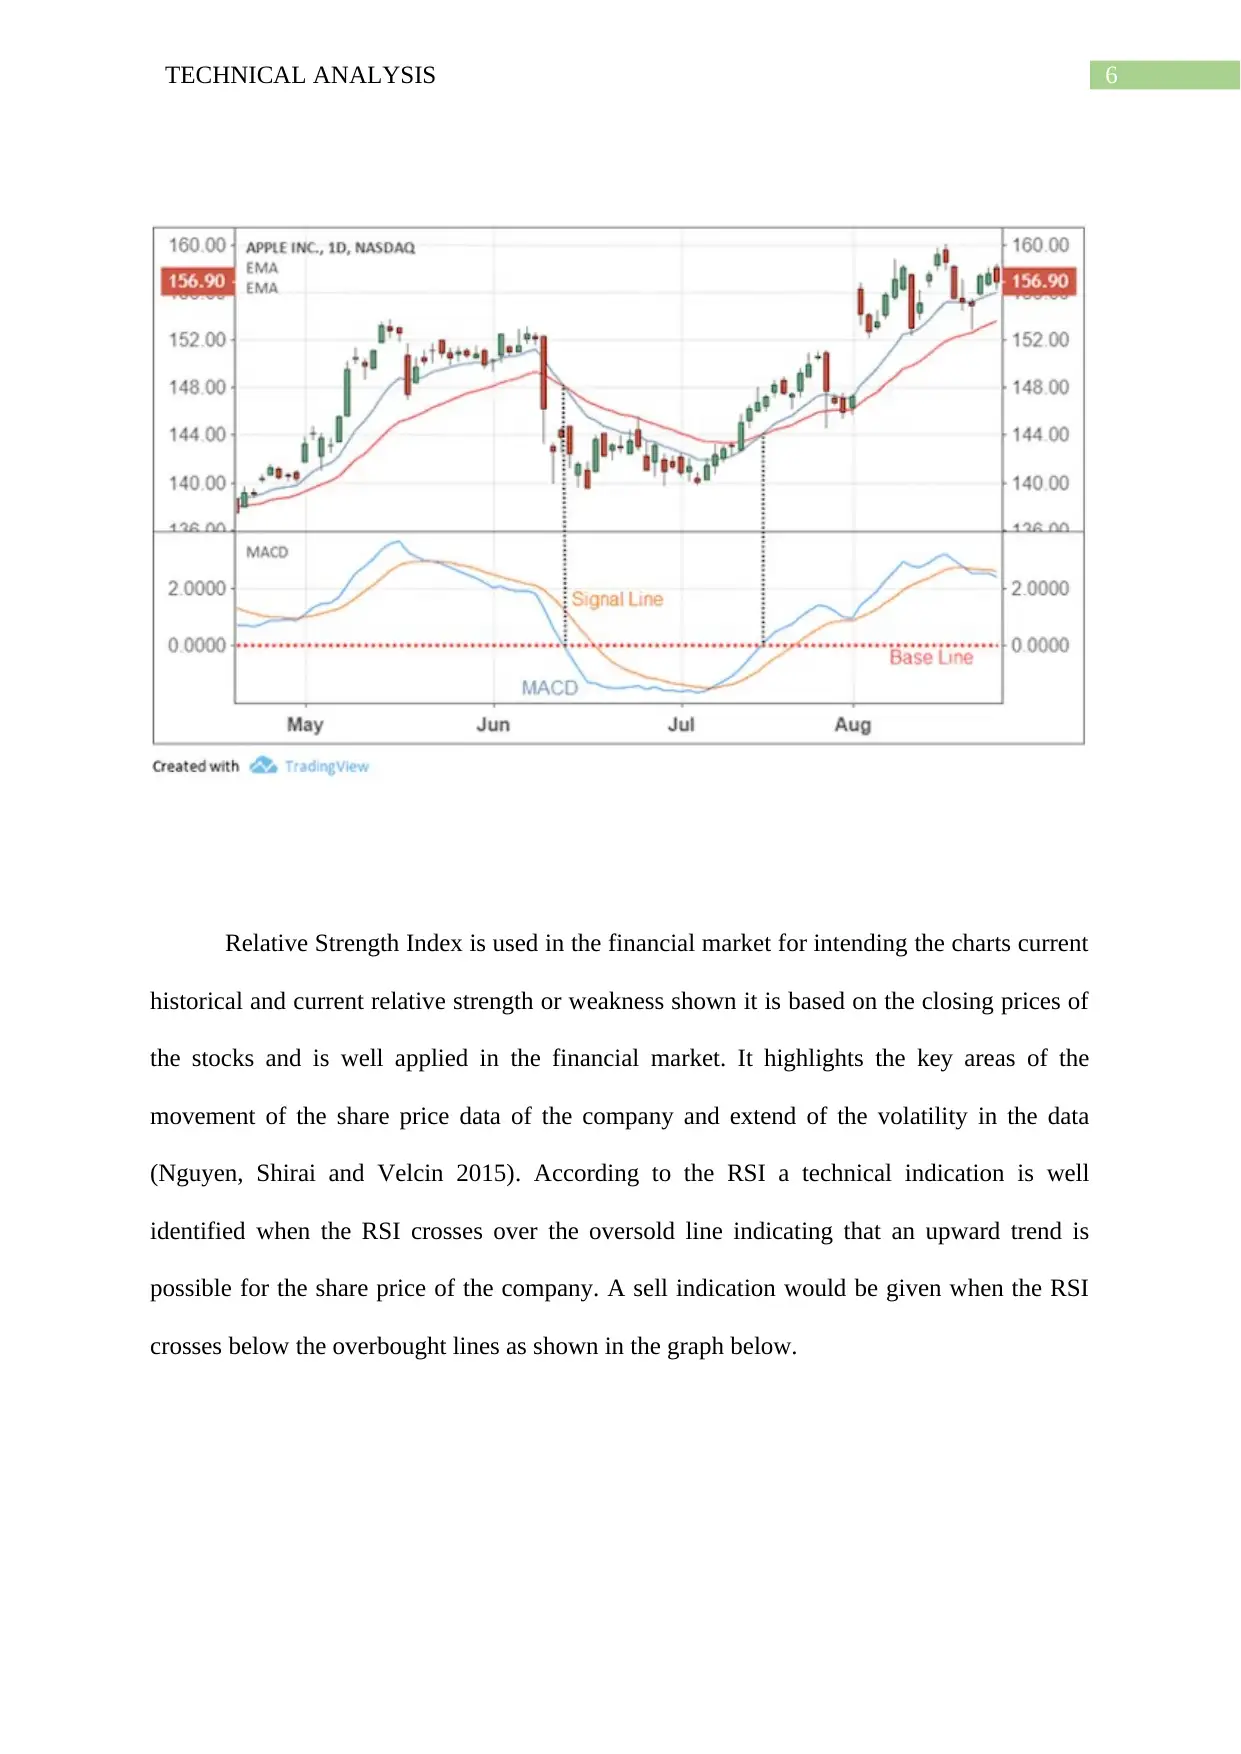
Relative Strength Index is used in the financial market for intending the charts current
historical and current relative strength or weakness shown it is based on the closing prices of
the stocks and is well applied in the financial market. It highlights the key areas of the
movement of the share price data of the company and extend of the volatility in the data
(Nguyen, Shirai and Velcin 2015). According to the RSI a technical indication is well
identified when the RSI crosses over the oversold line indicating that an upward trend is
possible for the share price of the company. A sell indication would be given when the RSI
crosses below the overbought lines as shown in the graph below.
Paraphrase This Document
Need a fresh take? Get an instant paraphrase of this document with our AI Paraphraser
7TECHNICAL ANALYSIS
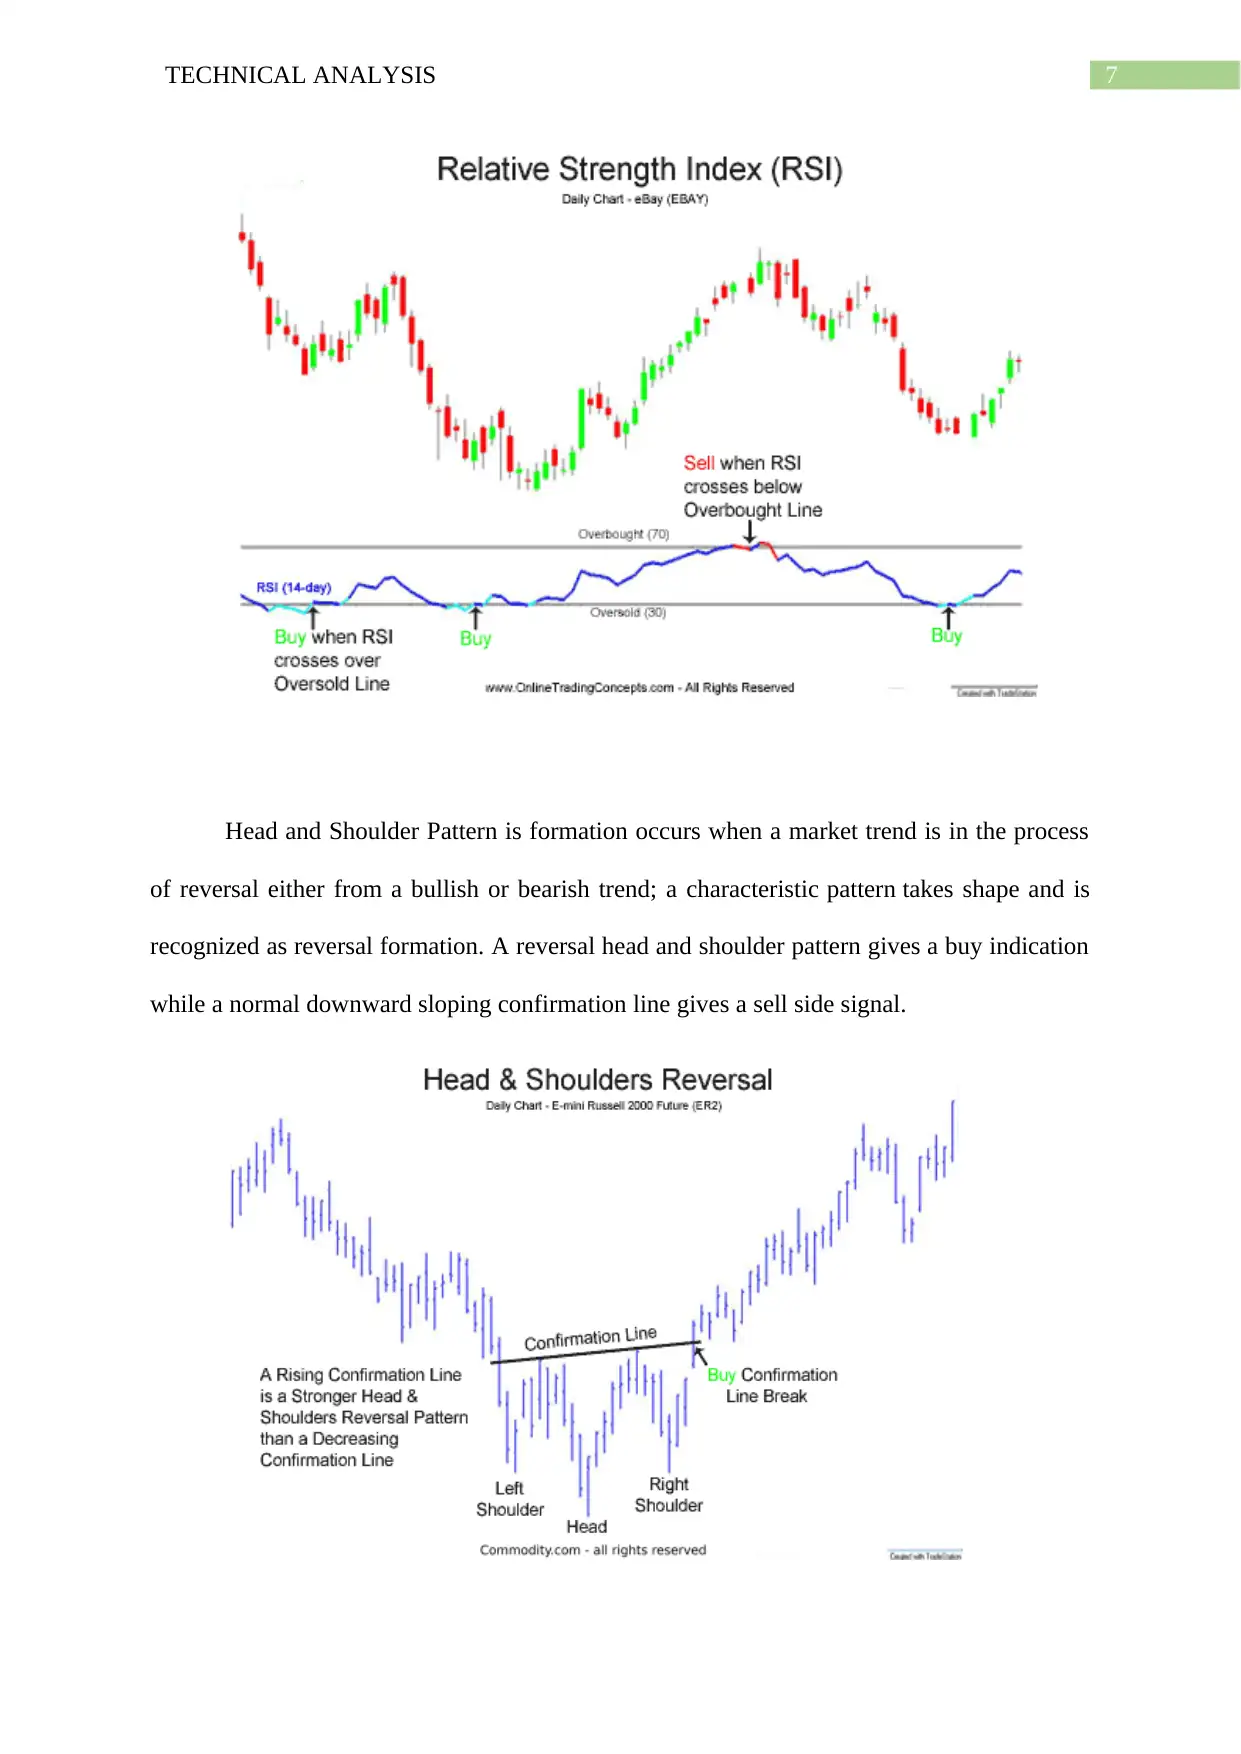
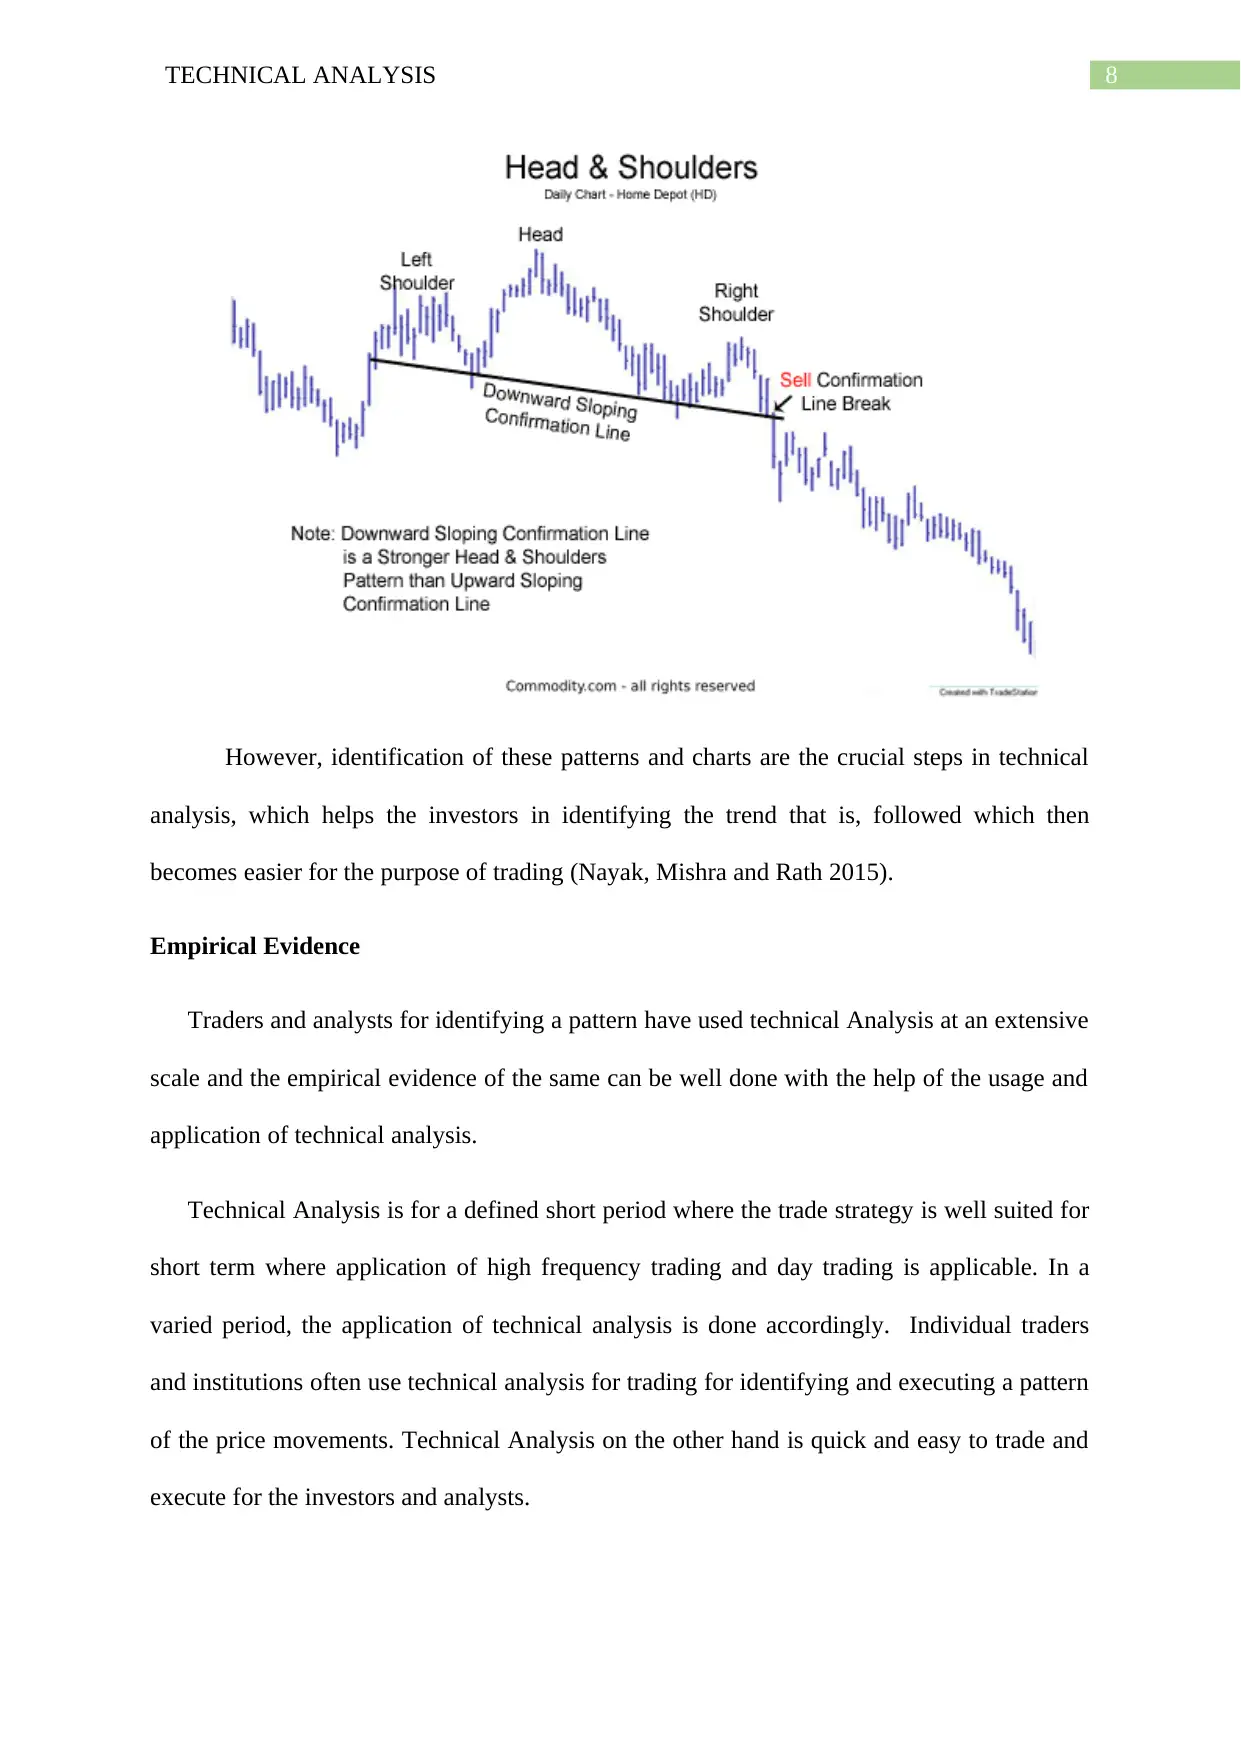
Head and Shoulder Pattern is formation occurs when a market trend is in the process
of reversal either from a bullish or bearish trend; a characteristic pattern takes shape and is
recognized as reversal formation. A reversal head and shoulder pattern gives a buy indication
while a normal downward sloping confirmation line gives a sell side signal.
8TECHNICAL ANALYSIS
However, identification of these patterns and charts are the crucial steps in technical
analysis, which helps the investors in identifying the trend that is, followed which then
becomes easier for the purpose of trading (Nayak, Mishra and Rath 2015).
Empirical Evidence
Traders and analysts for identifying a pattern have used technical Analysis at an extensive
scale and the empirical evidence of the same can be well done with the help of the usage and
application of technical analysis.
Technical Analysis is for a defined short period where the trade strategy is well suited for
short term where application of high frequency trading and day trading is applicable. In a
varied period, the application of technical analysis is done accordingly. Individual traders
and institutions often use technical analysis for trading for identifying and executing a pattern
of the price movements. Technical Analysis on the other hand is quick and easy to trade and
execute for the investors and analysts.
⊘ This is a preview!⊘
Do you want full access?
Subscribe today to unlock all pages.
Trusted by 1+ million students worldwide
9TECHNICAL ANALYSIS
Key Features of Technical Analysis Output
A key feature of the technical analysis is that it can be applied in all kinds of market and
assets as the price data is the important components that is taken into consideration for the
purpose of the analysis of the stocks. The price movement prediction by technical analysis is
an important factor as the prediction of the share price is always quoted in a range where the
share price of the company could be around $58-$62. The predicted price with help of the
technical analysis could be well done as the price range has an upper limit as well as a lower
limit whereby better forecast and prediction of the movement of the share prices can be done.
However, on the other hand side the application of other approaches like fundamental can be
well done with the help of the internal and external accounting and economic factors of the
company where the operations of the company is based. The analysis would give a certain
target price of say $60 for the stock rather than a price range.
Autocorrelation Test in Technical Analysis
The autocorrelation test and run test- which will be test conducted in the form of runs
up and down, for the distribution of the can be done in order to identify the trend of the
movement and the same can be applied in a weak form efficient market. The conditional
variance of the stock is not constant over a period where the tests for linear autocorrelation
has not shown proven results. In the same constant where the variance of the stocks were not
constant Autoregressive Conditional Heteroscedasticity (ARCH) and Generalised ARCH
Model were developed. Equity Return calculated by taking the prices of the equity are found
to have time dependent conditional variance where volatility in the data could be taken care
by the ARCH Models in the time series of return. However, it is crucial to note that while
conducting the test if presence of ARCH is noted the same can result in misleading
inferences.
Paraphrase This Document
Need a fresh take? Get an instant paraphrase of this document with our AI Paraphraser
10TECHNICAL ANALYSIS
Conclusion
Several technical charts and patterns can be used in the capital market for the purpose
of identifying the trade chart and patterns and accordingly executing the trade. In the context
of Efficient Market Hypothesis, the application of technical analysis was analysed. There are
certain individuals and institutions that apply various Technical Analysis method for the
purpose of Technical Analysis. Time-frame is an important factor that needs to be identified
for the purpose of trading as well as the trading idea. Hence, for shorter period and varied
time period analysis of the security investments could be better predicted and analysed with
the help of the same.
11TECHNICAL ANALYSIS
References
Ahmadi, E., Jasemi, M., Monplaisir, L., Nabavi, M.A., Mahmoodi, A. and Jam, P.A., 2018.
New efficient hybrid candlestick technical analysis model for stock market timing on the
basis of the Support Vector Machine and Heuristic Algorithms of Imperialist Competition
and Genetic. Expert Systems with Applications, 94, pp.21-31.
Arthur, W.B., 2018. Asset pricing under endogenous expectations in an artificial stock
market. In The economy as an evolving complex system II (pp. 31-60). CRC Press.
Cervelló-Royo, R., Guijarro, F. and Michniuk, K., 2015. Stock market trading rule based on
pattern recognition and technical analysis: Forecasting the DJIA index with intraday data.
Expert systems with Applications, 42(14), pp.5963-5975.
Chen, K., Zhou, Y. and Dai, F., 2015, October. A LSTM-based method for stock returns
prediction: A case study of China stock market. In 2015 IEEE International Conference on
Big Data (Big Data) (pp. 2823-2824). IEEE.
Dash, R. and Dash, P.K., 2016. A hybrid stock trading framework integrating technical
analysis with machine learning techniques. The Journal of Finance and Data Science, 2(1),
pp.42-57.
Edwards, R.D., Magee, J. and Bassetti, W.C., 2018. Technical analysis of stock trends. CRC
press.
El-Ansary, O. and Mohssen, D., 2017. Testing the Predicting Ability of Technical Analysis
Classical Patterns in the Egyptian Stock Market. Accounting and Finance Research, 6(3),
p.94.
Jiang, F., Tong, G. and Song, G., 2017. Technical Analysis Profitability Without Data
Snooping Bias: Evidence from Chinese Stock Market. International Review of Finance.
⊘ This is a preview!⊘
Do you want full access?
Subscribe today to unlock all pages.
Trusted by 1+ million students worldwide
1 out of 13
Related Documents


Your All-in-One AI-Powered Toolkit for Academic Success.
+13062052269
info@desklib.com
Available 24*7 on WhatsApp / Email
![[object Object]](/_next/static/media/star-bottom.7253800d.svg)
Unlock your academic potential
Copyright © 2020–2026 A2Z Services. All Rights Reserved. Developed and managed by ZUCOL.