ACCG Module: Accounting Analysis & Valuation Statement for TEN

Verified

Added on  2023/06/11

|8
|1608
|305
Report
AI Summary
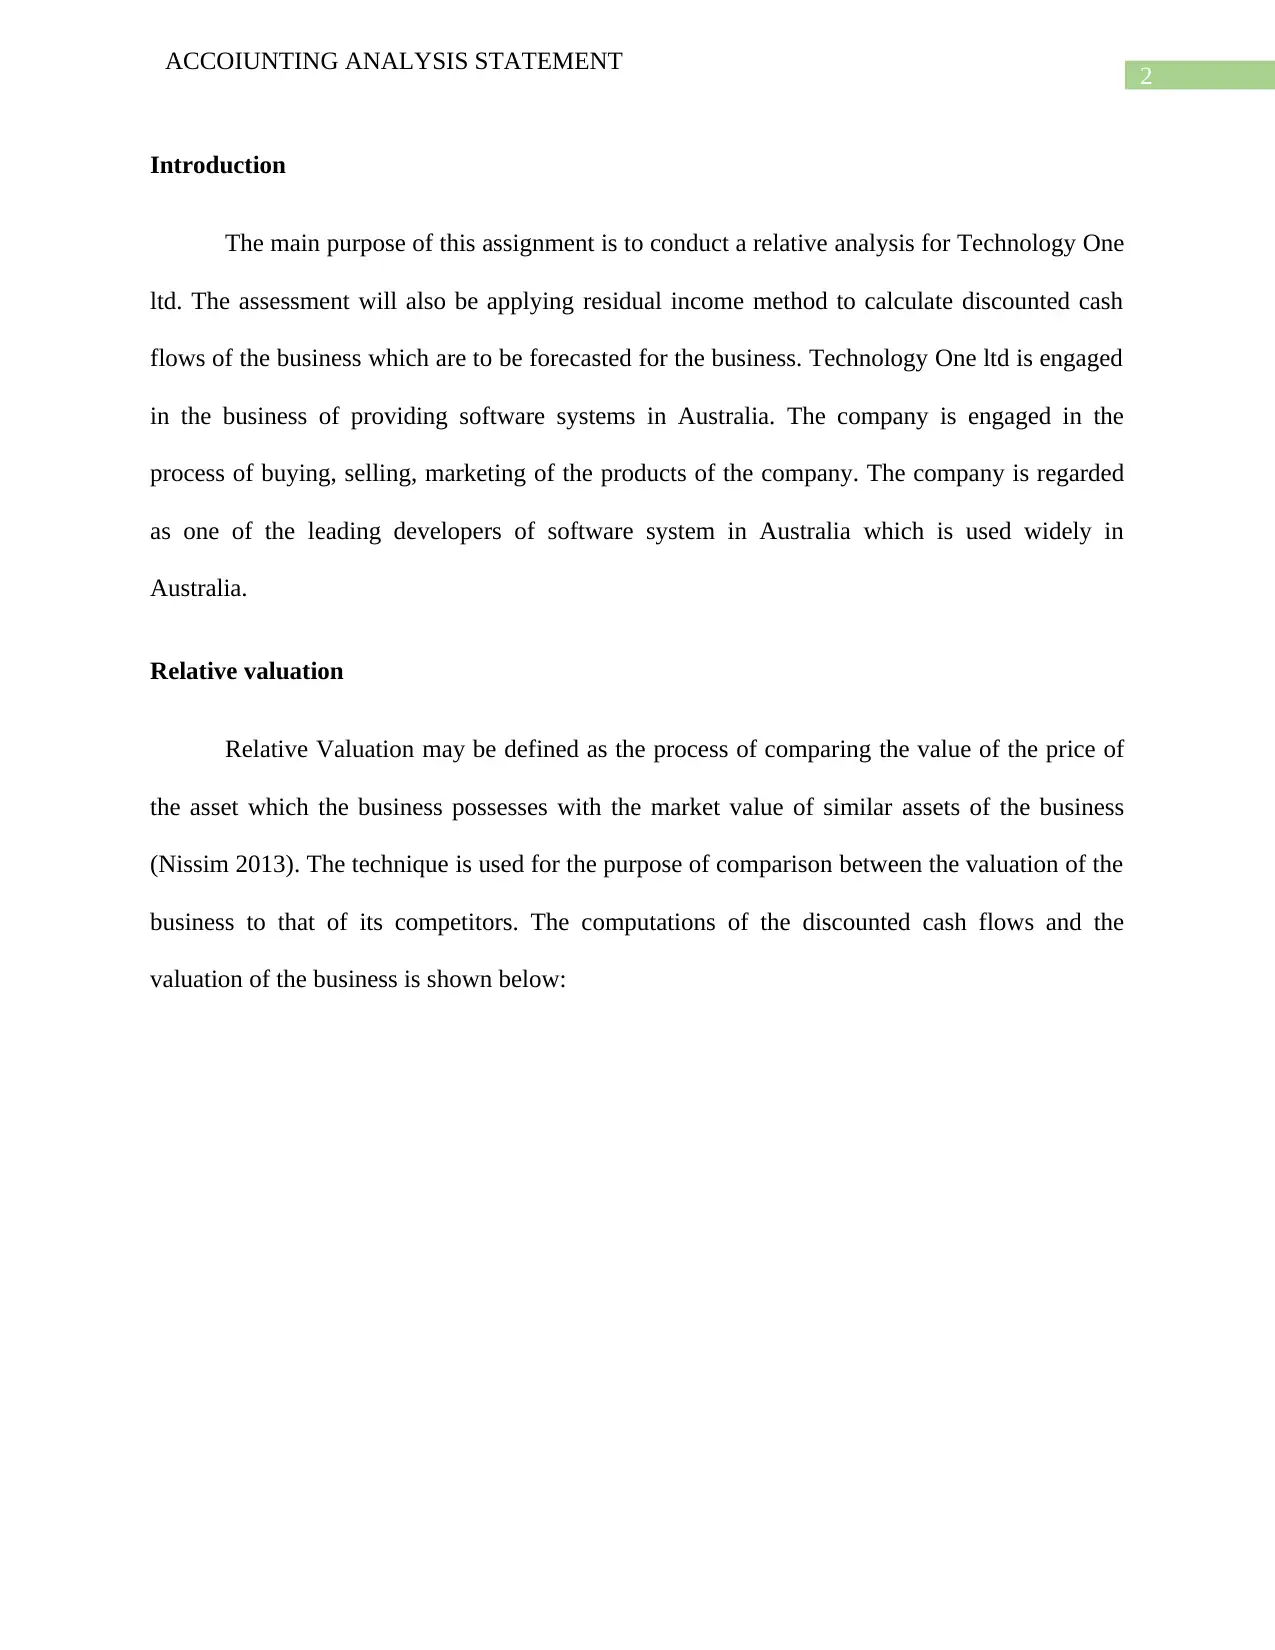
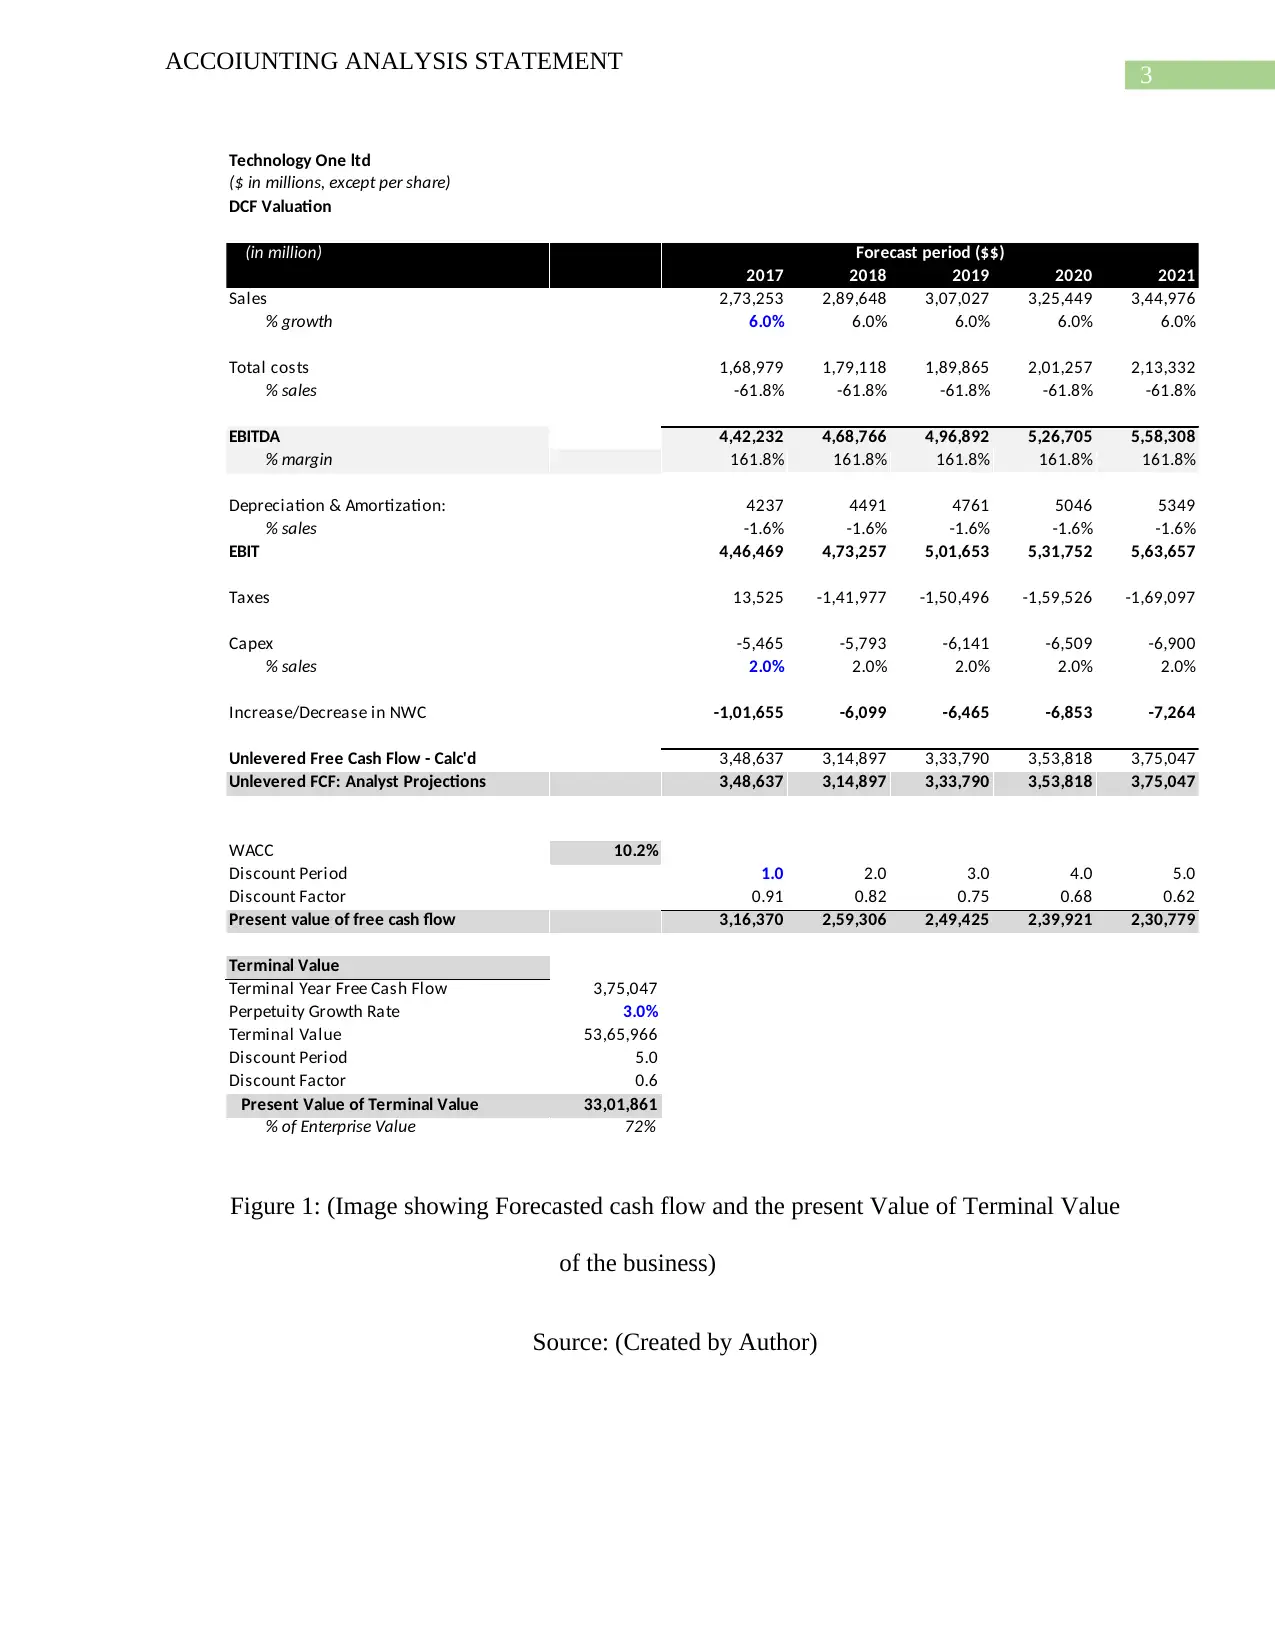
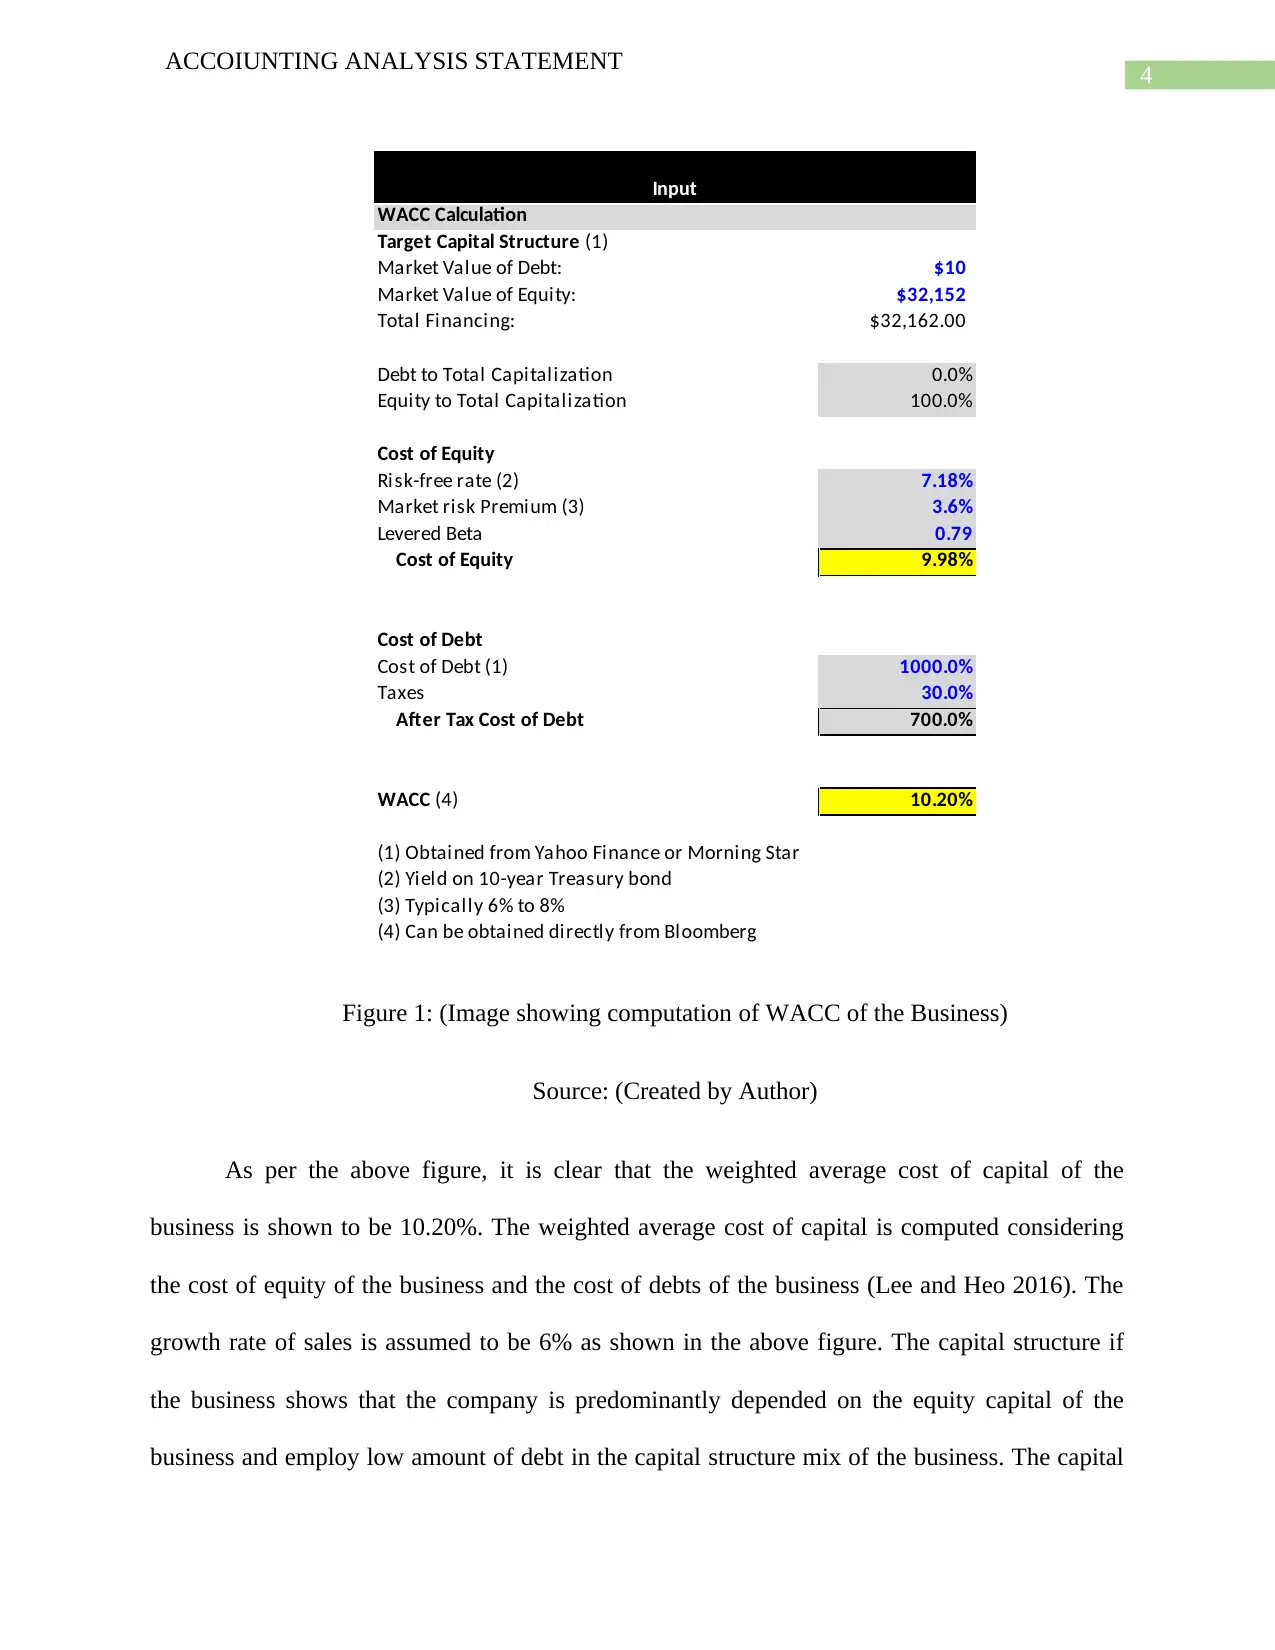
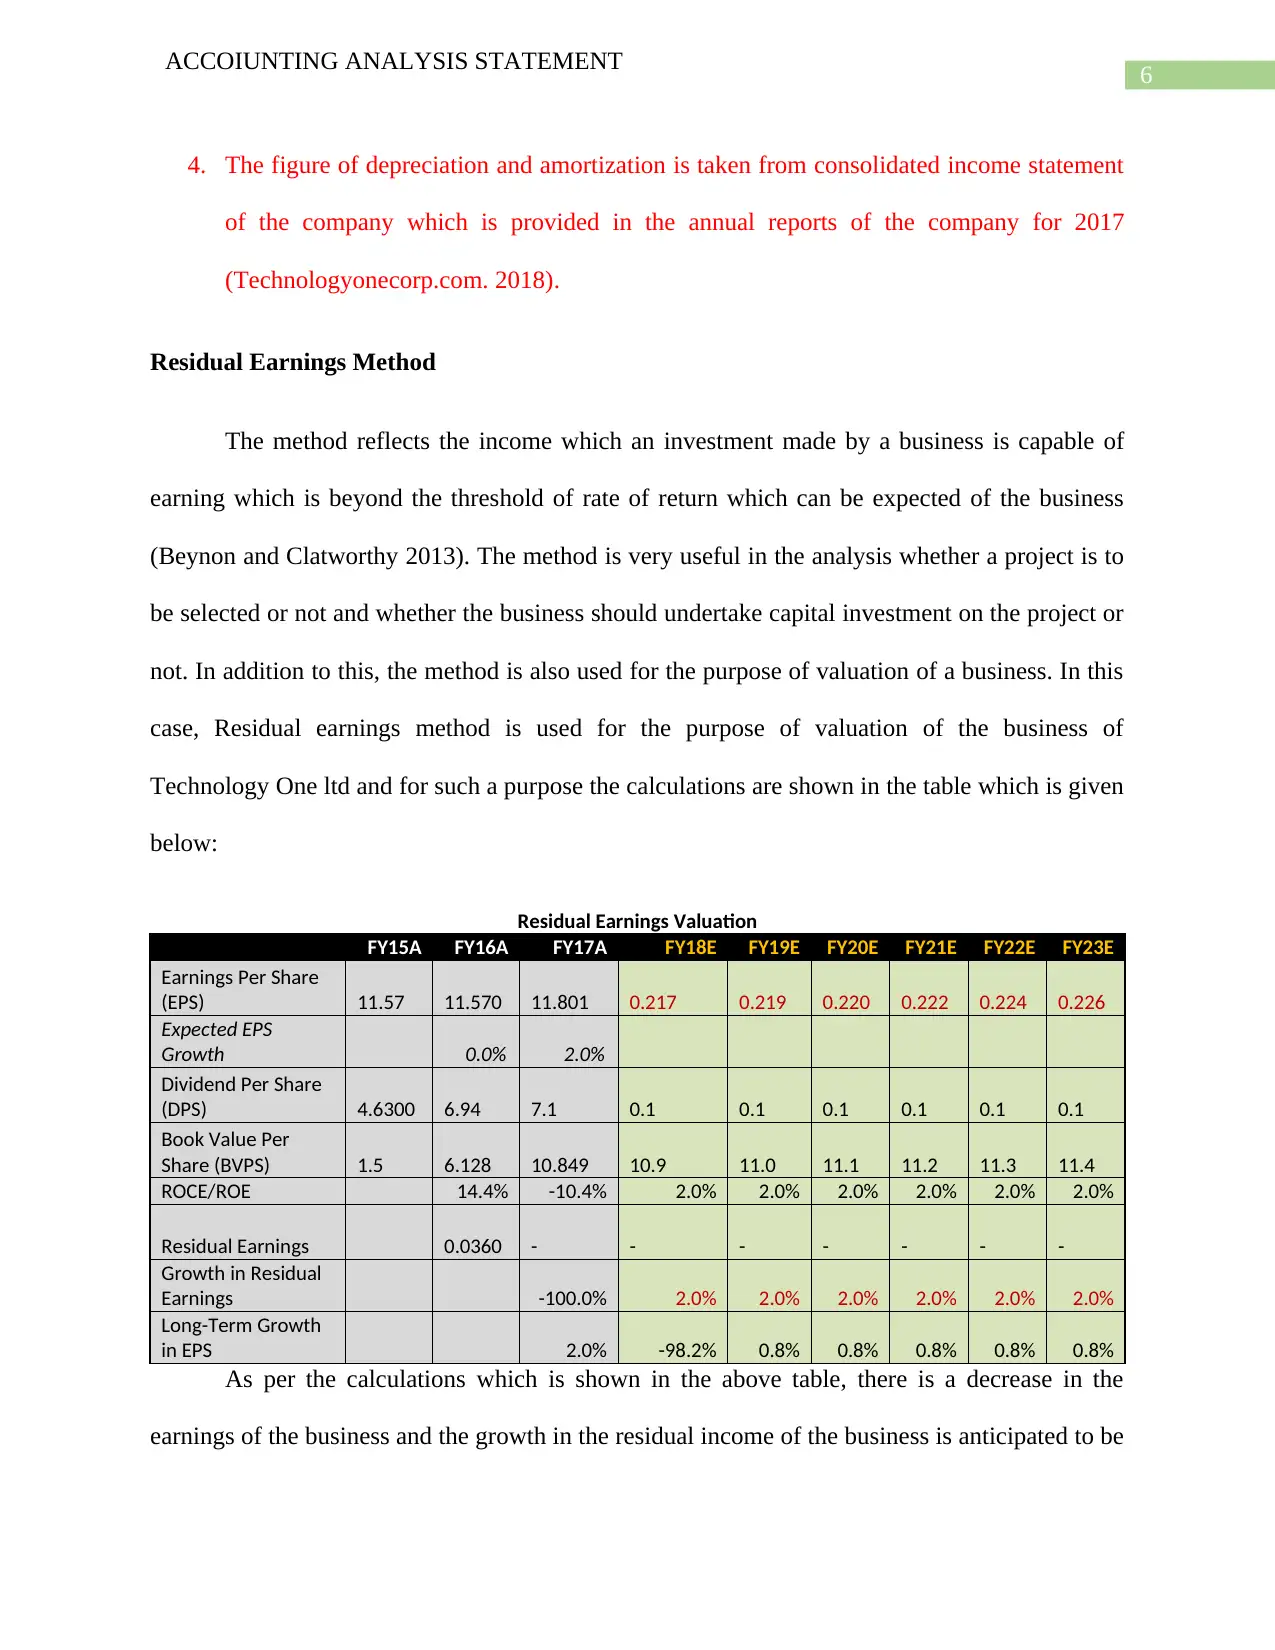
This report provides a comprehensive financial analysis of Technology One Ltd (TEN) from the ASX300, focusing on relative valuation and residual income methods. The analysis begins with an introduction to Technology One, followed by a relative valuation comparing the company's value to its competitors using discounted cash flow (DCF) calculations. Key assumptions, such as sales growth rate, risk-free rate, and market risk premium, are outlined. The weighted average cost of capital (WACC) is calculated to discount future cash flows. The report also applies the residual earnings method to assess the income generated beyond the expected rate of return, providing insights into project selection and capital investment decisions. The analysis includes forecasted financial data, such as earnings per share (EPS), dividend per share (DPS), and book value per share (BVPS), to determine the residual earnings and long-term growth potential of Technology One. The report concludes with a reference list.
tabler-icon-diamond-filled.svg

Contribute Materials

Your contribution can guide someone’s learning journey. Share your documents today.
Document Page
Running head: ACCOIUNTING ANALYSIS STATEMENT
Accounting Analysis Statement
Name of the Student:
Name of the University:
Author’s Note:
tabler-icon-diamond-filled.svg

Secure Best Marks with AI Grader

Need help grading? Try our AI Grader for instant feedback on your assignments.
Document Page
1
ACCOIUNTING ANALYSIS STATEMENT
Table of Contents
Introduction......................................................................................................................................2
Relative valuation............................................................................................................................2
Assumptions....................................................................................................................................5
Residual Earnings Method...............................................................................................................6
Reference.........................................................................................................................................7
Document Page
2
ACCOIUNTING ANALYSIS STATEMENT
Introduction
The main purpose of this assignment is to conduct a relative analysis for Technology One
ltd. The assessment will also be applying residual income method to calculate discounted cash
flows of the business which are to be forecasted for the business. Technology One ltd is engaged
in the business of providing software systems in Australia. The company is engaged in the
process of buying, selling, marketing of the products of the company. The company is regarded
as one of the leading developers of software system in Australia which is used widely in
Australia.
Relative valuation
Relative Valuation may be defined as the process of comparing the value of the price of
the asset which the business possesses with the market value of similar assets of the business
(Nissim 2013). The technique is used for the purpose of comparison between the valuation of the
business to that of its competitors. The computations of the discounted cash flows and the
valuation of the business is shown below:
Document Page
3
ACCOIUNTING ANALYSIS STATEMENT
Technology One ltd
($ in millions, except per share)
DCF Valuation
(in million)
2017 2018 2019 2020 2021
Sales 2,73,253 2,89,648 3,07,027 3,25,449 3,44,976
% growth 6.0% 6.0% 6.0% 6.0% 6.0%
Total costs 1,68,979 1,79,118 1,89,865 2,01,257 2,13,332
% sales -61.8% -61.8% -61.8% -61.8% -61.8%
EBITDA 4,42,232 4,68,766 4,96,892 5,26,705 5,58,308
% margin 161.8% 161.8% 161.8% 161.8% 161.8%
Depreciation & Amortization: 4237 4491 4761 5046 5349
% sales -1.6% -1.6% -1.6% -1.6% -1.6%
EBIT 4,46,469 4,73,257 5,01,653 5,31,752 5,63,657
Taxes 13,525 -1,41,977 -1,50,496 -1,59,526 -1,69,097
Capex -5,465 -5,793 -6,141 -6,509 -6,900
% sales 2.0% 2.0% 2.0% 2.0% 2.0%
Increase/Decrease in NWC -1,01,655 -6,099 -6,465 -6,853 -7,264
Unlevered Free Cash Flow - Calc'd 3,48,637 3,14,897 3,33,790 3,53,818 3,75,047
Unlevered FCF: Analyst Projections 3,48,637 3,14,897 3,33,790 3,53,818 3,75,047
WACC 10.2%
Discount Period 1.0 2.0 3.0 4.0 5.0
Discount Factor 0.91 0.82 0.75 0.68 0.62
Present value of free cash flow 3,16,370 2,59,306 2,49,425 2,39,921 2,30,779
Terminal Value
Terminal Year Free Cash Flow 3,75,047
Perpetuity Growth Rate 3.0%
Terminal Value 53,65,966
Discount Period 5.0
Discount Factor 0.6
Present Value of Terminal Value 33,01,861
% of Enterprise Value 72%
Forecast period ($$)
Figure 1: (Image showing Forecasted cash flow and the present Value of Terminal Value
of the business)
Source: (Created by Author)
tabler-icon-diamond-filled.svg

Secure Best Marks with AI Grader

Need help grading? Try our AI Grader for instant feedback on your assignments.
Document Page
4
ACCOIUNTING ANALYSIS STATEMENT
WACC Calculation
Target Capital Structure (1)
Market Value of Debt: $10
Market Value of Equity: $32,152
Total Financing: $32,162.00
Debt to Total Capitalization 0.0%
Equity to Total Capitalization 100.0%
Cost of Equity
Risk-free rate (2) 7.18%
Market risk Premium (3) 3.6%
Levered Beta 0.79
Cost of Equity 9.98%
Cost of Debt
Cost of Debt (1) 1000.0%
Taxes 30.0%
After Tax Cost of Debt 700.0%
WACC (4) 10.20%
(1) Obtained from Yahoo Finance or Morning Star
(2) Yield on 10-year Treasury bond
(3) Typically 6% to 8%
(4) Can be obtained directly from Bloomberg
Input
Figure 1: (Image showing computation of WACC of the Business)
Source: (Created by Author)
As per the above figure, it is clear that the weighted average cost of capital of the
business is shown to be 10.20%. The weighted average cost of capital is computed considering
the cost of equity of the business and the cost of debts of the business (Lee and Heo 2016). The
growth rate of sales is assumed to be 6% as shown in the above figure. The capital structure if
the business shows that the company is predominantly depended on the equity capital of the
business and employ low amount of debt in the capital structure mix of the business. The capital
Document Page
5
ACCOIUNTING ANALYSIS STATEMENT
mix further shows that the business the business uses around $ 10,000 of debt capital in the
capital structure mix of the business (Frank and Shen 2016).
The relevance of the discounted cash flow is that it helps the business to effectively
estimate the future earnings which the business can anticipate from the business. The discounted
cash flow is useful for the purpose of estimating the growth of the business. The free cash flow
of the business as calculated is shown to be $ 348,637 as per figure 1 which is shown above.
Assumptions
In the calculations which are associated with the discounted cash flow model, various
assumptions are taken for the sake of conducting the calculations and getting the results. The
following assumptions are mentioned below:
1. The perpetuity growth rate is taken on an assumption basis judging the growth rate on
equity returns which is shown to be 2% in the annual reports of the company.
2. The risk-free rate of return is taken on an assumption basis considering the business
performance of the company and the risks which the business faces which is shown as
0.79 which is taken from Yahoo Finance site (Finance.yahoo.com. 2018). The risk-free
rate of return is the minimum return which the investors of the business expects and such
depends on the risk and it is deliberately taken lower of market return which is taken as
10.73%. The average return of the business is 10% on equity and the company has
achieved growth of 2% regularly. The market return is taken on an average basis.
3. The market risk premium is the result of deducting risk-free premium from markets
returns as shown in calculations.
Document Page
6
ACCOIUNTING ANALYSIS STATEMENT
4. The figure of depreciation and amortization is taken from consolidated income statement
of the company which is provided in the annual reports of the company for 2017
(Technologyonecorp.com. 2018).
Residual Earnings Method
The method reflects the income which an investment made by a business is capable of
earning which is beyond the threshold of rate of return which can be expected of the business
(Beynon and Clatworthy 2013). The method is very useful in the analysis whether a project is to
be selected or not and whether the business should undertake capital investment on the project or
not. In addition to this, the method is also used for the purpose of valuation of a business. In this
case, Residual earnings method is used for the purpose of valuation of the business of
Technology One ltd and for such a purpose the calculations are shown in the table which is given
below:
Residual Earnings Valuation
FY15A FY16A FY17A FY18E FY19E FY20E FY21E FY22E FY23E
Earnings Per Share
(EPS) 11.57 11.570 11.801 0.217 0.219 0.220 0.222 0.224 0.226
Expected EPS
Growth 0.0% 2.0%
Dividend Per Share
(DPS) 4.6300 6.94 7.1 0.1 0.1 0.1 0.1 0.1 0.1
Book Value Per
Share (BVPS) 1.5 6.128 10.849 10.9 11.0 11.1 11.2 11.3 11.4
ROCE/ROE 14.4% -10.4% 2.0% 2.0% 2.0% 2.0% 2.0% 2.0%
Residual Earnings 0.0360 - - - - - - -
Growth in Residual
Earnings -100.0% 2.0% 2.0% 2.0% 2.0% 2.0% 2.0%
Long-Term Growth
in EPS 2.0% -98.2% 0.8% 0.8% 0.8% 0.8% 0.8%
As per the calculations which is shown in the above table, there is a decrease in the
earnings of the business and the growth in the residual income of the business is anticipated to be
tabler-icon-diamond-filled.svg

Paraphrase This Document

Need a fresh take? Get an instant paraphrase of this document with our AI Paraphraser
Document Page
7
ACCOIUNTING ANALYSIS STATEMENT
of 2%. The EPS of the business is shown to be 11.57 for the year 2015 and the same is shown in
the figure above
Reference
Beynon, M.J. and Clatworthy, M.A., 2013. A fuzzy-based approach to residual income equity
valuation. Review of quantitative Finance and Accounting, 40(4), pp.675-690.
Finance.yahoo.com. (2018). Yahoo is now part of Oath. [online] Available at:
https://finance.yahoo.com/quote/TNE.AX/key-statistics?p=TNE.AX [Accessed 4 Jun. 2018].
Frank, M.Z. and Shen, T., 2016. Investment and the weighted average cost of capital. Journal of
Financial Economics, 119(2), pp.300-315.
Lee, C.Y. and Heo, H., 2016. Estimating willingness to pay for renewable energy in South Korea
using the contingent valuation method. Energy Policy, 94, pp.150-156.
Nissim, D., 2013. Relative valuation of US insurance companies. Review of Accounting
Studies, 18(2), pp.324-359.
Technologyonecorp.com. (2018). [online] Available at:
https://www.technologyonecorp.com/__data/assets/pdf_file/0011/67691/
TechnologyOne_2017_AnnualReport.pdf [Accessed 4 Jun. 2018].
chevron_up_icon
1 out of 8
circle_padding
hide_on_mobile
zoom_out_icon
logo.png

Your All-in-One AI-Powered Toolkit for Academic Success.

Available 24*7 on WhatsApp / Email

[object Object]