Technomart Industries Employee Satisfaction: A Detailed Report
VerifiedAdded on 2023/06/05
|11
|2693
|236
Report
AI Summary
This report provides an analysis and evaluation of employee satisfaction at Technomart Industries using descriptive statistics and frequency analysis. Key findings reveal that over 59% of employees are loyal, with average employment years exceeding the company average, and working hours often surpassing recommended levels. Non-union members exhibit higher job satisfaction and longer working hours compared to union members. The report also addresses concerns about impending retirements, estimating the average employee age at approximately 39 years. Inferential analysis confirms union employees stay longer than the industry average. Recommendations include increasing staffing to alleviate workload and ensure adherence to company working hour policies. The survey used closed-ended questionnaires distributed to 400 employees to gather data on job satisfaction, work hours, and union membership.
Statistics
Student Name:
Instructor Name:
Course Number:
14 September 2018
Student Name:
Instructor Name:
Course Number:
14 September 2018
Paraphrase This Document
Need a fresh take? Get an instant paraphrase of this document with our AI Paraphraser
Executive summary of Technomart employee’s job satisfaction
This report provides an analysis and evaluation of Technomart Industries employee satisfaction.
The data analysis involved getting the descriptive analysis that is, getting the mean, mode
median and standard deviation. Frequencies of data was also used to analyze different responses
from the employees. Mostly tables were used to present the findings and they are in the excel
sheet.
All the calculations and tables can be found in the excel sheet. The calculations shows that most
the employees over 59% are loyal to the Industry such that they won’t take another job in a
different industry even if they are offered higher salary. The employment average years is above
the company the average years and the working hours is above the company’s recommended
hours per week.
The observation made on the union members and non-union members, the majority of members
are non-union members. It also show that non-union members have the highest mean number of
working hours, they lead in all the occupation and they are also satisfied with their job more than
the union members.
The company’s average years of employees is about 39 years which is still young but the
company can opt to get new employees to cover employees who will be retiring and exiting due
to new job somewhere.
Some recommendation which can be suggested is too increase the number of employees to
reduce the workload so that number of hours an employee work per week conform to the one of
the company.
Background of the study
Satisfaction of employees is one of the most important things which an employer may consider
for a certain company to grow. The employees involves in delivering services to customers,
making informed decision, answers to customers complains and many more. For them to deliver
effectively they need to be satisfied by the employer appropriately. That is the reason for the
survey on Technomart industries employee satisfaction
In pursuit of better performance by an employee and those satisfying customers, organizations
like Technomart will be looking for strategies and investing in strategies to improve the output.
Offering variety of key services, the organization will be passionate in ensuring their employees
deliver to the maximum in order to ensure the customers contentment with the services provided
by the employees. Service organization are therefore putting in place Quality Control in their
daily operations so as to ensure that their employees always perform their obligation right the
first time and that they meet and even exceed expectations of customers after consuming the
product of the firm or the services.
The consumers in the service market are not only cautious with the quality of products and
services they consume, but also in the mode in which the services is rendered, and since they are
the main party in the system of delivery being, therefore firms are implementing the techniques
of quality control.
⊘ This is a preview!⊘
Do you want full access?
Subscribe today to unlock all pages.
Trusted by 1+ million students worldwide
Purpose of the study
The satisfaction cannot be determined by just observing them carrying out their daily duties. It
may require personal interview to get to know direct from them or giving them the questionnaire
that can be answered at their own convenient time. In this case we used the questionnaire with
closed ended questions mostly to get the uniformity of the information. The questions touched
the position they hold, number of years they have been working with the, how satisfied they are
with the current job, whether they can move to another company if they are offered more salary
and many others.
Scope of the study
The survey was conducted within the environs of the TechnoMart Industries. The questionnaires
were given to some number of employees to represent the whole number of employees there.
Methods used
Closed ended questionnaires were dispersed to a total of 400 employees trying to get their views
on the different aspects contained in the questionnaires. Some few open ended questions were
also available to help the respondents to choose for themselves for what to write.
Objectives of the study
The objective was to analyze and evaluate the employees’ satisfaction at TechnoMart Industries
Paraphrase This Document
Need a fresh take? Get an instant paraphrase of this document with our AI Paraphraser
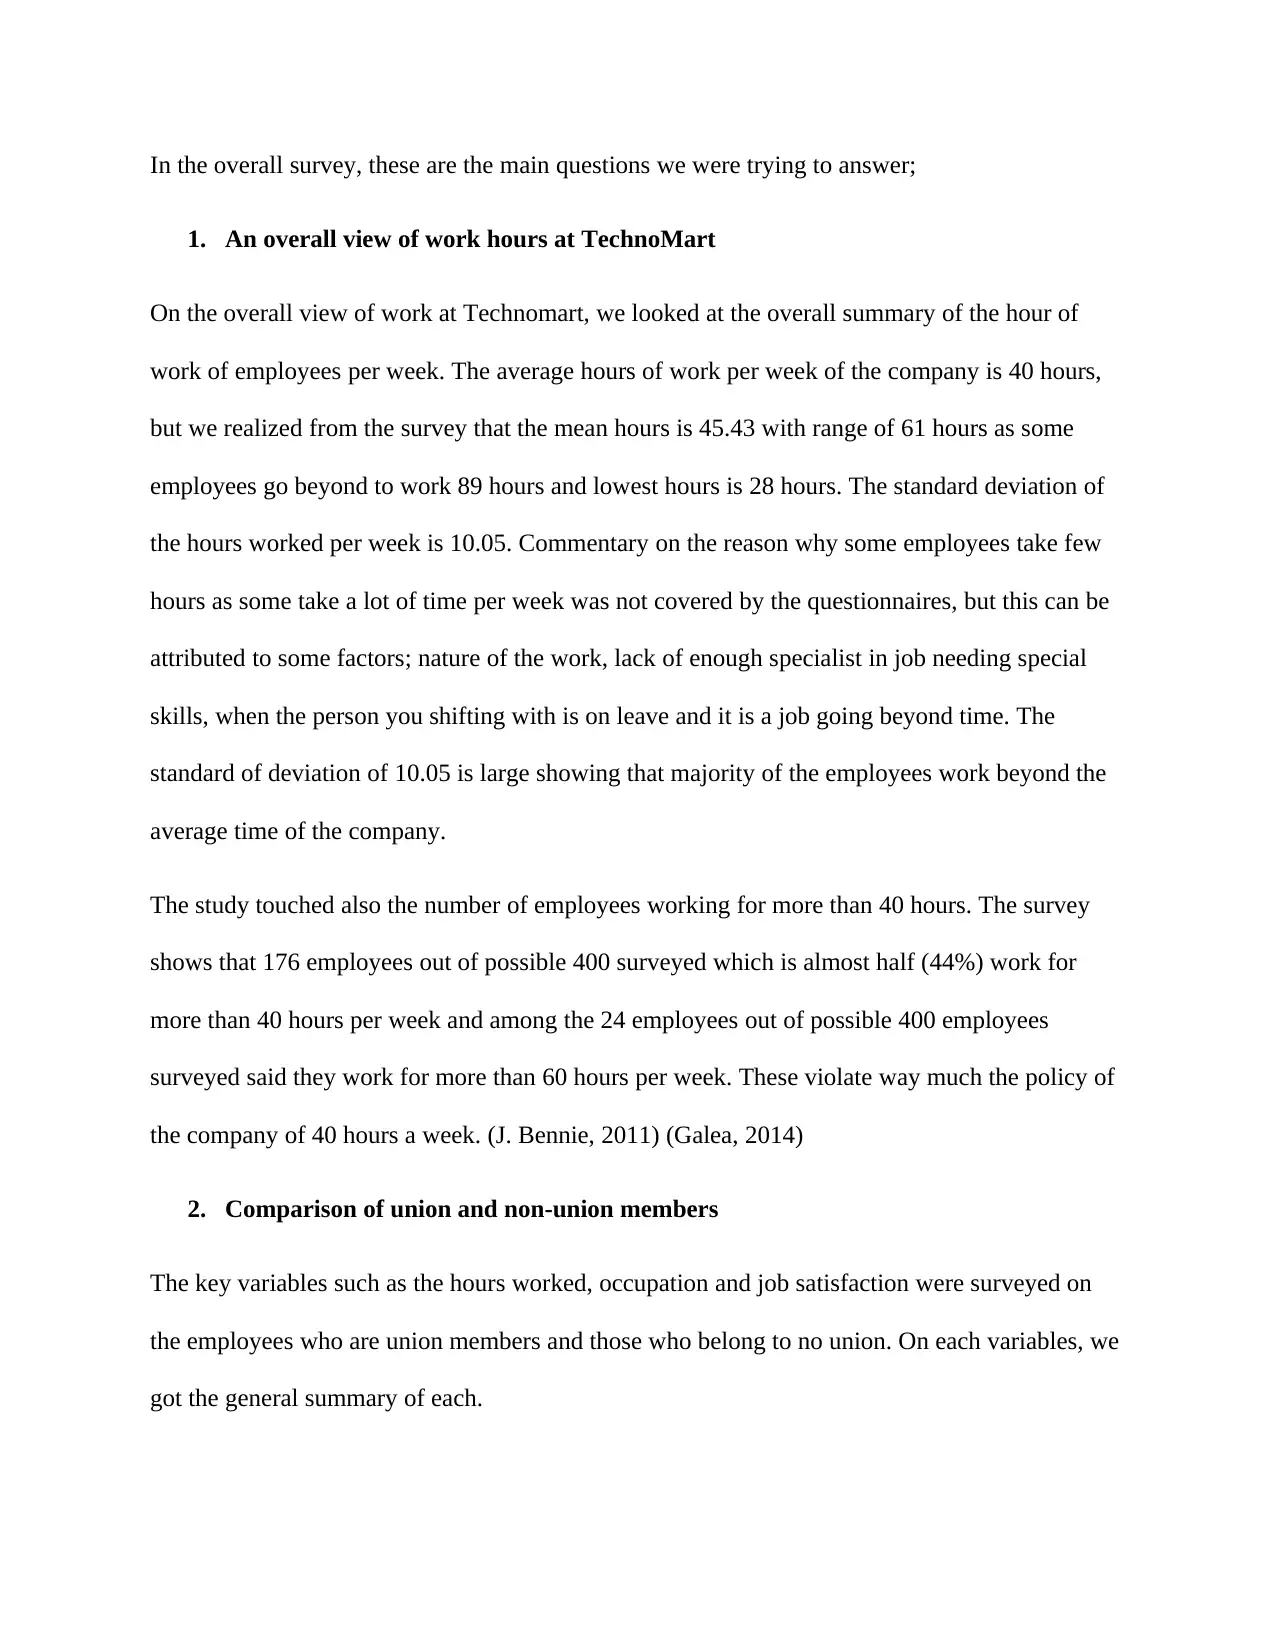
In the overall survey, these are the main questions we were trying to answer;
1. An overall view of work hours at TechnoMart
On the overall view of work at Technomart, we looked at the overall summary of the hour of
work of employees per week. The average hours of work per week of the company is 40 hours,
but we realized from the survey that the mean hours is 45.43 with range of 61 hours as some
employees go beyond to work 89 hours and lowest hours is 28 hours. The standard deviation of
the hours worked per week is 10.05. Commentary on the reason why some employees take few
hours as some take a lot of time per week was not covered by the questionnaires, but this can be
attributed to some factors; nature of the work, lack of enough specialist in job needing special
skills, when the person you shifting with is on leave and it is a job going beyond time. The
standard of deviation of 10.05 is large showing that majority of the employees work beyond the
average time of the company.
The study touched also the number of employees working for more than 40 hours. The survey
shows that 176 employees out of possible 400 surveyed which is almost half (44%) work for
more than 40 hours per week and among the 24 employees out of possible 400 employees
surveyed said they work for more than 60 hours per week. These violate way much the policy of
the company of 40 hours a week. (J. Bennie, 2011) (Galea, 2014)
2. Comparison of union and non-union members
The key variables such as the hours worked, occupation and job satisfaction were surveyed on
the employees who are union members and those who belong to no union. On each variables, we
got the general summary of each.
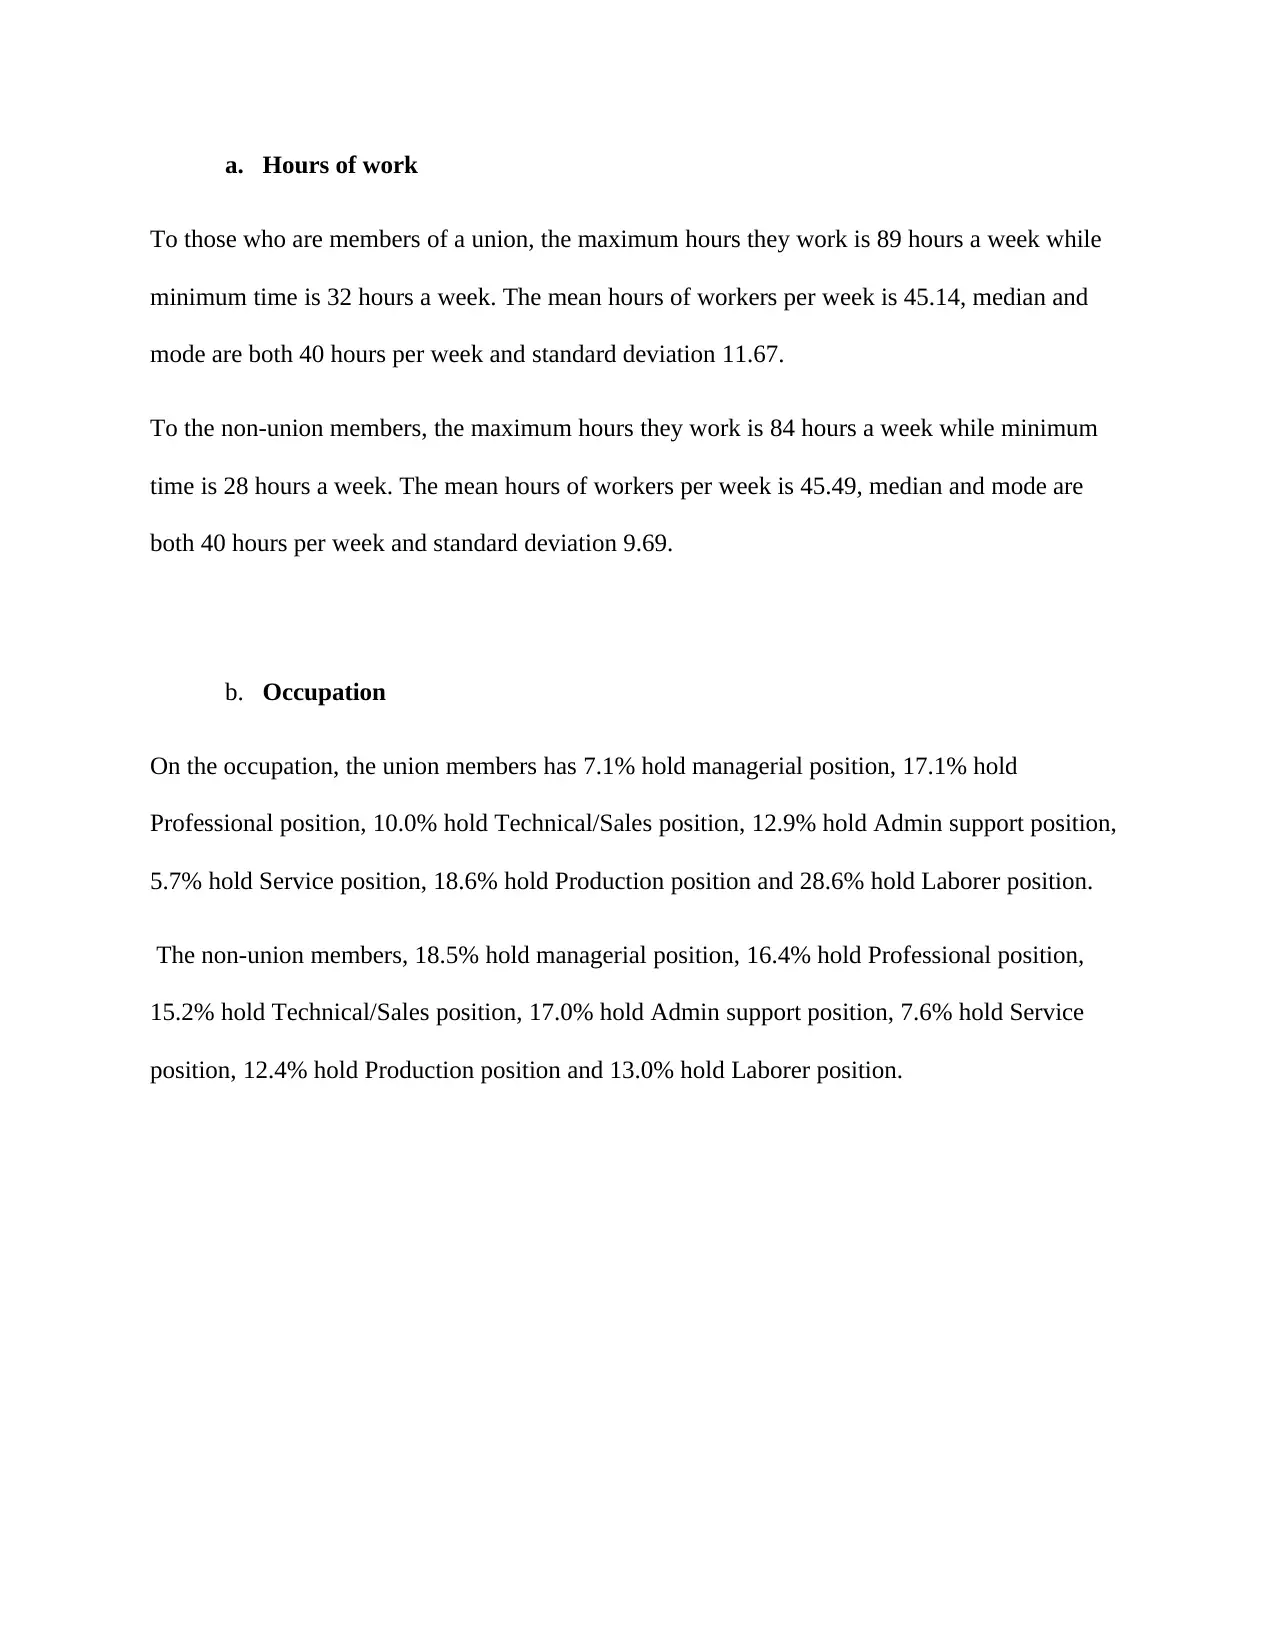
a. Hours of work
To those who are members of a union, the maximum hours they work is 89 hours a week while
minimum time is 32 hours a week. The mean hours of workers per week is 45.14, median and
mode are both 40 hours per week and standard deviation 11.67.
To the non-union members, the maximum hours they work is 84 hours a week while minimum
time is 28 hours a week. The mean hours of workers per week is 45.49, median and mode are
both 40 hours per week and standard deviation 9.69.
b. Occupation
On the occupation, the union members has 7.1% hold managerial position, 17.1% hold
Professional position, 10.0% hold Technical/Sales position, 12.9% hold Admin support position,
5.7% hold Service position, 18.6% hold Production position and 28.6% hold Laborer position.
The non-union members, 18.5% hold managerial position, 16.4% hold Professional position,
15.2% hold Technical/Sales position, 17.0% hold Admin support position, 7.6% hold Service
position, 12.4% hold Production position and 13.0% hold Laborer position.
⊘ This is a preview!⊘
Do you want full access?
Subscribe today to unlock all pages.
Trusted by 1+ million students worldwide
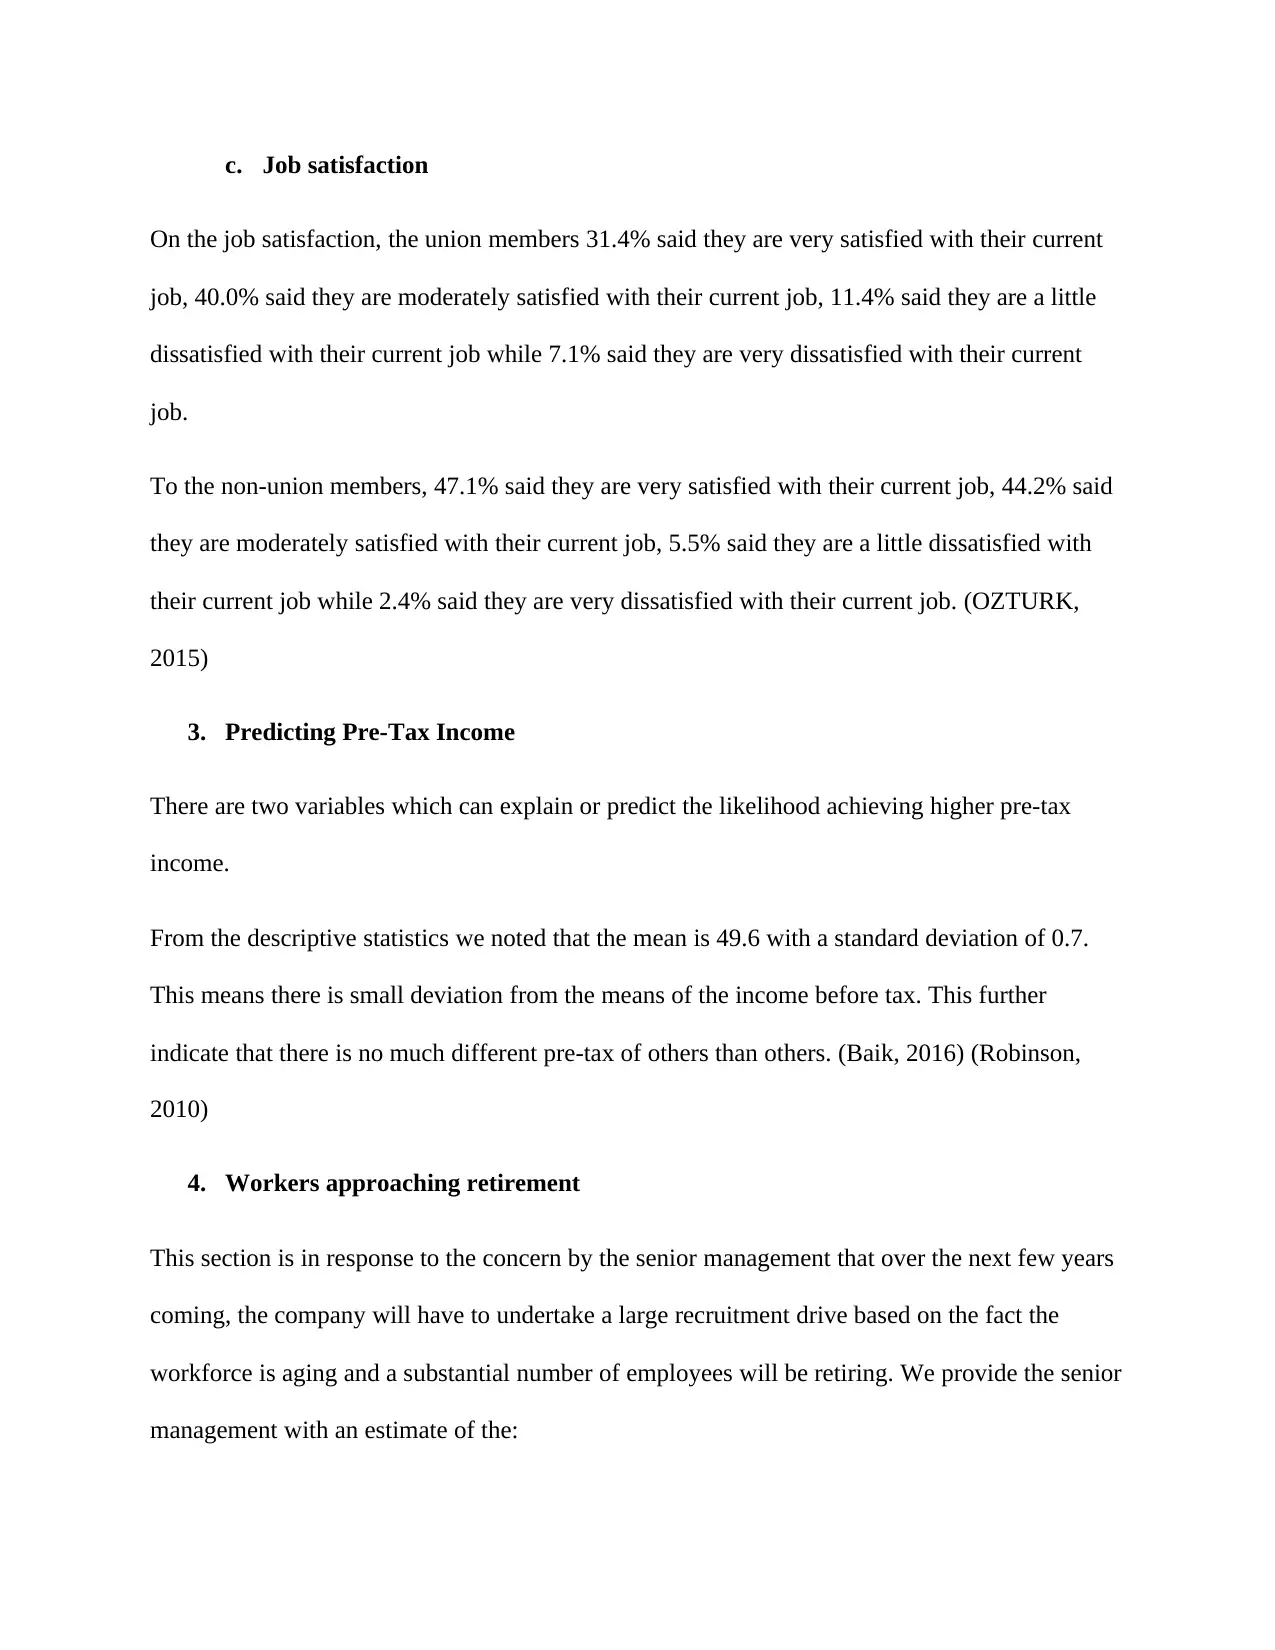
c. Job satisfaction
On the job satisfaction, the union members 31.4% said they are very satisfied with their current
job, 40.0% said they are moderately satisfied with their current job, 11.4% said they are a little
dissatisfied with their current job while 7.1% said they are very dissatisfied with their current
job.
To the non-union members, 47.1% said they are very satisfied with their current job, 44.2% said
they are moderately satisfied with their current job, 5.5% said they are a little dissatisfied with
their current job while 2.4% said they are very dissatisfied with their current job. (OZTURK,
2015)
3. Predicting Pre-Tax Income
There are two variables which can explain or predict the likelihood achieving higher pre-tax
income.
From the descriptive statistics we noted that the mean is 49.6 with a standard deviation of 0.7.
This means there is small deviation from the means of the income before tax. This further
indicate that there is no much different pre-tax of others than others. (Baik, 2016) (Robinson,
2010)
4. Workers approaching retirement
This section is in response to the concern by the senior management that over the next few years
coming, the company will have to undertake a large recruitment drive based on the fact the
workforce is aging and a substantial number of employees will be retiring. We provide the senior
management with an estimate of the:
Paraphrase This Document
Need a fresh take? Get an instant paraphrase of this document with our AI Paraphraser
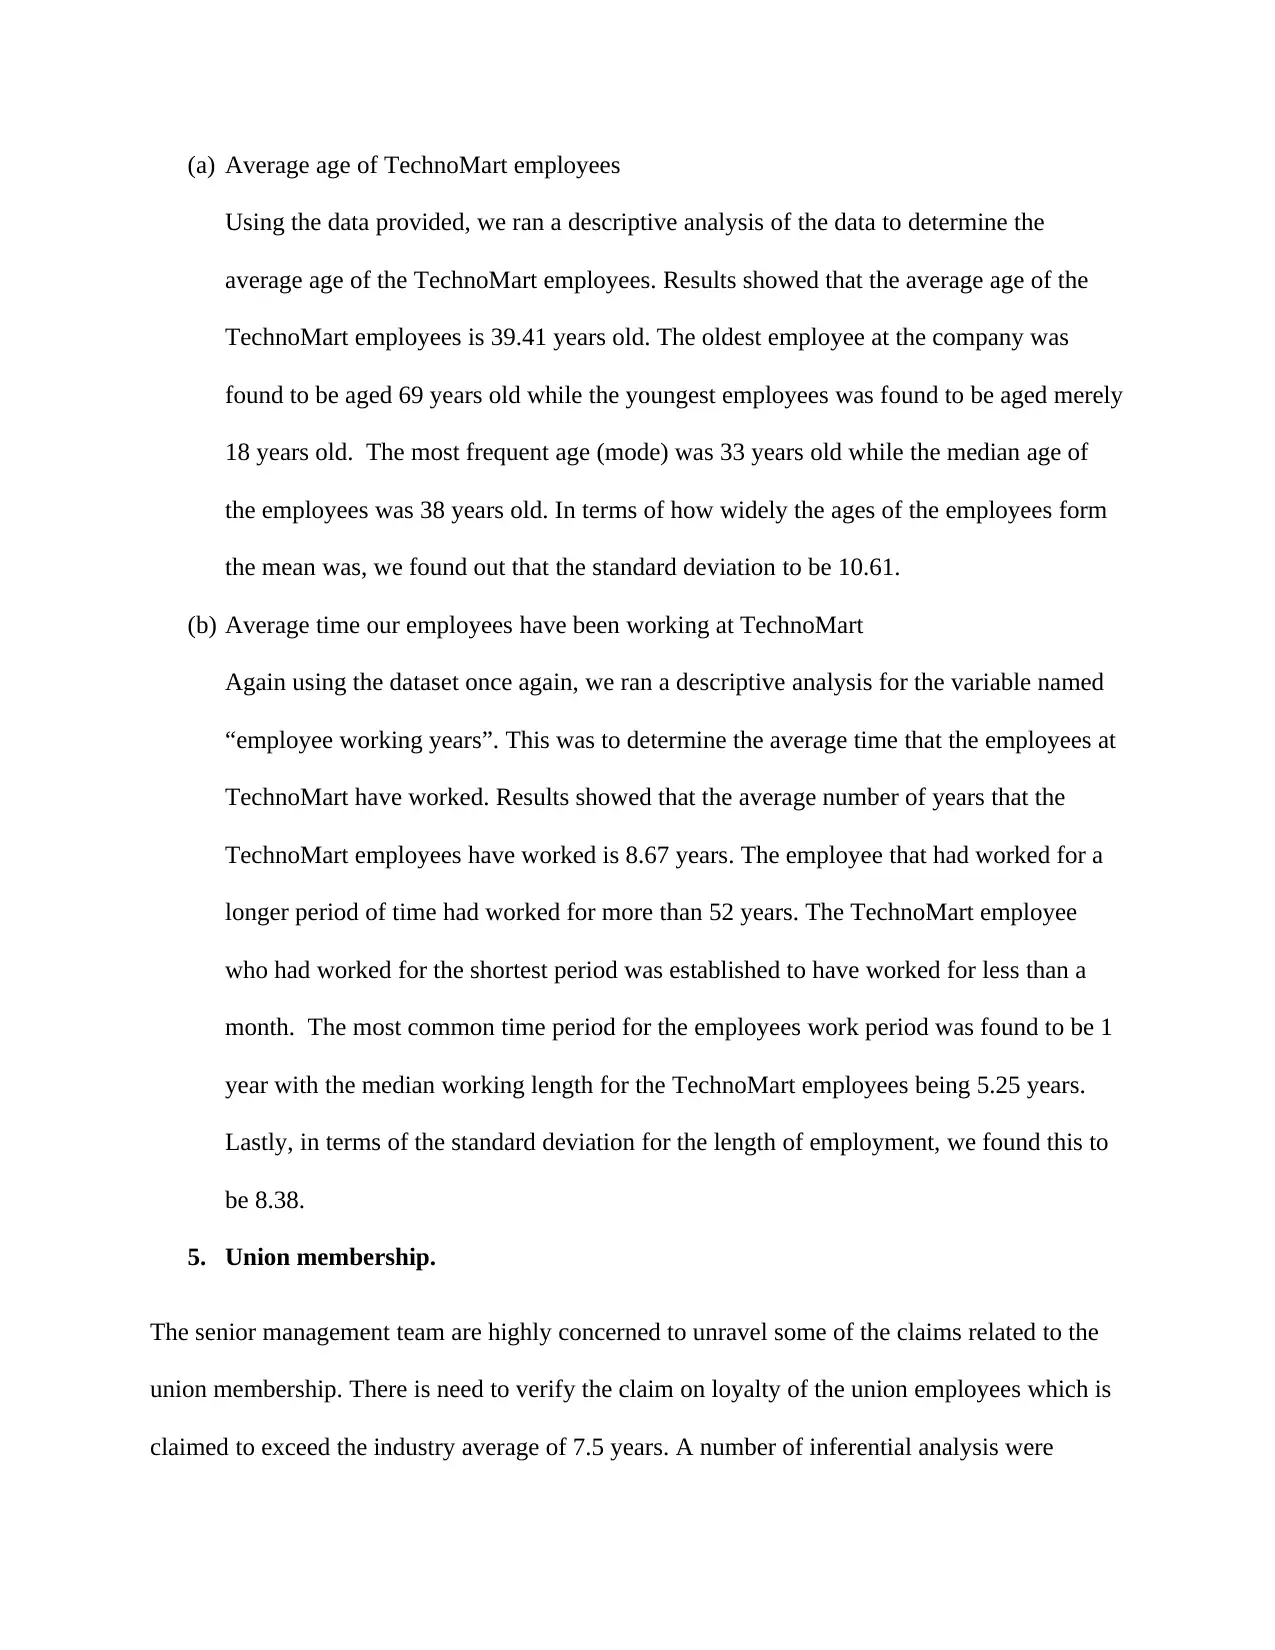
(a) Average age of TechnoMart employees
Using the data provided, we ran a descriptive analysis of the data to determine the
average age of the TechnoMart employees. Results showed that the average age of the
TechnoMart employees is 39.41 years old. The oldest employee at the company was
found to be aged 69 years old while the youngest employees was found to be aged merely
18 years old. The most frequent age (mode) was 33 years old while the median age of
the employees was 38 years old. In terms of how widely the ages of the employees form
the mean was, we found out that the standard deviation to be 10.61.
(b) Average time our employees have been working at TechnoMart
Again using the dataset once again, we ran a descriptive analysis for the variable named
“employee working years”. This was to determine the average time that the employees at
TechnoMart have worked. Results showed that the average number of years that the
TechnoMart employees have worked is 8.67 years. The employee that had worked for a
longer period of time had worked for more than 52 years. The TechnoMart employee
who had worked for the shortest period was established to have worked for less than a
month. The most common time period for the employees work period was found to be 1
year with the median working length for the TechnoMart employees being 5.25 years.
Lastly, in terms of the standard deviation for the length of employment, we found this to
be 8.38.
5. Union membership.
The senior management team are highly concerned to unravel some of the claims related to the
union membership. There is need to verify the claim on loyalty of the union employees which is
claimed to exceed the industry average of 7.5 years. A number of inferential analysis were
conducted to verify the claim that the union employees on average stay longer than the industry
average of 7.5 years. The next subsections will see inferential analysis of the different
subcategories.
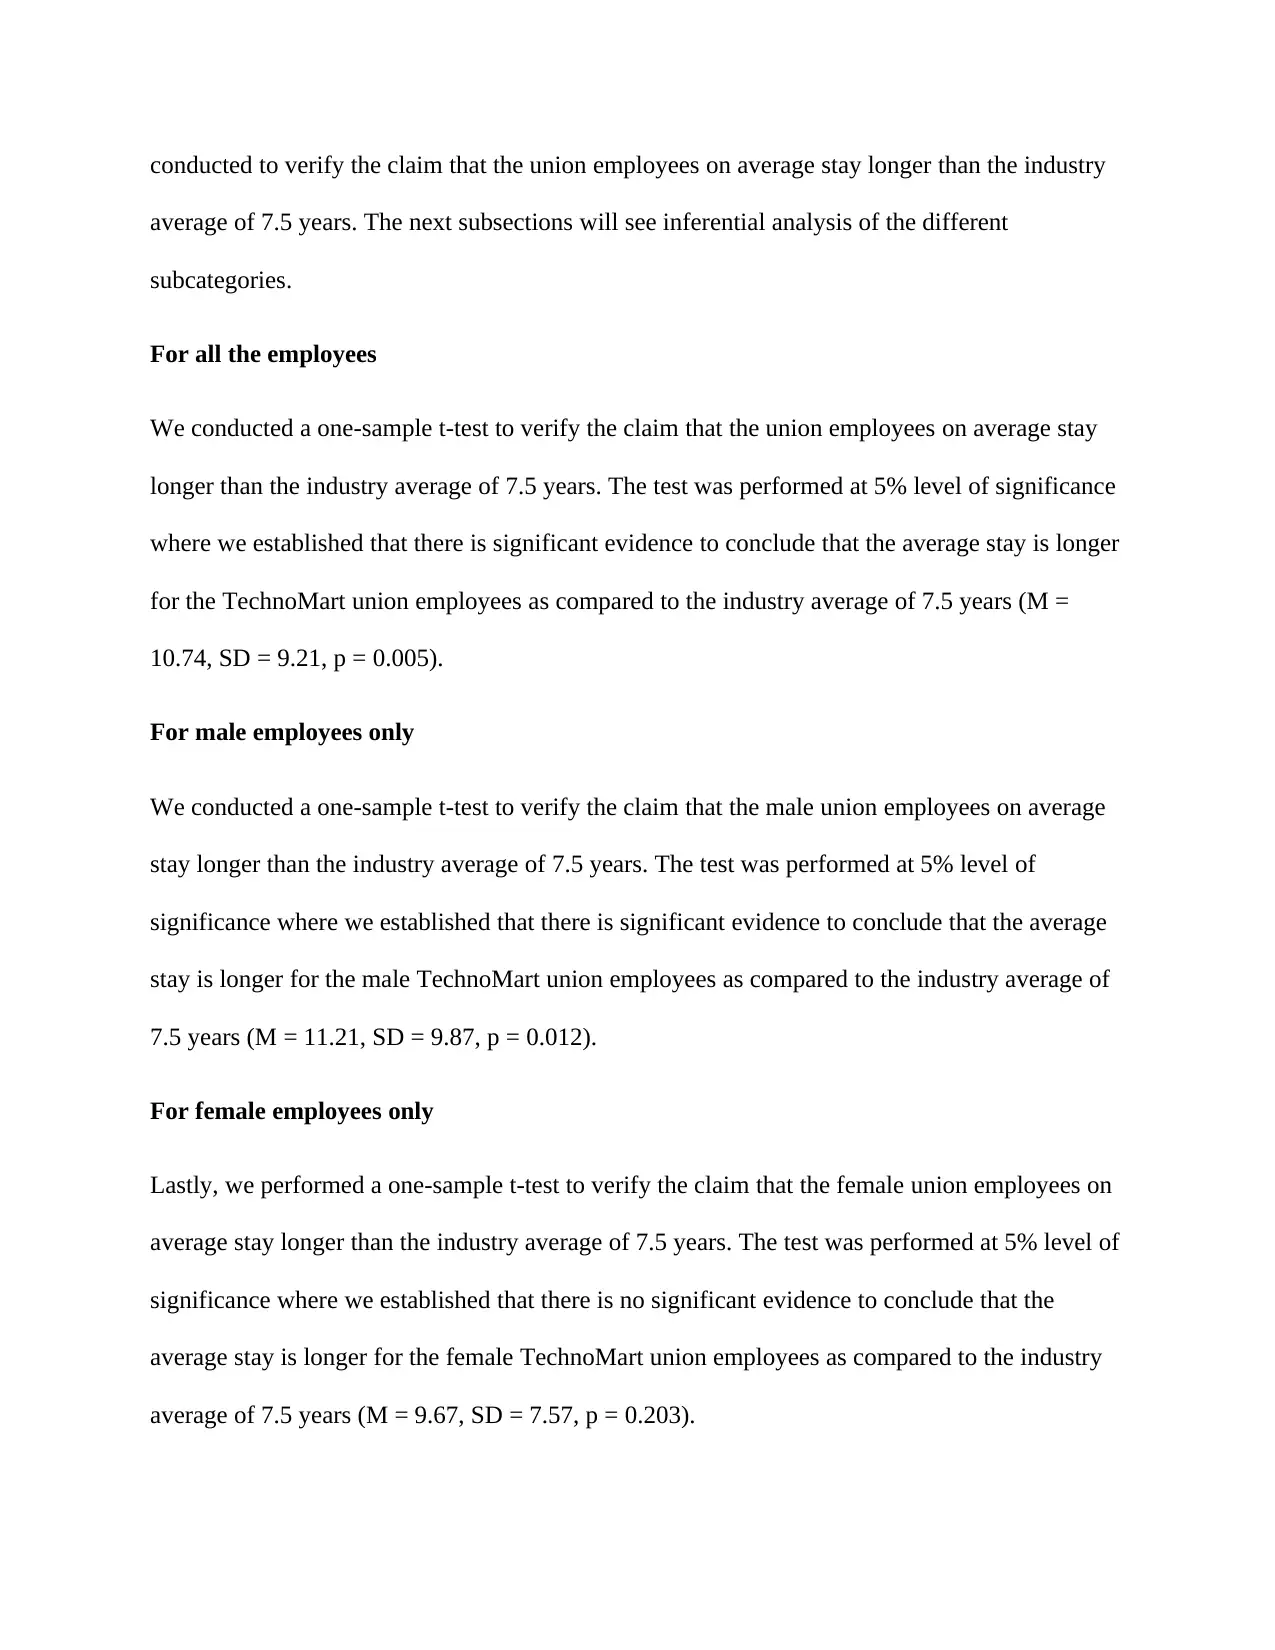
For all the employees
We conducted a one-sample t-test to verify the claim that the union employees on average stay
longer than the industry average of 7.5 years. The test was performed at 5% level of significance
where we established that there is significant evidence to conclude that the average stay is longer
for the TechnoMart union employees as compared to the industry average of 7.5 years (M =
10.74, SD = 9.21, p = 0.005).
For male employees only
We conducted a one-sample t-test to verify the claim that the male union employees on average
stay longer than the industry average of 7.5 years. The test was performed at 5% level of
significance where we established that there is significant evidence to conclude that the average
stay is longer for the male TechnoMart union employees as compared to the industry average of
7.5 years (M = 11.21, SD = 9.87, p = 0.012).
For female employees only
Lastly, we performed a one-sample t-test to verify the claim that the female union employees on
average stay longer than the industry average of 7.5 years. The test was performed at 5% level of
significance where we established that there is no significant evidence to conclude that the
average stay is longer for the female TechnoMart union employees as compared to the industry
average of 7.5 years (M = 9.67, SD = 7.57, p = 0.203).
average of 7.5 years. The next subsections will see inferential analysis of the different
subcategories.
For all the employees
We conducted a one-sample t-test to verify the claim that the union employees on average stay
longer than the industry average of 7.5 years. The test was performed at 5% level of significance
where we established that there is significant evidence to conclude that the average stay is longer
for the TechnoMart union employees as compared to the industry average of 7.5 years (M =
10.74, SD = 9.21, p = 0.005).
For male employees only
We conducted a one-sample t-test to verify the claim that the male union employees on average
stay longer than the industry average of 7.5 years. The test was performed at 5% level of
significance where we established that there is significant evidence to conclude that the average
stay is longer for the male TechnoMart union employees as compared to the industry average of
7.5 years (M = 11.21, SD = 9.87, p = 0.012).
For female employees only
Lastly, we performed a one-sample t-test to verify the claim that the female union employees on
average stay longer than the industry average of 7.5 years. The test was performed at 5% level of
significance where we established that there is no significant evidence to conclude that the
average stay is longer for the female TechnoMart union employees as compared to the industry
average of 7.5 years (M = 9.67, SD = 7.57, p = 0.203).
⊘ This is a preview!⊘
Do you want full access?
Subscribe today to unlock all pages.
Trusted by 1+ million students worldwide
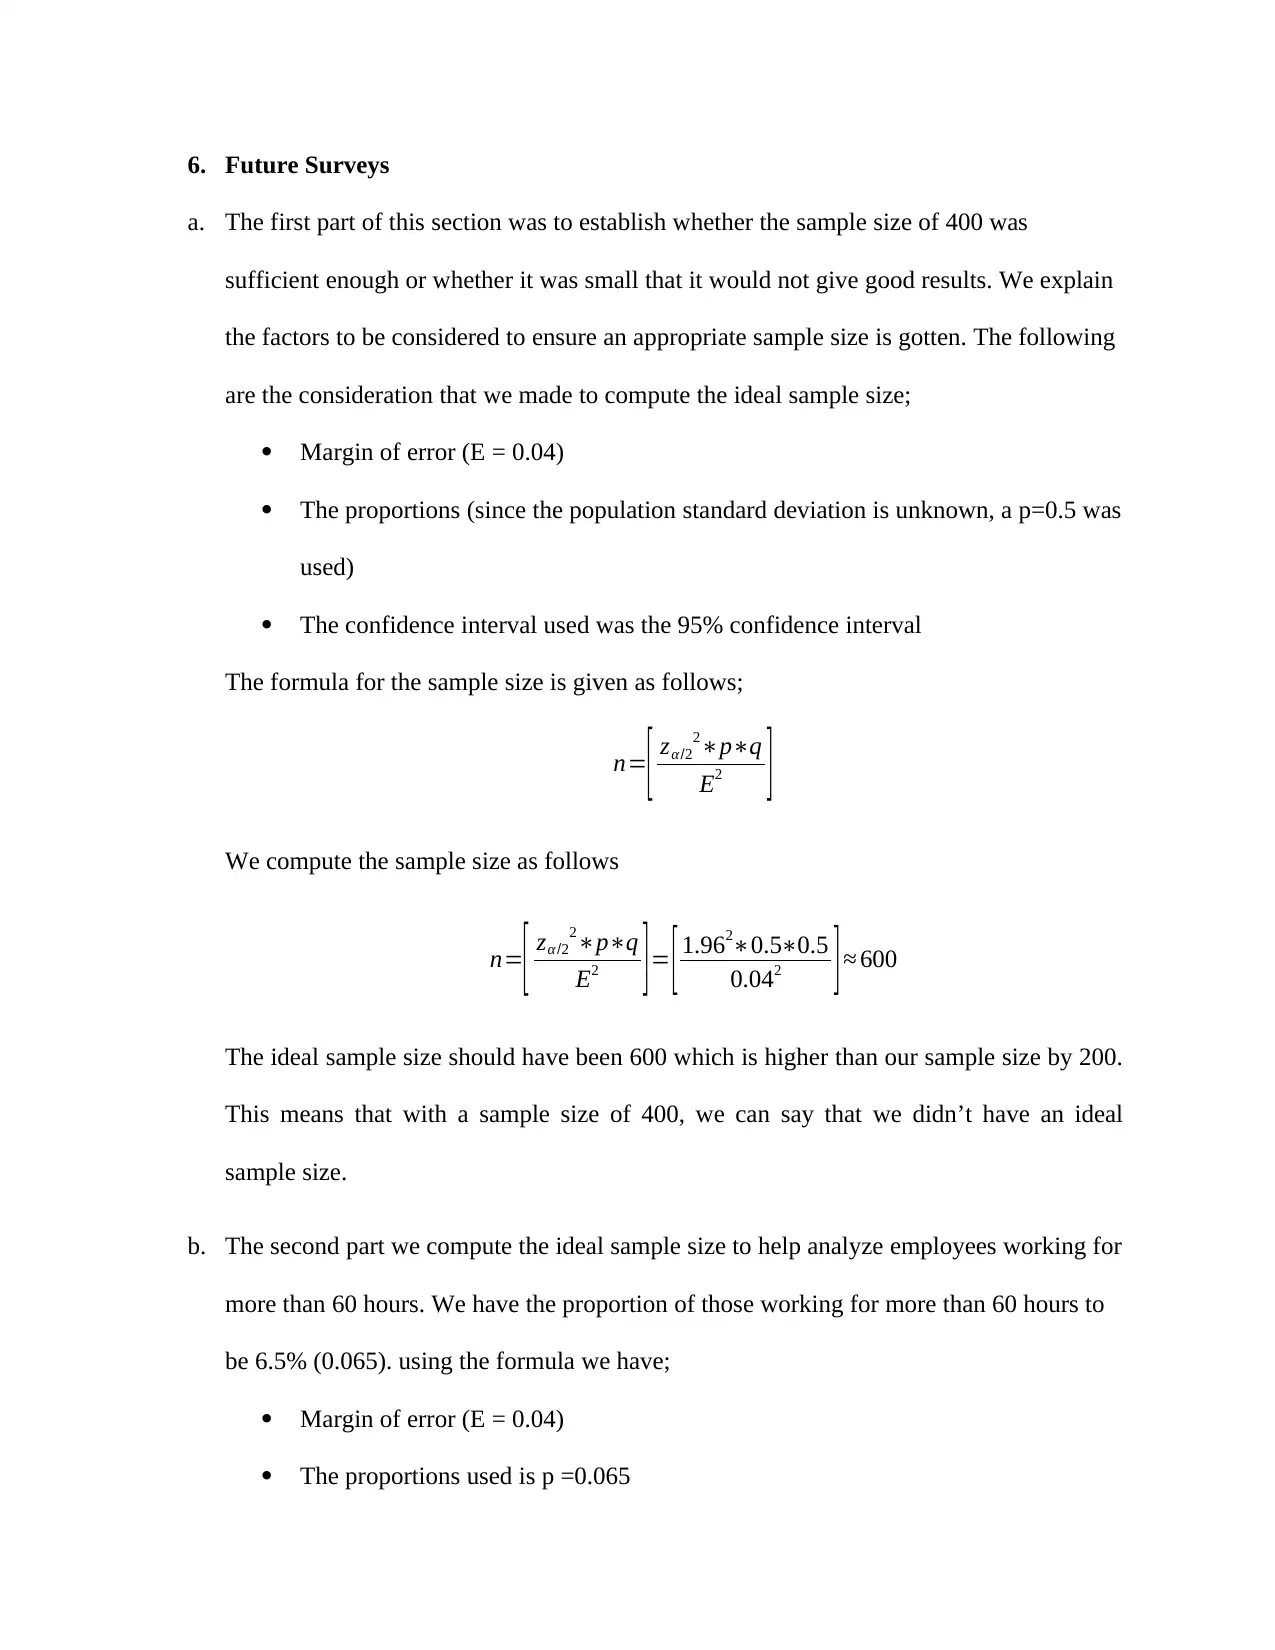
6. Future Surveys
a. The first part of this section was to establish whether the sample size of 400 was
sufficient enough or whether it was small that it would not give good results. We explain
the factors to be considered to ensure an appropriate sample size is gotten. The following
are the consideration that we made to compute the ideal sample size;
Margin of error (E = 0.04)
The proportions (since the population standard deviation is unknown, a p=0.5 was
used)
The confidence interval used was the 95% confidence interval
The formula for the sample size is given as follows;
n=
[ zα/2
2∗p∗q
E2 ]
We compute the sample size as follows
n=
[ zα/2
2∗p∗q
E2 ]= [ 1.962∗0.5∗0.5
0.042 ]≈ 600
The ideal sample size should have been 600 which is higher than our sample size by 200.
This means that with a sample size of 400, we can say that we didn’t have an ideal
sample size.
b. The second part we compute the ideal sample size to help analyze employees working for
more than 60 hours. We have the proportion of those working for more than 60 hours to
be 6.5% (0.065). using the formula we have;
Margin of error (E = 0.04)
The proportions used is p =0.065
Paraphrase This Document
Need a fresh take? Get an instant paraphrase of this document with our AI Paraphraser
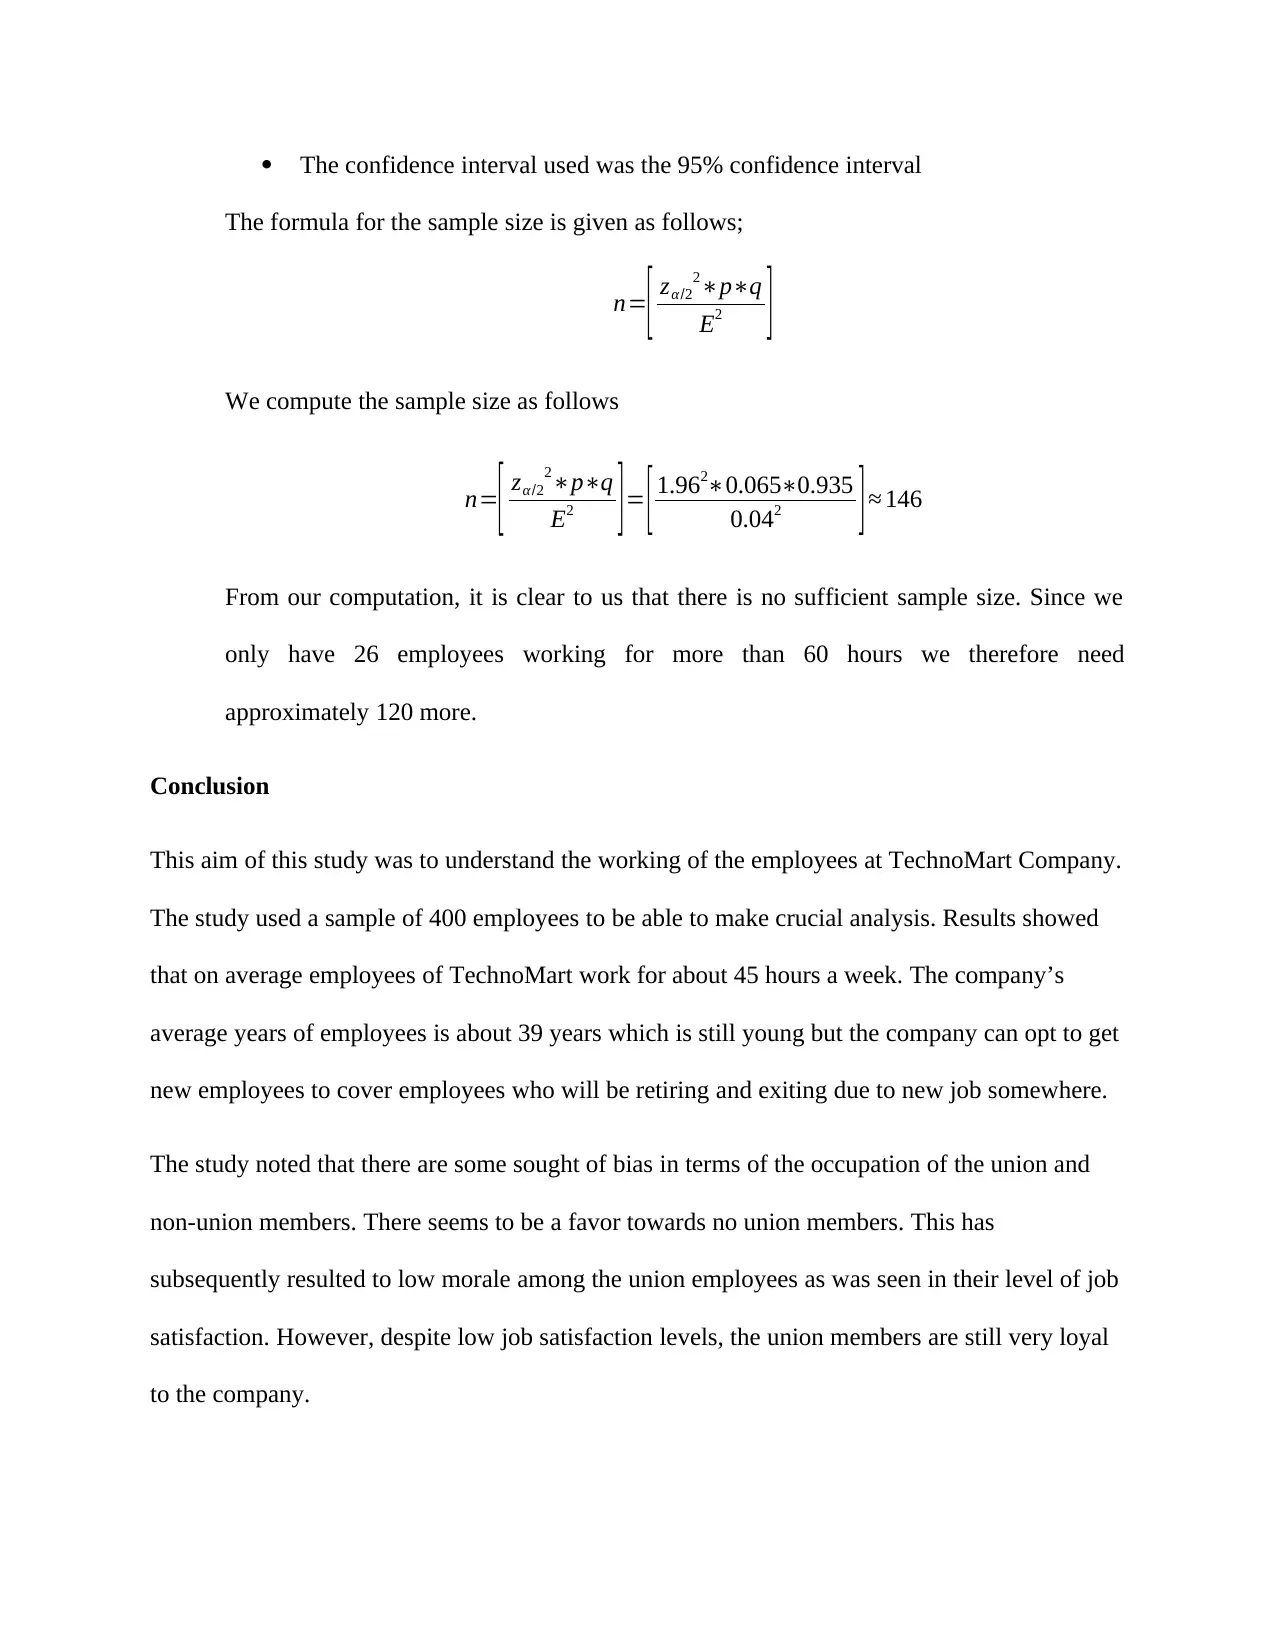
The confidence interval used was the 95% confidence interval
The formula for the sample size is given as follows;
n=
[ zα/2
2∗p∗q
E2 ]
We compute the sample size as follows
n=
[ zα/2
2∗p∗q
E2 ]= [ 1.962∗0.065∗0.935
0.042 ]≈ 146
From our computation, it is clear to us that there is no sufficient sample size. Since we
only have 26 employees working for more than 60 hours we therefore need
approximately 120 more.
Conclusion
This aim of this study was to understand the working of the employees at TechnoMart Company.
The study used a sample of 400 employees to be able to make crucial analysis. Results showed
that on average employees of TechnoMart work for about 45 hours a week. The company’s
average years of employees is about 39 years which is still young but the company can opt to get
new employees to cover employees who will be retiring and exiting due to new job somewhere.
The study noted that there are some sought of bias in terms of the occupation of the union and
non-union members. There seems to be a favor towards no union members. This has
subsequently resulted to low morale among the union employees as was seen in their level of job
satisfaction. However, despite low job satisfaction levels, the union members are still very loyal
to the company.
1 out of 11
Related Documents


Your All-in-One AI-Powered Toolkit for Academic Success.
+13062052269
info@desklib.com
Available 24*7 on WhatsApp / Email
![[object Object]](/_next/static/media/star-bottom.7253800d.svg)
Unlock your academic potential
Copyright © 2020–2026 A2Z Services. All Rights Reserved. Developed and managed by ZUCOL.