Financial Performance of Telecom Companies: EBIT and Return on Assets

Verified

Added on  2020/05/08

|4
|684
|121
Report
AI Summary
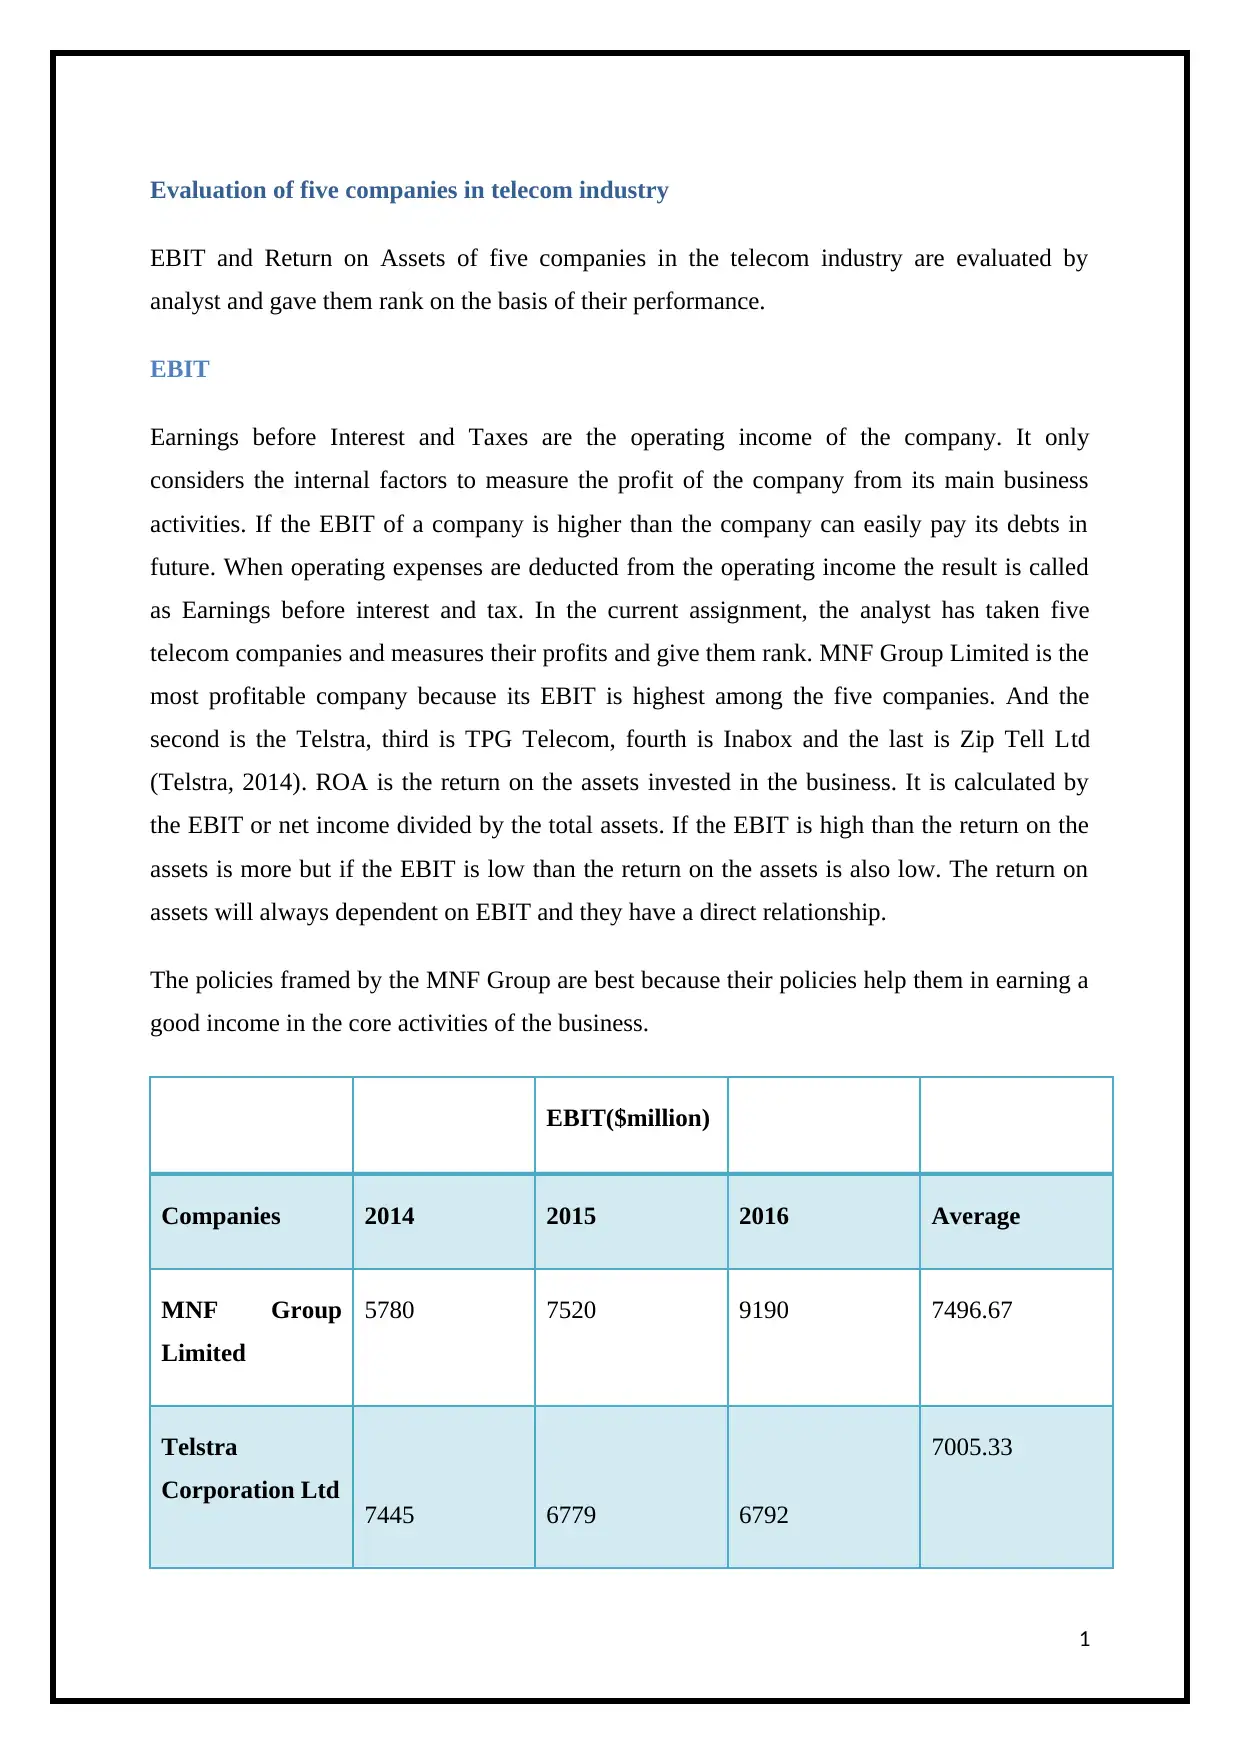
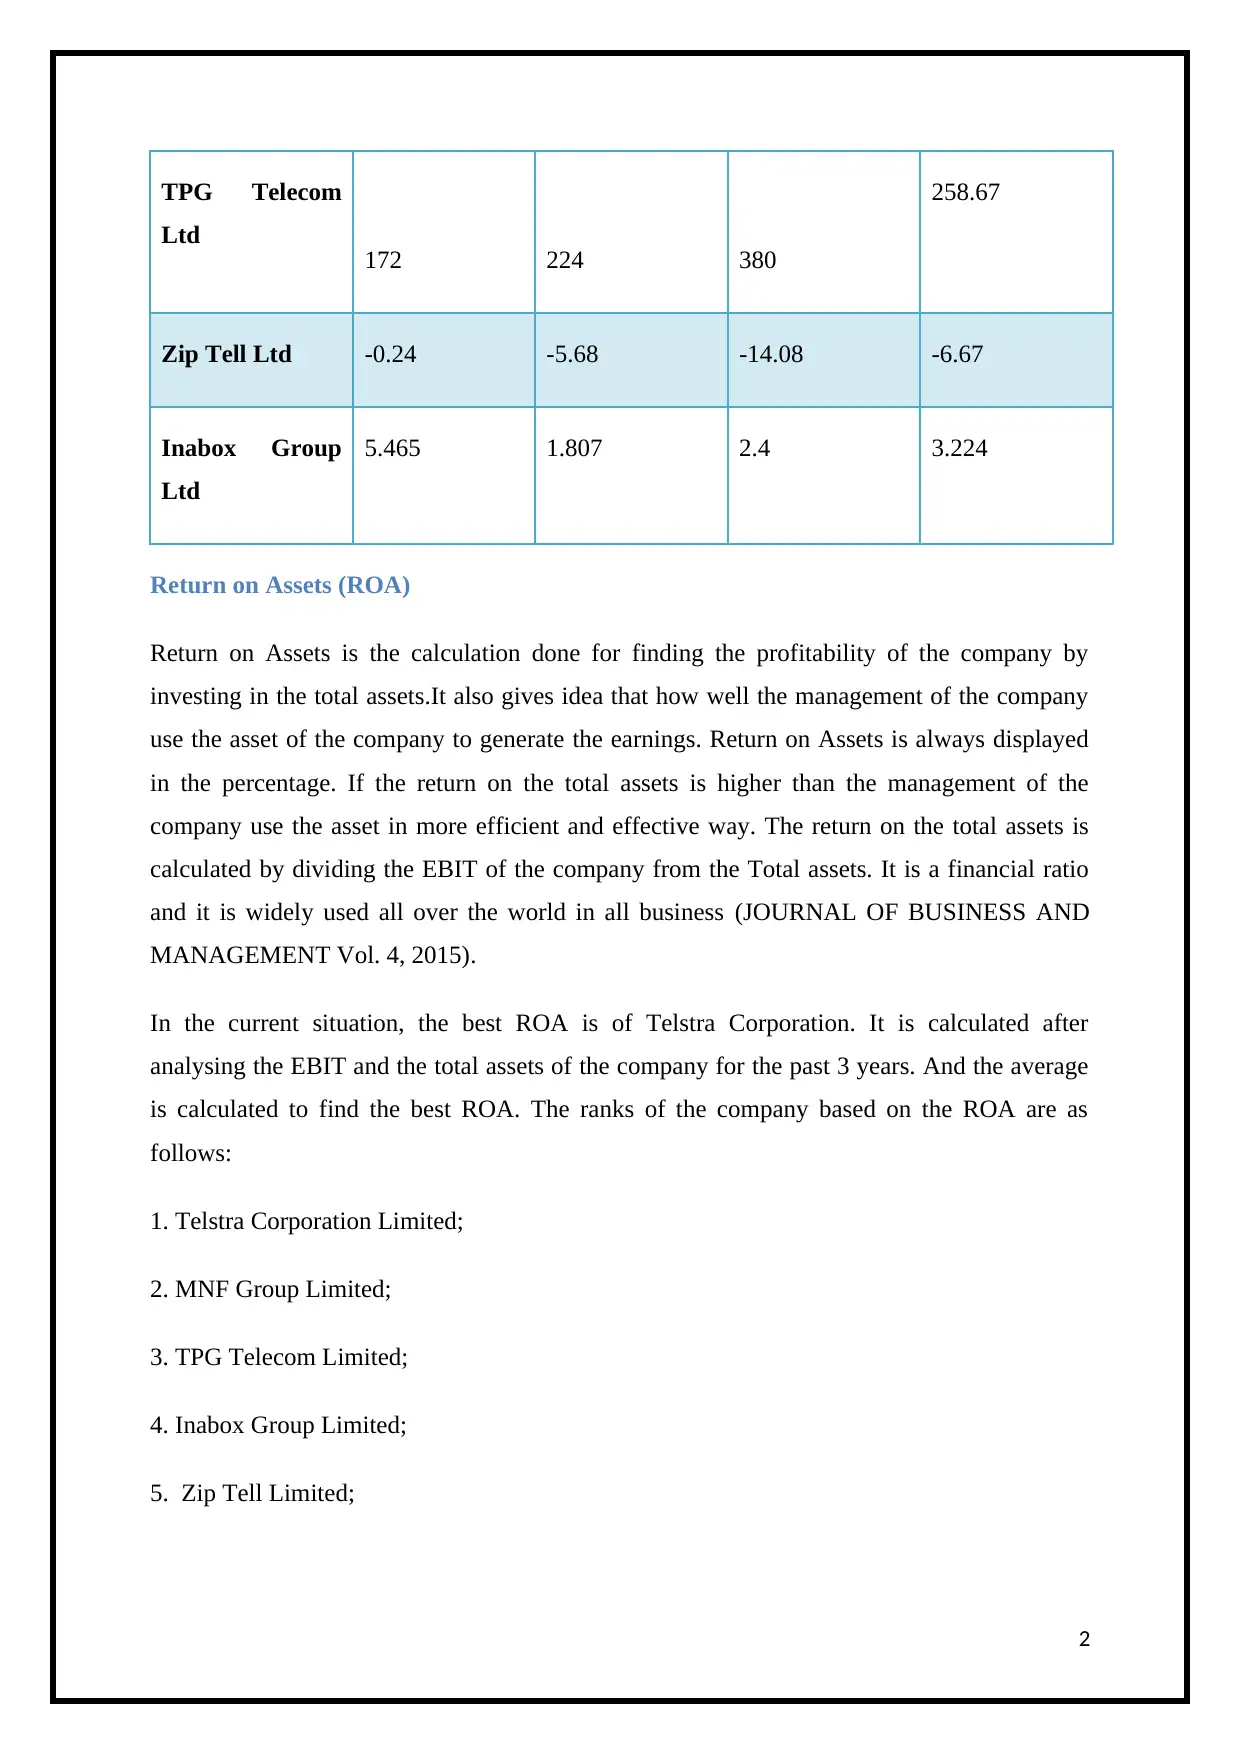
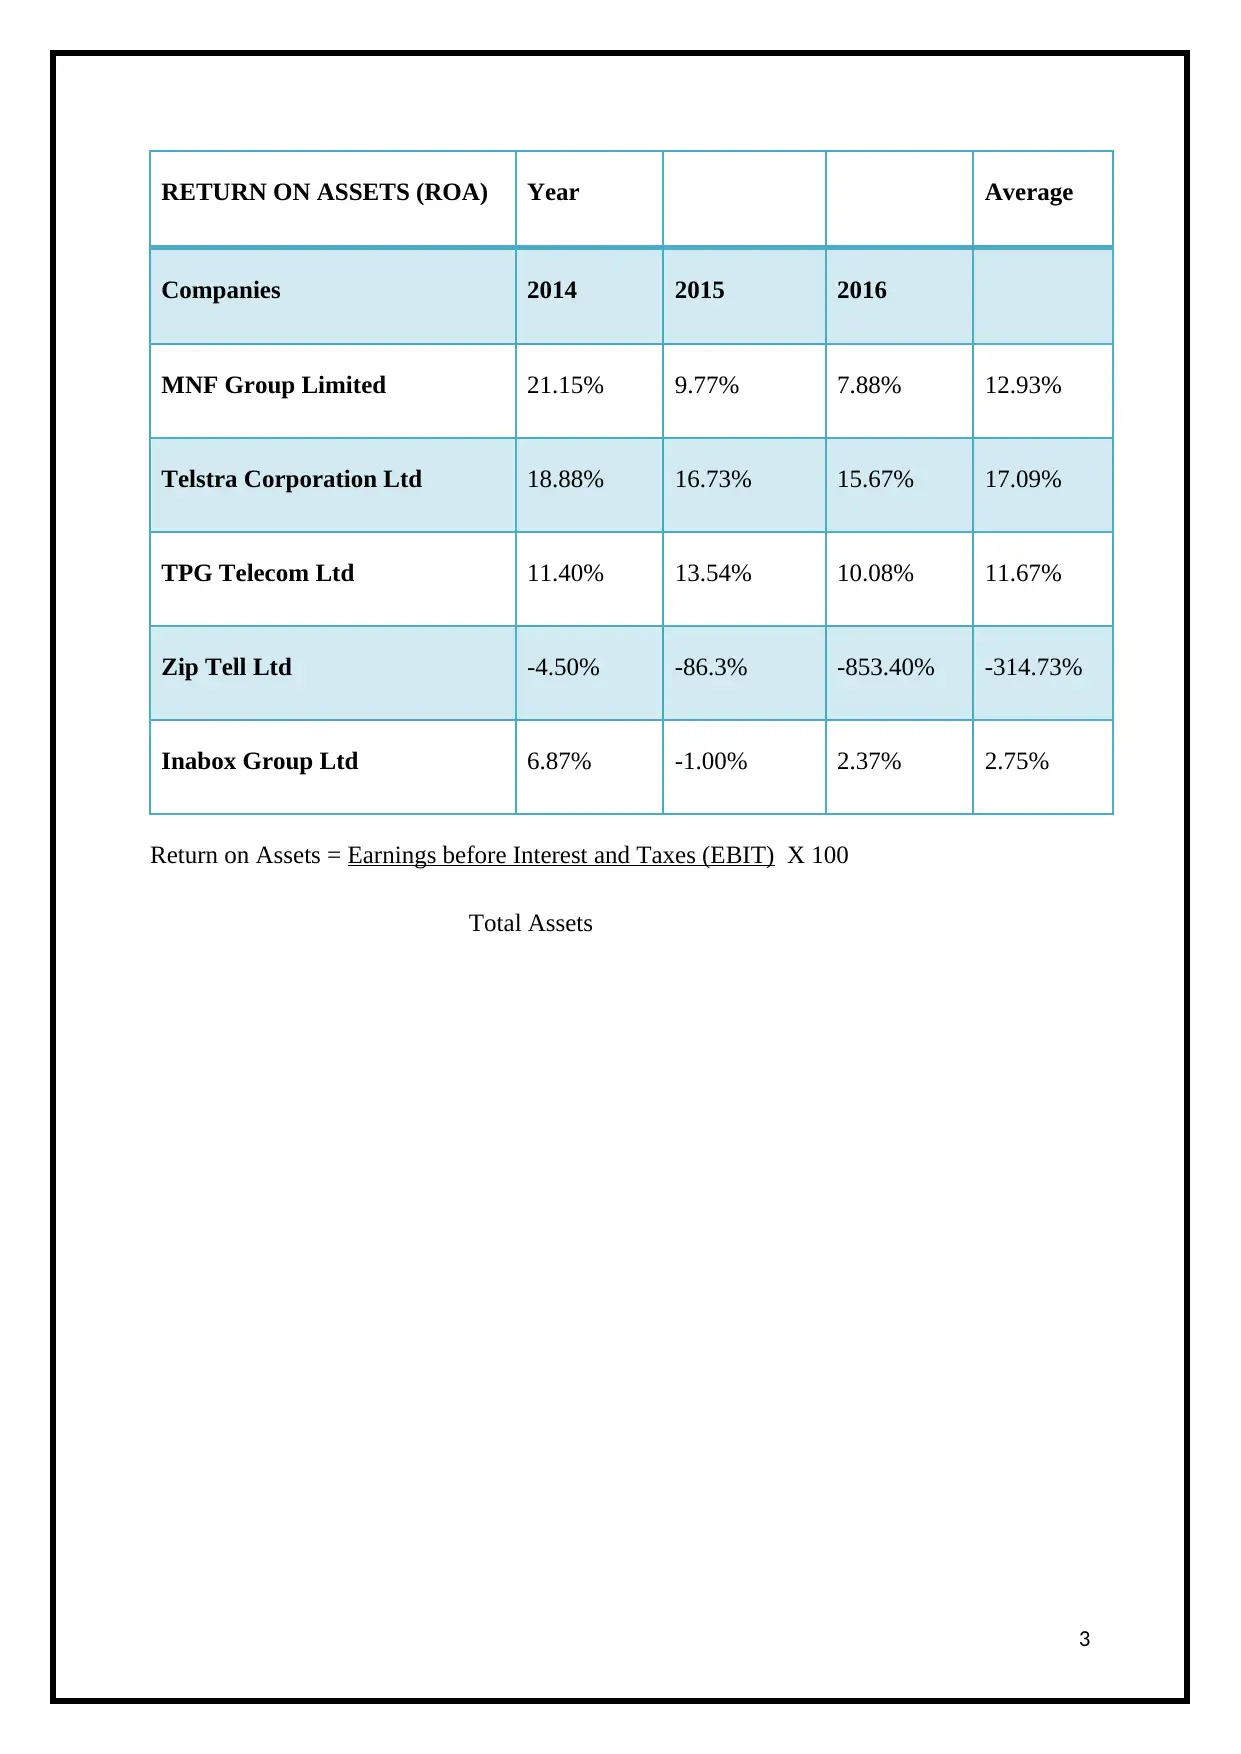
This report evaluates the financial performance of five companies in the telecom industry, focusing on Earnings Before Interest and Taxes (EBIT) and Return on Assets (ROA). The analysis ranks the companies based on their EBIT and ROA over a three-year period (2014-2016). MNF Group Limited is identified as the most profitable based on its highest EBIT, followed by Telstra Corporation, TPG Telecom, Inabox, and Zip Tell Ltd. The ROA analysis reveals that Telstra Corporation has the best ROA. The report uses financial ratios and provides an understanding of how well the management of the company uses assets to generate earnings. The data includes EBIT and ROA values for each company, allowing for a comparative analysis of their financial health and performance within the telecom sector. The report references relevant financial literature to support the analysis.
Document Page
Evaluation of five companies in telecom industry
EBIT and Return on Assets of five companies in the telecom industry are evaluated by
analyst and gave them rank on the basis of their performance.
EBIT
Earnings before Interest and Taxes are the operating income of the company. It only
considers the internal factors to measure the profit of the company from its main business
activities. If the EBIT of a company is higher than the company can easily pay its debts in
future. When operating expenses are deducted from the operating income the result is called
as Earnings before interest and tax. In the current assignment, the analyst has taken five
telecom companies and measures their profits and give them rank. MNF Group Limited is the
most profitable company because its EBIT is highest among the five companies. And the
second is the Telstra, third is TPG Telecom, fourth is Inabox and the last is Zip Tell Ltd
(Telstra, 2014). ROA is the return on the assets invested in the business. It is calculated by
the EBIT or net income divided by the total assets. If the EBIT is high than the return on the
assets is more but if the EBIT is low than the return on the assets is also low. The return on
assets will always dependent on EBIT and they have a direct relationship.
The policies framed by the MNF Group are best because their policies help them in earning a
good income in the core activities of the business.
EBIT($million)
Companies 2014 2015 2016 Average
MNF Group
Limited
5780 7520 9190 7496.67
Telstra
Corporation Ltd 7445 6779 6792
7005.33
1
tabler-icon-diamond-filled.svg

Paraphrase This Document

Need a fresh take? Get an instant paraphrase of this document with our AI Paraphraser
Document Page
TPG Telecom
Ltd 172 224 380
258.67
Zip Tell Ltd -0.24 -5.68 -14.08 -6.67
Inabox Group
Ltd
5.465 1.807 2.4 3.224
Return on Assets (ROA)
Return on Assets is the calculation done for finding the profitability of the company by
investing in the total assets.It also gives idea that how well the management of the company
use the asset of the company to generate the earnings. Return on Assets is always displayed
in the percentage. If the return on the total assets is higher than the management of the
company use the asset in more efficient and effective way. The return on the total assets is
calculated by dividing the EBIT of the company from the Total assets. It is a financial ratio
and it is widely used all over the world in all business (JOURNAL OF BUSINESS AND
MANAGEMENT Vol. 4, 2015).
In the current situation, the best ROA is of Telstra Corporation. It is calculated after
analysing the EBIT and the total assets of the company for the past 3 years. And the average
is calculated to find the best ROA. The ranks of the company based on the ROA are as
follows:
1. Telstra Corporation Limited;
2. MNF Group Limited;
3. TPG Telecom Limited;
4. Inabox Group Limited;
5. Zip Tell Limited;
2
Document Page
RETURN ON ASSETS (ROA) Year Average
Companies 2014 2015 2016
MNF Group Limited 21.15% 9.77% 7.88% 12.93%
Telstra Corporation Ltd 18.88% 16.73% 15.67% 17.09%
TPG Telecom Ltd 11.40% 13.54% 10.08% 11.67%
Zip Tell Ltd -4.50% -86.3% -853.40% -314.73%
Inabox Group Ltd 6.87% -1.00% 2.37% 2.75%
Return on Assets = Earnings before Interest and Taxes (EBIT) X 100
Total Assets
3
Document Page
Bibliography
JOURNAL OF BUSINESS AND MANAGEMENT Vol. 4, N. 2.-2. (2015). THE IMPACT
OF EARNINGS PER SHARE, DEBT TO EQUITY RATIO, AND CURRENT
RATIO TOWARDS THE PROFITABILITY OF COMPANIES LISTED IN LQ45
FROM 2009 TO 2013.
Telstra. (2014). TELSTRA CORPORATION LIMITED AND CONTROLLED ENTITIES.
Retrieved from http://static.ice4.interactiveinvestor.com.au.s3-website-ap-southeast-
2.amazonaws.com/telstra/Telstra1401/AnnualReport2014/EN/pdf_full/
Telstra_2014_Merged_WithoutCovers-upload.pdf
4
chevron_up_icon
1 out of 4
circle_padding
hide_on_mobile
zoom_out_icon
[object Object]