Economics Report: Market Structure of Telecom Industry Analysis
VerifiedAdded on 2022/08/16
|17
|2739
|25
Report
AI Summary
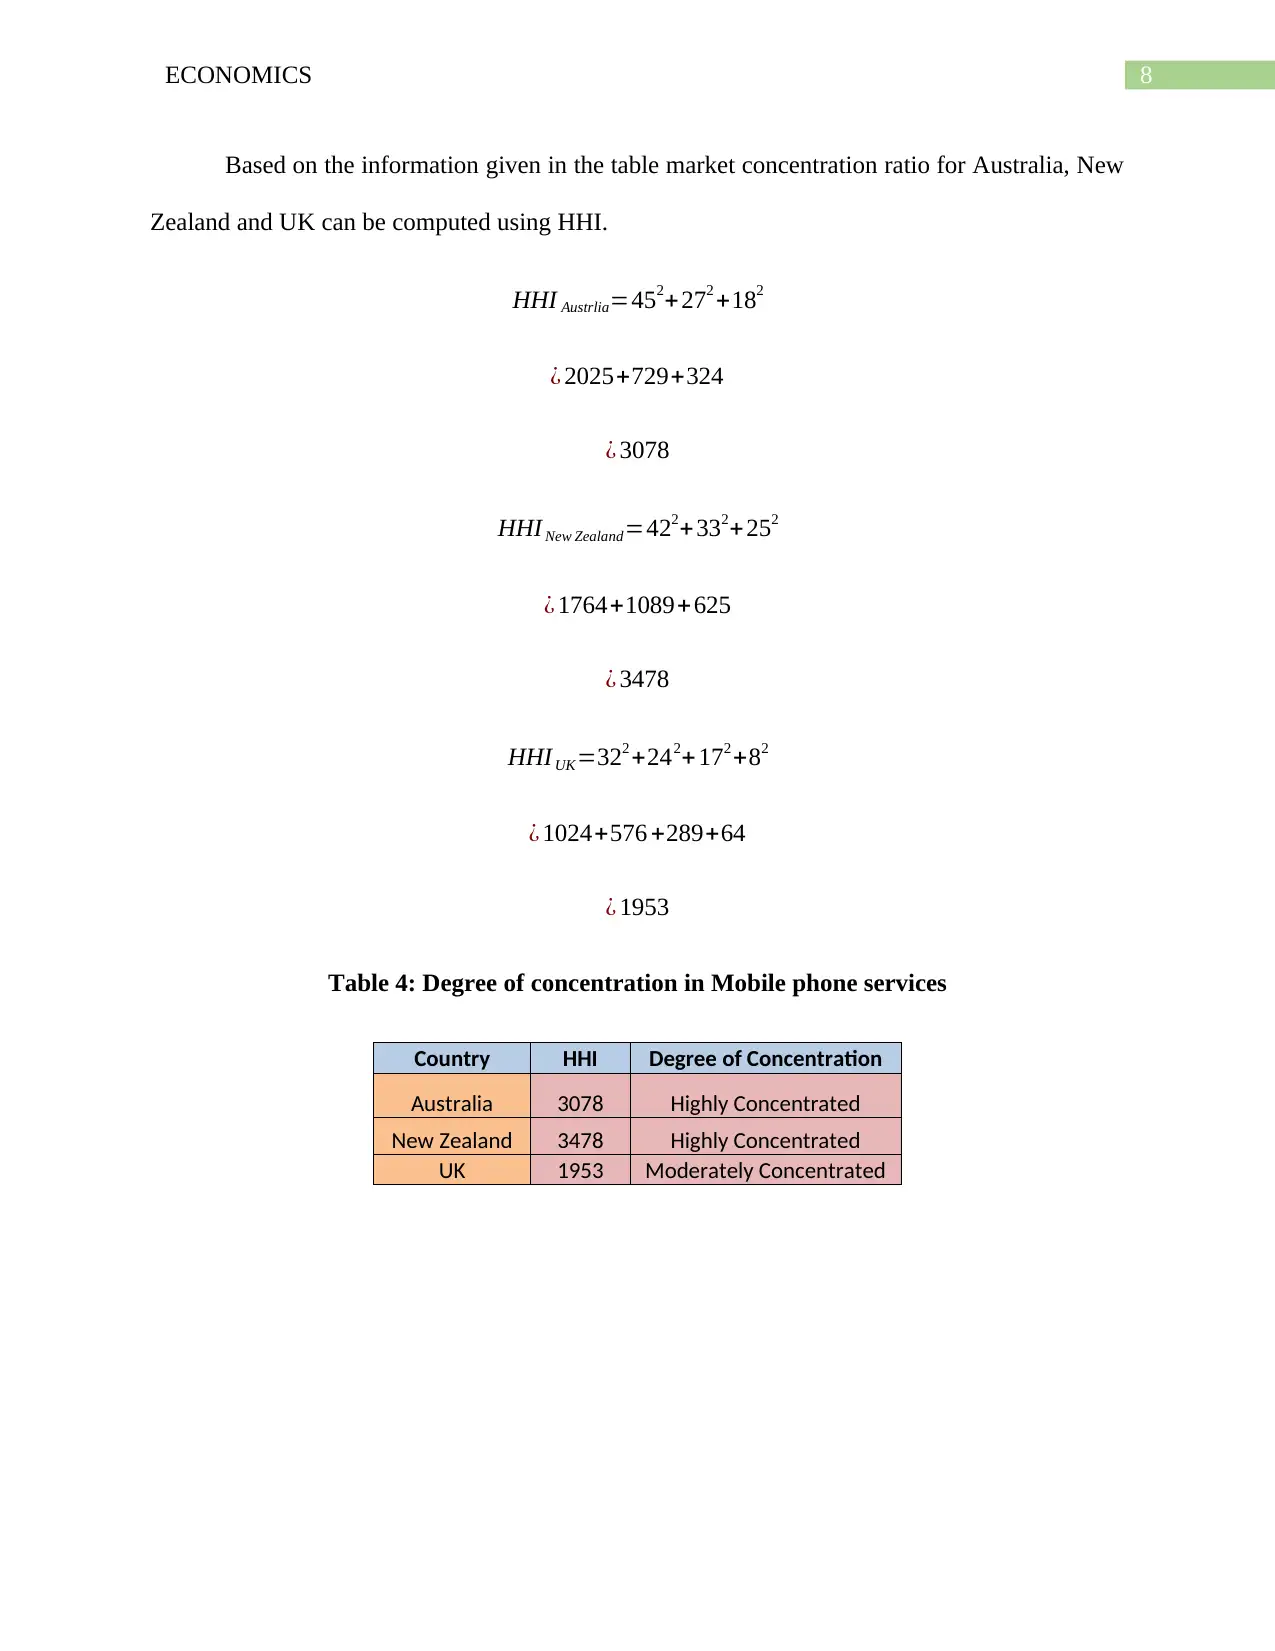
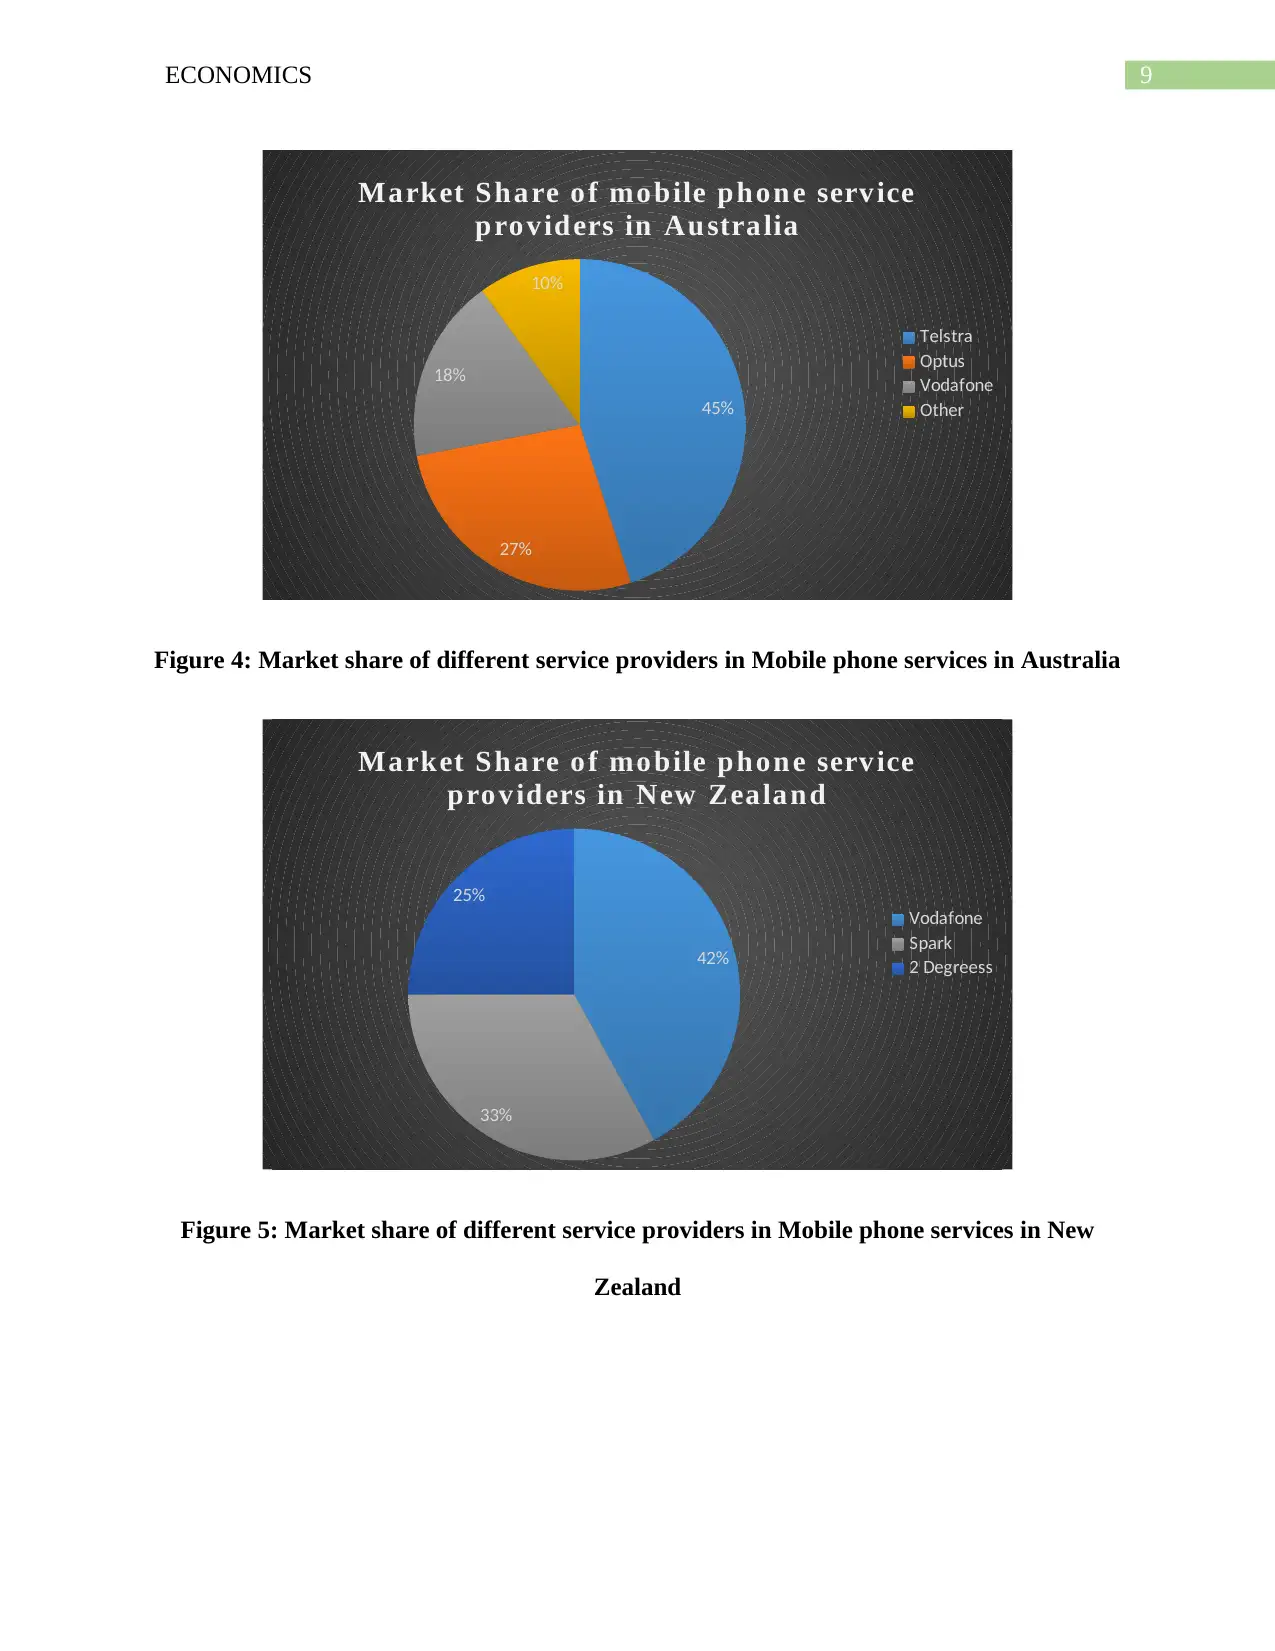
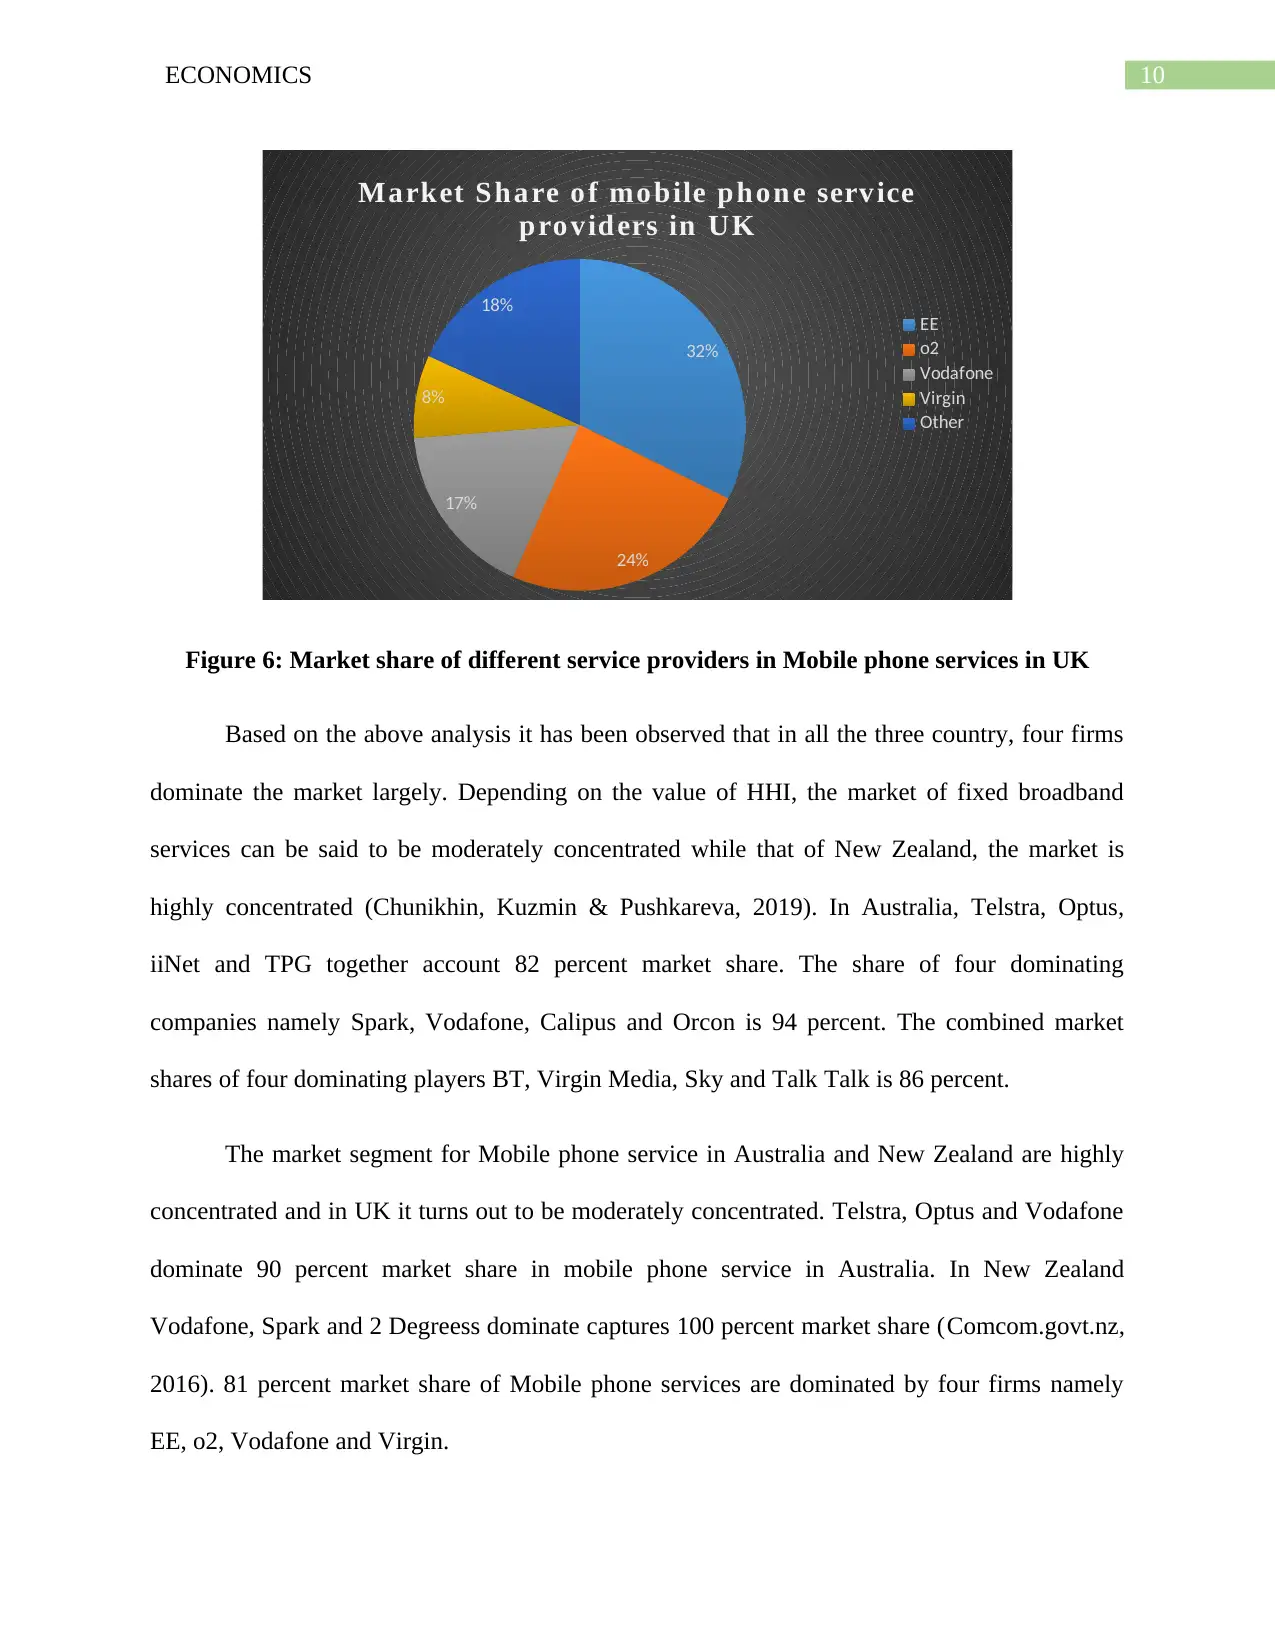
This report analyzes the market structure of the telecommunications industry in Australia, New Zealand, and the UK. It examines market concentration for fixed broadband and mobile phone services using the Herfindahl-Hirschman Index (HHI), revealing an oligopoly market structure dominated by a few firms. The report discusses the potential for price premiums charged by these dominant players and their impact on consumers. Furthermore, it explores government strategies to boost competition, reduce prices, and improve consumer welfare within the telecommunications sector. The analysis includes detailed market share breakdowns, HHI calculations, and a discussion of premium pricing strategies, concluding with recommendations for fostering a more competitive market environment.

Running head: ECONOMICS
Economics
Name of the Student
Name of the University
Course ID
Economics
Name of the Student
Name of the University
Course ID
Paraphrase This Document
Need a fresh take? Get an instant paraphrase of this document with our AI Paraphraser

1ECONOMICS
Executive Summary
The report intends to analyze market structure of telecommunication industry in
Australia, New Zealand and UK. Market concentration has been examined separately for fixed
broadband and mobile phone service. The computed value of Herfindahl-Hirschman Index
suggests high degree of concentration in the telecommunication industry. Because of dominance
of three or four firms the telecommunication market has an oligopoly market structure. Sellers
have significant market power and charge premium price for telecom services. This higher price
increases consumers’ burden and hinders different other areas of development. Government
should encourage competition in the industry and adapt strategies to bring down prices in the
telecom sector.

2ECONOMICS
Table of Contents
Introduction......................................................................................................................................3
Market structure of telecommunication industry.............................................................................3
Fixed Broadband..........................................................................................................................4
Mobile phone service...................................................................................................................7
Premiums in pricing.......................................................................................................................11
Government strategy to boost competition in telecommunication industry of Australia..............13
Conclusion.....................................................................................................................................14
References......................................................................................................................................15
⊘ This is a preview!⊘
Do you want full access?
Subscribe today to unlock all pages.

Trusted by 1+ million students worldwide

3ECONOMICS
Introduction
Telecommunication industry in Australia plays an important role in maintain strong
connectivity among the dispersed population. Government has significant contribution in
development of telecommunication and plays a critical role in designing regulation of the sector
(Pugh, 2019). In the financial year of 2017-18, the sector generated an annual revenue of $44
billion. The revenue is expected to increase to $47 billion by 2021-22. The report evaluates
market structure based on degree of concentration in the telecommunication industry of
Australia. In addition to evaluating market structure of telecom sector in Australia, the paper also
examines the market structure of telecom in New Zealand and UK. After analyzing the market
structure the paper attempts to find out whether sellers in the industry are in a position to obtain
price premium and winners and losers of such premium pricing. Finally, some recommendations
are given regarding the strategy that government of Australia can adapt to lower prices in the
industry.
Market structure of telecommunication industry
Market structure of a particular product or service is determined from the number of
buyers and sellers in the market and degree of competition (Fine, 2016). In order to evaluate
market structure of telecommunication industry of Australia, New Zealand and UK the market
share of major operators have been analyzed. Herfindahl-Hirschman Index (HHI) is an important
tool used for determining degree of concentration and competitiveness within the market. The
index is computed by taking sum of squares of market share of firms operating in the market.
The value of HHI varies from near zero to 1000. Based on the value of the HHI, market
concentration is determined. As per U.S. department of Justice, a value of HHI less than 1500
indicates market place to be competitive (Cracau & Lima, 2016). Value of HHI between 1500
Paraphrase This Document
Need a fresh take? Get an instant paraphrase of this document with our AI Paraphraser

4ECONOMICS
and 2500 indicates market to be moderately concentrated while value exceeding 2500 or larger
means a highly concentrated market. The formula for HHI is given as
HHI =s1
2 + s2
2 +s2
2 +… … … …+sn
2
Sn: Market share of firm n which is represented as whole number.
In order to get a clear idea about degree of competition in the telecommunication
industry, it is divided into two segment namely ‘Fixed Broadband’ and ‘Mobile Phone Service’.
Market concentration has been evaluated separately for each segment.
Fixed Broadband
Table 1: Break down of market share of different service providers
Australia New Zealand UK
Provider Market
Share
Provider Market
Share
Provider Market
Share
Telstra 41 Spark 49 BT 31
Optus 14 Vodafone 32 Virgin Media 20
iiNet 15 Calipus 8 Sky 20
TPG 12 Orcon 5 Talk Talk 15
Other 18 Other 6 Other 13
Based on the information given in the table four firm concentration ratio for Australia, New
Zealand and UK can be computed using HHI.

5ECONOMICS
HHI Austrlia=412+142 +152+122
¿ 1681+196+225+144
¿ 144
HHI New Zealand=492 +322+ 82 +52
¿ 2401+1024+64 +25
¿ 3514
HHI UK=312 +202 +202 +152
¿ 961+ 400+400+225
¿ 1986
Table 2: Degree of concentration in Fixed Broadband segment
Country HHI Degree of Concentration
Australia 2246 Moderately Concentrated
New Zealand 3514 Highly Concentrated
UK 1986 Moderately Concentrated
⊘ This is a preview!⊘
Do you want full access?
Subscribe today to unlock all pages.

Trusted by 1+ million students worldwide

6ECONOMICS
41%
14%15%
12%
18%
Ma rket Sh a re o f fix ed b roa d ba nk
pro v id ers in Au stra lia
Telstra
Optus
iiNet
TPG
Other
Figure 1: Market share of different service providers in Fixed Broadband in Australia
49%
32%
8%
5% 6%
Ma rket Sh a re o f fix ed b roa d ba nd
pro v id ers in New Z ea la n d
Spark
Vodafone
Calipus
Orcon
Other
Figure 2: Market share of different service providers in Fixed Broadband in New Zealand
Paraphrase This Document
Need a fresh take? Get an instant paraphrase of this document with our AI Paraphraser

7ECONOMICS
31%
20%20%
15%
13%
Ma rket Sh a re o f fix ed b roa d ba nd
pro v id ers in UK
BT
Virgin Media
Sky
Talk Talk
Other
Figure 3: Market share of different service providers in Fixed Broadband in UK
Mobile phone service
Table 3: Break down of market share of different service providers
Australia New Zealand UK
Provider Market
Share
Provider Market
Share
Provider Market
Share
Telstra 45 Vodafone 42 EE 32
Optus 27 Spark 33 o2 24
Vodafone 18 2 Degreess 25 Vodafone 17
Other 10 Virgin 8
Other 18

8ECONOMICS
Based on the information given in the table market concentration ratio for Australia, New
Zealand and UK can be computed using HHI.
HHI Austrlia=452+272 +182
¿ 2025+729+324
¿ 3078
HHI New Zealand=422+332+252
¿ 1764+1089+625
¿ 3478
HHIUK=322 +242+ 172 +82
¿ 1024+576 +289+64
¿ 1953
Table 4: Degree of concentration in Mobile phone services
Country HHI Degree of Concentration
Australia 3078 Highly Concentrated
New Zealand 3478 Highly Concentrated
UK 1953 Moderately Concentrated
⊘ This is a preview!⊘
Do you want full access?
Subscribe today to unlock all pages.

Trusted by 1+ million students worldwide

9ECONOMICS
45%
27%
18%
10%
Ma rket Sh a re o f mo bile pho n e serv ice
pro v id ers in Au stra lia
Telstra
Optus
Vodafone
Other
Figure 4: Market share of different service providers in Mobile phone services in Australia
42%
33%
25%
Ma rket Sh a re o f mo bile pho n e serv ice
pro v id ers in New Zea la n d
Vodafone
Spark
2 Degreess
Figure 5: Market share of different service providers in Mobile phone services in New
Zealand
Paraphrase This Document
Need a fresh take? Get an instant paraphrase of this document with our AI Paraphraser

10ECONOMICS
32%
24%
17%
8%
18%
Ma rket Sh a re o f mo bile pho n e serv ice
pro v id ers in UK
EE
o2
Vodafone
Virgin
Other
Figure 6: Market share of different service providers in Mobile phone services in UK
Based on the above analysis it has been observed that in all the three country, four firms
dominate the market largely. Depending on the value of HHI, the market of fixed broadband
services can be said to be moderately concentrated while that of New Zealand, the market is
highly concentrated (Chunikhin, Kuzmin & Pushkareva, 2019). In Australia, Telstra, Optus,
iiNet and TPG together account 82 percent market share. The share of four dominating
companies namely Spark, Vodafone, Calipus and Orcon is 94 percent. The combined market
shares of four dominating players BT, Virgin Media, Sky and Talk Talk is 86 percent.
The market segment for Mobile phone service in Australia and New Zealand are highly
concentrated and in UK it turns out to be moderately concentrated. Telstra, Optus and Vodafone
dominate 90 percent market share in mobile phone service in Australia. In New Zealand
Vodafone, Spark and 2 Degreess dominate captures 100 percent market share (Comcom.govt.nz,
2016). 81 percent market share of Mobile phone services are dominated by four firms namely
EE, o2, Vodafone and Virgin.

11ECONOMICS
The discussion on market concentration in Fixed Broadband and Mobile phone services
suggest that both the segments are highly concentrated among few large players. The market
structure of telecommunication industry therefore can be classified as having an oligopoly
market structure (Kreps, 2019).
Premiums in pricing
As discussed in the previous section, the telecommunication industry has an oligopolistic
market structure characterized by dominance of few large sellers. Since large dominating firms
enjoy a large market share they possess significant market power. Sellers in this market act as
price makers instead of being price taker in the competitive market. This allows sellers to employ
the strategy of premium pricing. Premium pricing refers to the strategy of sellers to charge a
higher price relative to its competitors in order to portrait its product as a high quality product to
the mind of its customers (Hinterhuber & Liozu, 2018). Under this strategy customers have to
pay a price premium for enjoying product or service of the particular brand. The objective behind
charging a price premium is to create the image that product of the particular brand must be
higher quality as indicated by the high price. In case of telecommunication market the incumbent
seller charges a high price premium with the promise of an uninterrupted connectivity (Berman,
2015). In Australia, Telstra is a dominating player both for fixed broadband and mobile phone
service. For fixed line services, it has been found that consumer pay nearly $23.70 higher for a
plan offered by Telstra compared to a similar plan provided by TPG, iiNet or any other service
providers except Optus (Communications.gov.au, 2020). After Telstra, Optus is the second
dominating player in the industry. For Optus service consumers price premium is $8 lower than
Telstra. In case of mobile phone service, consumers need to pay 50 percent higher price with
Telstra compared to other carrier. Telstra imposes an addition premium of $13.3 monthly for
⊘ This is a preview!⊘
Do you want full access?
Subscribe today to unlock all pages.

Trusted by 1+ million students worldwide
1 out of 17
Related Documents
Your All-in-One AI-Powered Toolkit for Academic Success.
+13062052269
info@desklib.com
Available 24*7 on WhatsApp / Email
Unlock your academic potential
Copyright © 2020–2025 A2Z Services. All Rights Reserved. Developed and managed by ZUCOL.


