Corporate Accounting Analysis: Telstra Corporation Annual Report
VerifiedAdded on 2021/05/31
|12
|2777
|22
Report
AI Summary
This report provides a comprehensive analysis of Telstra Corporation's corporate accounting practices, focusing on the cash flow statement, comprehensive income statement, and income tax implications. The analysis examines the company's financial performance over multiple years, comparing key metrics such as net cash flow from operating, investing, and financing activities. The report delves into the components of the comprehensive income statement, including profit from continuing operations and other comprehensive income items, and assesses the effective income tax rates and deferred tax liabilities. Furthermore, it explores the relationship between income tax expense, income tax paid, and the reconciliation of tax expenses to tax payable. The analysis concludes by highlighting the key findings from Telstra's annual report, providing a detailed understanding of the company's financial position and performance. The report uses the financial data available in Telstra's annual reports to analyze the company's performance and provides a comparative analysis of the financial data.
Running head: CORPORATE ACCOUNTING
Corporate accounting
Name of the Student
Name of the University
Author Note
Corporate accounting
Name of the Student
Name of the University
Author Note
Paraphrase This Document
Need a fresh take? Get an instant paraphrase of this document with our AI Paraphraser
1CORPORATE ACCOUNTING
Table of Contents
Requirement 1............................................................................................................................2
Requirement 2............................................................................................................................4
Requirement 3............................................................................................................................4
Requirement 4............................................................................................................................5
Requirement 5............................................................................................................................5
Requirement 6............................................................................................................................5
Requirement 7............................................................................................................................6
Requirement 8............................................................................................................................6
Requirement 9............................................................................................................................7
Requirement 10..........................................................................................................................7
Requirement 11..........................................................................................................................7
Appendix..................................................................................................................................10
2CORPORATE ACCOUNTING
In order to analyze the annual report the chosen organisation listed on the Australian
Stock exchange (ASX) is Telstra Corporation which is the largest telecommunications
business in Australia. Telstra Corporation is a media and telecommunications company in
Australia that operates as well as facilitates networks of telecommunications, mobile, access
to internet, markets voice, pay television and other entertainment services along with the
products.
Requirement 1
The Cash flow statement of the Telstra corporations is segregated into three categories
which are namely cash from operating activities, financing activities cash and investing
activities cash (Damodaran 2016). The items that are listed under the cash from operating
activities are receipts from customers that amounts to $31,288m, payments to suppliers and
employees -$21,179m, government grants received $235 182m, net placement of deposits by
Autohome Inc. all the amounts has taken place in the financial year of 2017. It can be seen
from the statement that there has been decrease in net cash outflow from $ 8133 m in year
2016 compared to $ 7775 m in year 2017. This fall in net cash flow is due to decrease in
payment made to suppliers and employees and fall in the expenditure on mining interests.
Then comes the cash from investing activities is divided into three parts first includes
cash out flow before investments, second deals with the various investments and the third
involves the cash outflows after the investments. The first segment consists of payments from
plant, property and equipment and intangible assets. The second part has the heads capital
expenditures that totals to $5466m. The third segment shows a total cash outflow of $4279m
in 2017 that consists of the proceeds from the sales, investment and the interests. The total
cash flow from investing activities has been reduced in case of Telstra Corporation from
$5926 in 2016 to $3496 in 2017. However, there has been a drastic increase in the cash flow
in the financing activities. The amount increased from $3777m to $6104.it can be said that
⊘ This is a preview!⊘
Do you want full access?
Subscribe today to unlock all pages.
Trusted by 1+ million students worldwide
3CORPORATE ACCOUNTING
there has been more cash flow in the financing activities that deals with borrowing,
repayments, share buy backs, finance cost and dividends.
The cash flow statement of Telstra Corporation ends with the cash and cash
equivalents changes during the year. The net cash and cash equivalents has been decreased
drastically from $3550m in 2016 to $936m in 2017.thismay be due to the increase in
expenses more than the incomes. The table below in the appendix represents the individual
cash flow items of the company of Telstra.
Requirement 2
Comparative analysis of three different categories of cash flow:
Particular
2015 in
$m
2016 in
$m
2017 in
$m
Net cash flow from operating
activities 10,066 9,526 9,993
Net cash flow from investing
activities -5,692 -4,279 -2,207
Net cash flow from financing
activities -6,882 -6,104 -3,777
The table above represents the comparative analysis of cash flow from operating
activities, financing activities and investing activities. Net cash flow from operating activities
remained more or less constant in the last three years. However, it declined from year 2015
from $10,066 to $9,526 and $9,993 in year 2016 and 2017. There was net cash flow used in
financing activities in year 2017 at amount -$3,777compared to -$ 6,882 in year 2015. On
other hand, from investing activities, there was increase in cash flow to -$ 2,207 in year 2017
as against -$5,692 in 2015.
Paraphrase This Document
Need a fresh take? Get an instant paraphrase of this document with our AI Paraphraser
4CORPORATE ACCOUNTING
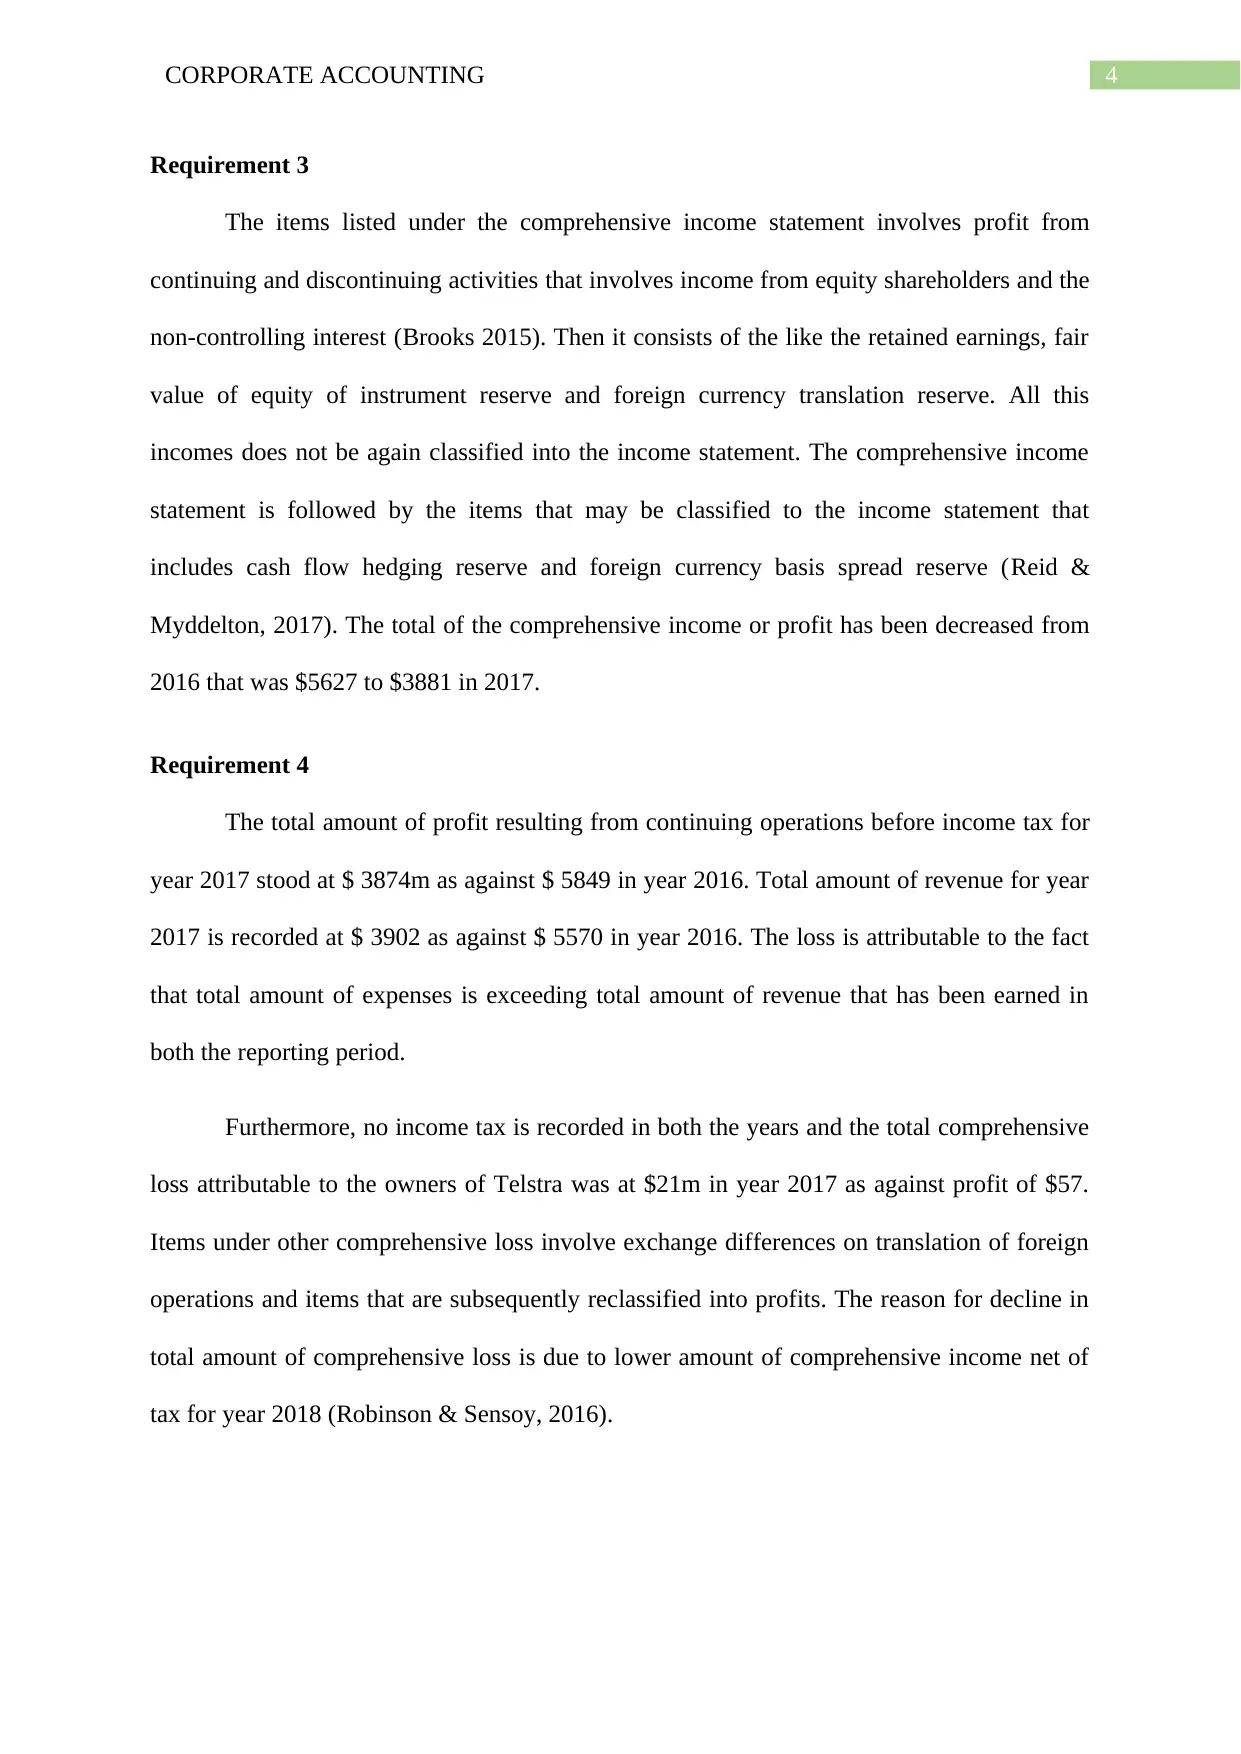
Requirement 3
The items listed under the comprehensive income statement involves profit from
continuing and discontinuing activities that involves income from equity shareholders and the
non-controlling interest (Brooks 2015). Then it consists of the like the retained earnings, fair
value of equity of instrument reserve and foreign currency translation reserve. All this
incomes does not be again classified into the income statement. The comprehensive income
statement is followed by the items that may be classified to the income statement that
includes cash flow hedging reserve and foreign currency basis spread reserve (Reid &
Myddelton, 2017). The total of the comprehensive income or profit has been decreased from
2016 that was $5627 to $3881 in 2017.
Requirement 4
The total amount of profit resulting from continuing operations before income tax for
year 2017 stood at $ 3874m as against $ 5849 in year 2016. Total amount of revenue for year
2017 is recorded at $ 3902 as against $ 5570 in year 2016. The loss is attributable to the fact
that total amount of expenses is exceeding total amount of revenue that has been earned in
both the reporting period.
Furthermore, no income tax is recorded in both the years and the total comprehensive
loss attributable to the owners of Telstra was at $21m in year 2017 as against profit of $57.
Items under other comprehensive loss involve exchange differences on translation of foreign
operations and items that are subsequently reclassified into profits. The reason for decline in
total amount of comprehensive loss is due to lower amount of comprehensive income net of
tax for year 2018 (Robinson & Sensoy, 2016).
5CORPORATE ACCOUNTING
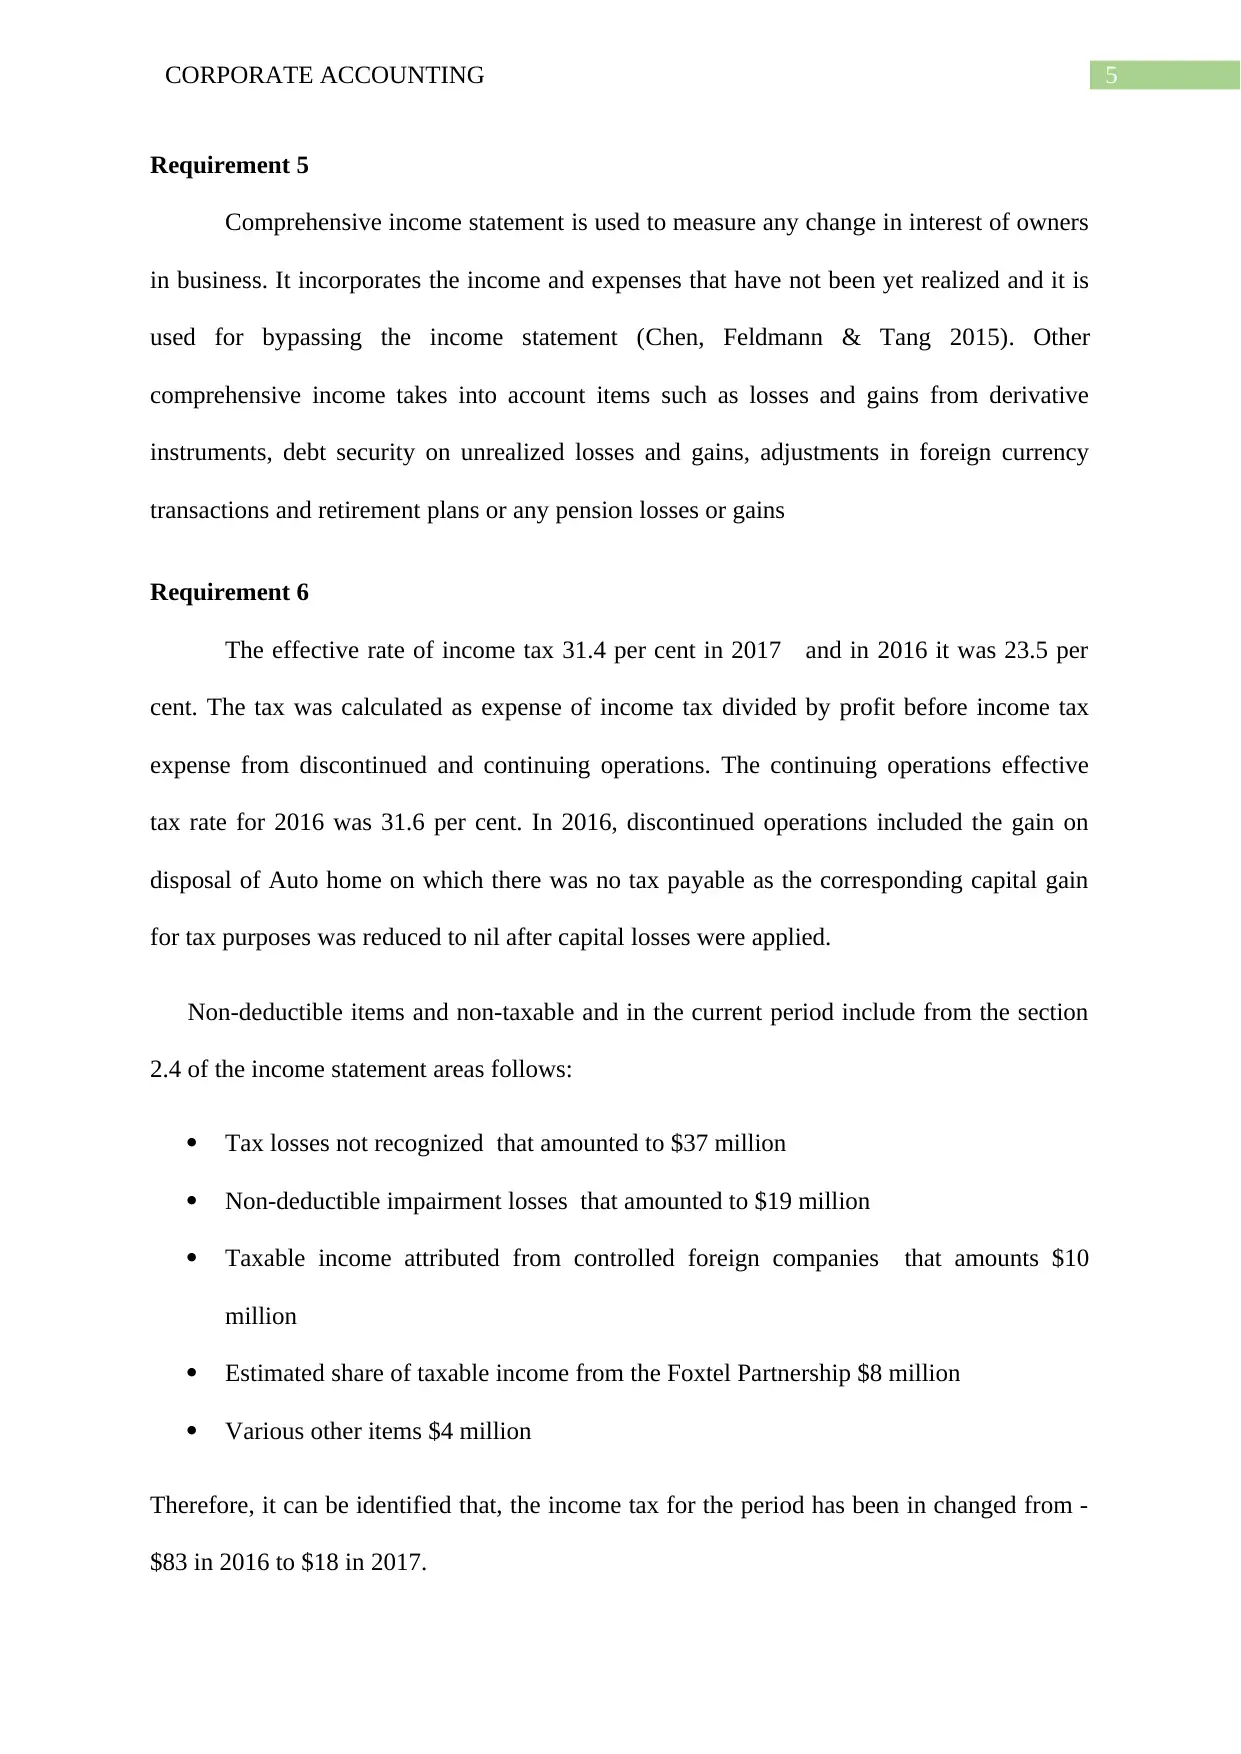
Requirement 5
Comprehensive income statement is used to measure any change in interest of owners
in business. It incorporates the income and expenses that have not been yet realized and it is
used for bypassing the income statement (Chen, Feldmann & Tang 2015). Other
comprehensive income takes into account items such as losses and gains from derivative
instruments, debt security on unrealized losses and gains, adjustments in foreign currency
transactions and retirement plans or any pension losses or gains
Requirement 6
The effective rate of income tax 31.4 per cent in 2017 and in 2016 it was 23.5 per
cent. The tax was calculated as expense of income tax divided by profit before income tax
expense from discontinued and continuing operations. The continuing operations effective
tax rate for 2016 was 31.6 per cent. In 2016, discontinued operations included the gain on
disposal of Auto home on which there was no tax payable as the corresponding capital gain
for tax purposes was reduced to nil after capital losses were applied.
Non-deductible items and non-taxable and in the current period include from the section
2.4 of the income statement areas follows:
Tax losses not recognized that amounted to $37 million
Non-deductible impairment losses that amounted to $19 million
Taxable income attributed from controlled foreign companies that amounts $10
million
Estimated share of taxable income from the Foxtel Partnership $8 million
Various other items $4 million
Therefore, it can be identified that, the income tax for the period has been in changed from -
$83 in 2016 to $18 in 2017.
⊘ This is a preview!⊘
Do you want full access?
Subscribe today to unlock all pages.
Trusted by 1+ million students worldwide
6CORPORATE ACCOUNTING
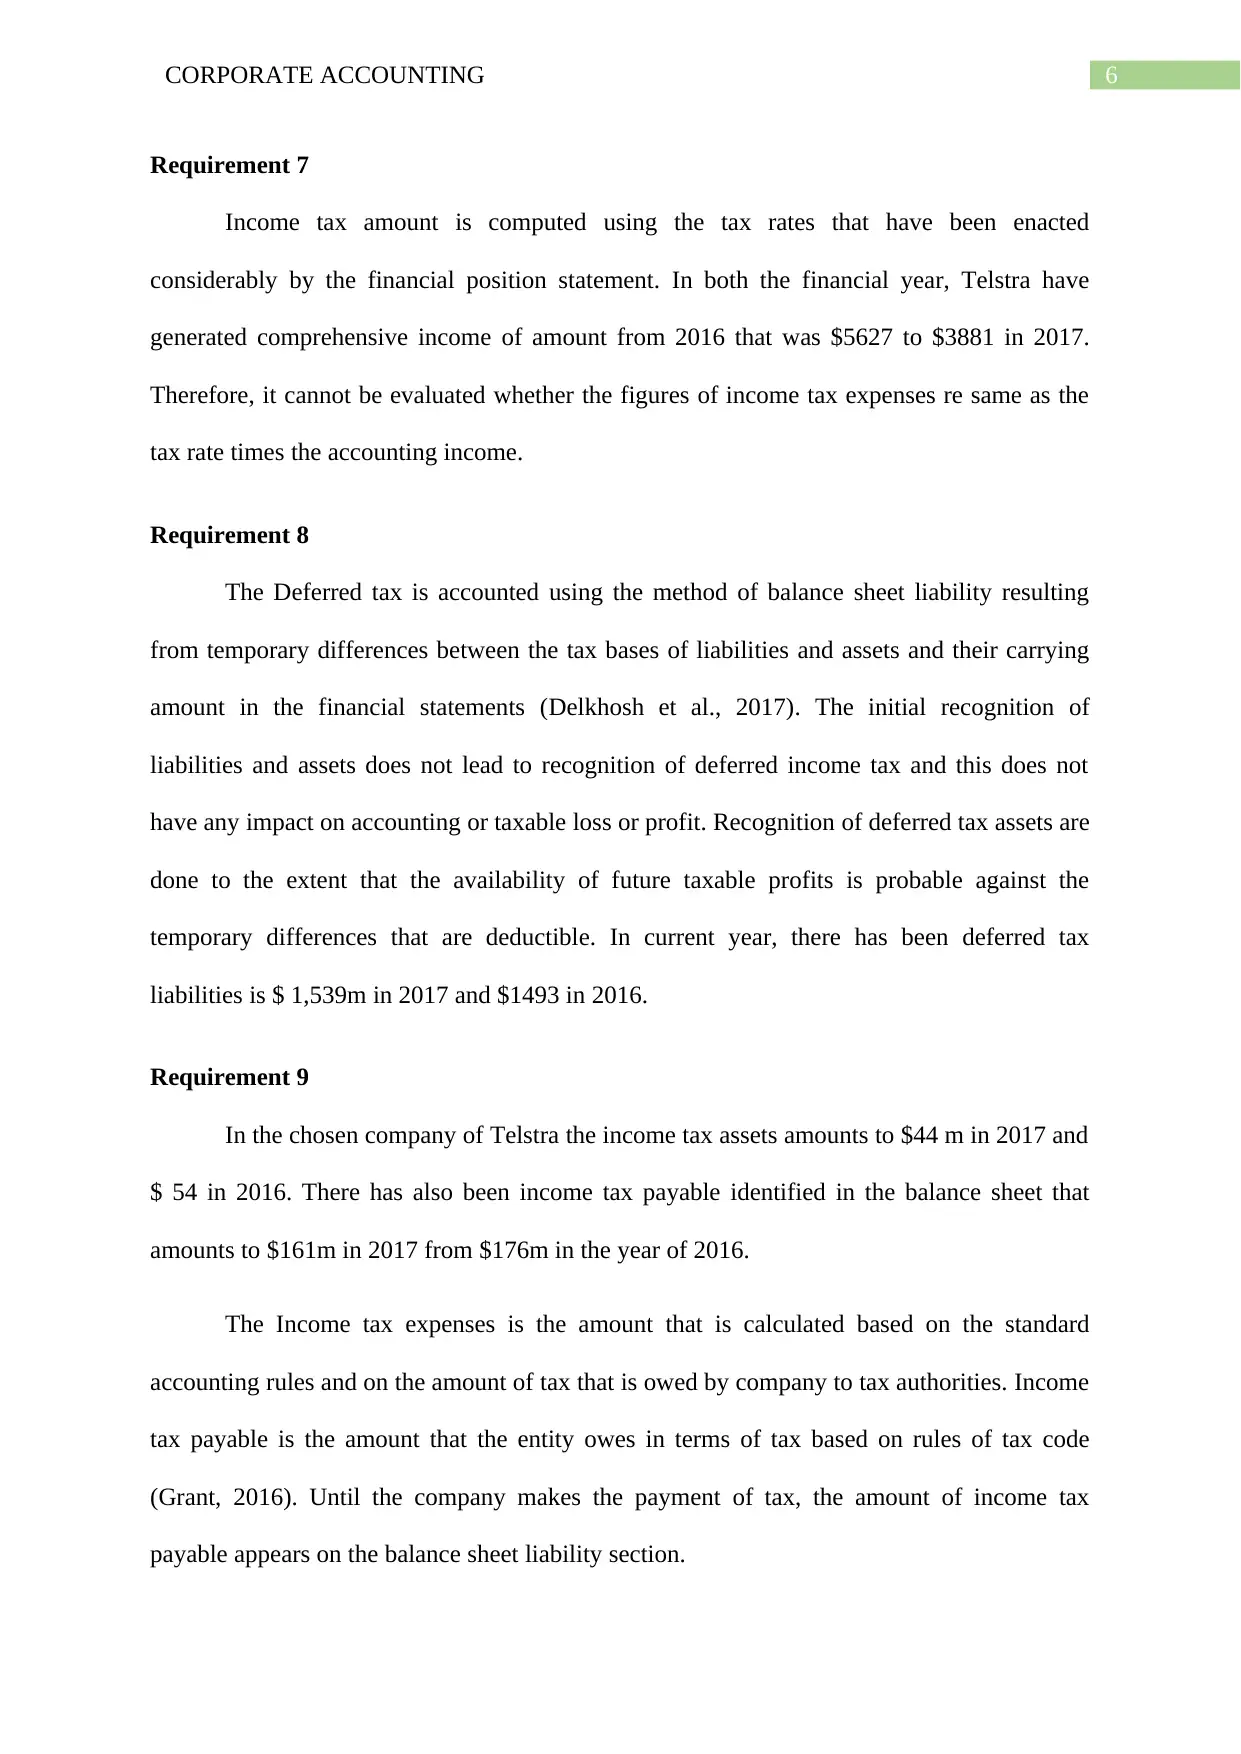
Requirement 7
Income tax amount is computed using the tax rates that have been enacted
considerably by the financial position statement. In both the financial year, Telstra have
generated comprehensive income of amount from 2016 that was $5627 to $3881 in 2017.
Therefore, it cannot be evaluated whether the figures of income tax expenses re same as the
tax rate times the accounting income.
Requirement 8
The Deferred tax is accounted using the method of balance sheet liability resulting
from temporary differences between the tax bases of liabilities and assets and their carrying
amount in the financial statements (Delkhosh et al., 2017). The initial recognition of
liabilities and assets does not lead to recognition of deferred income tax and this does not
have any impact on accounting or taxable loss or profit. Recognition of deferred tax assets are
done to the extent that the availability of future taxable profits is probable against the
temporary differences that are deductible. In current year, there has been deferred tax
liabilities is $ 1,539m in 2017 and $1493 in 2016.
Requirement 9
In the chosen company of Telstra the income tax assets amounts to $44 m in 2017 and
$ 54 in 2016. There has also been income tax payable identified in the balance sheet that
amounts to $161m in 2017 from $176m in the year of 2016.
The Income tax expenses is the amount that is calculated based on the standard
accounting rules and on the amount of tax that is owed by company to tax authorities. Income
tax payable is the amount that the entity owes in terms of tax based on rules of tax code
(Grant, 2016). Until the company makes the payment of tax, the amount of income tax
payable appears on the balance sheet liability section.
Paraphrase This Document
Need a fresh take? Get an instant paraphrase of this document with our AI Paraphraser
7CORPORATE ACCOUNTING
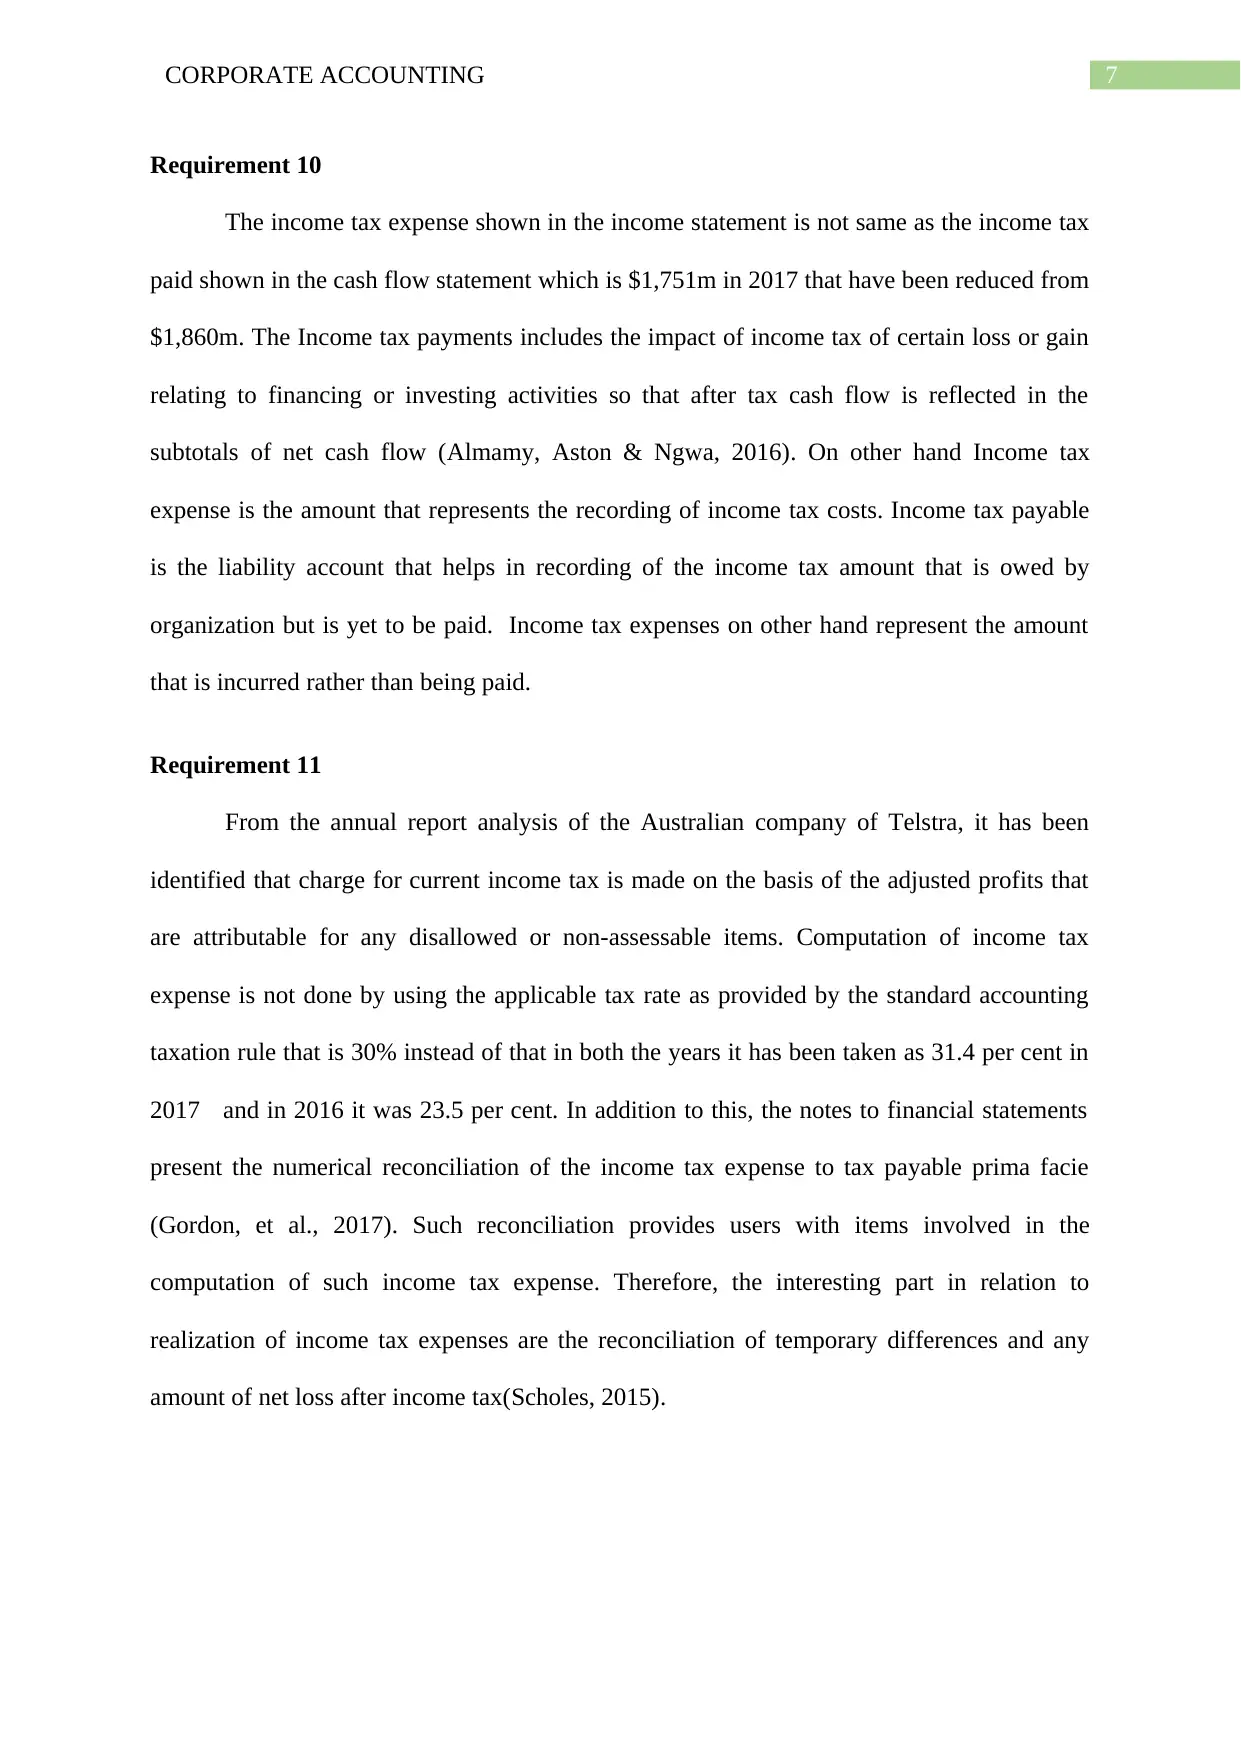
Requirement 10
The income tax expense shown in the income statement is not same as the income tax
paid shown in the cash flow statement which is $1,751m in 2017 that have been reduced from
$1,860m. The Income tax payments includes the impact of income tax of certain loss or gain
relating to financing or investing activities so that after tax cash flow is reflected in the
subtotals of net cash flow (Almamy, Aston & Ngwa, 2016). On other hand Income tax
expense is the amount that represents the recording of income tax costs. Income tax payable
is the liability account that helps in recording of the income tax amount that is owed by
organization but is yet to be paid. Income tax expenses on other hand represent the amount
that is incurred rather than being paid.
Requirement 11
From the annual report analysis of the Australian company of Telstra, it has been
identified that charge for current income tax is made on the basis of the adjusted profits that
are attributable for any disallowed or non-assessable items. Computation of income tax
expense is not done by using the applicable tax rate as provided by the standard accounting
taxation rule that is 30% instead of that in both the years it has been taken as 31.4 per cent in
2017 and in 2016 it was 23.5 per cent. In addition to this, the notes to financial statements
present the numerical reconciliation of the income tax expense to tax payable prima facie
(Gordon, et al., 2017). Such reconciliation provides users with items involved in the
computation of such income tax expense. Therefore, the interesting part in relation to
realization of income tax expenses are the reconciliation of temporary differences and any
amount of net loss after income tax(Scholes, 2015).
8CORPORATE ACCOUNTING
References
Almamy, J., Aston, J., & Ngwa, L. N. (2016). An evaluation of Altman's Z-score using cash
flow ratio to predict corporate failure amid the recent financial crisis: Evidence from
the UK. Journal of Corporate Finance, 36, 278-285.
Brooks, R. (2015). Financial management: core concepts. Pearson.
Chen, L., Feldmann, A., & Tang, O. (2015). The relationship between disclosures of
corporate social performance and financial performance: Evidences from GRI reports
in manufacturing industry. International Journal of Production Economics, 170, 445-
456.
Damodaran, A. (2016). Damodaran on valuation: security analysis for investment and
corporate finance (Vol. 324). John Wiley & Sons.
Delkhosh, M., Malek, Z., Rahimi, M., & Farokhi, Z. (2017). A comparative study of
information content of cash flow, cash value added, accounting earnings, and market
value added to book value of total assets in evaluating the firm
performance. International Journal of Accounting and Economics Studies, 5(2), 112-
117.
Gordon, E. A., Henry, E., Jorgensen, B. N., & Linthicum, C. L. (2017). Flexibility in cash-
flow classification under IFRS: determinants and consequences. Review of
Accounting Studies, 22(2), 839-872.
Grant, R. M. (2016). Contemporary strategy analysis: Text and cases edition. John Wiley &
Sons.
Hackbarth, D., & Sun, D. (2015). Corporate investment and financing dynamics.
⊘ This is a preview!⊘
Do you want full access?
Subscribe today to unlock all pages.
Trusted by 1+ million students worldwide
9CORPORATE ACCOUNTING
Kroes, J. R., & Manikas, A. S. (2014). Cash flow management and manufacturing firm
financial performance: A longitudinal perspective. International Journal of
Production Economics, 148, 37-50.
Najmi, M., Sarraf, F., & Darabi, R. (2015). Relationship between Capital Structure, Free
Cash Flow and Performance in Companies Listed on Tehran Stock
Exchange. European Online Journal of Natural and Social Sciences:
Proceedings, 4(1 (s)), pp-1229.
Reid, W., & Myddelton, D. R. (2017). The meaning of company accounts. Routledge.
Robinson, D. T., & Sensoy, B. A. (2016). Cyclicality, performance measurement, and cash
flow liquidity in private equity. Journal of Financial Economics, 122(3), 521-543.
Scholes, M. S. (2015). Taxes and business strategy. Prentice Hall.
Paraphrase This Document
Need a fresh take? Get an instant paraphrase of this document with our AI Paraphraser
10CORPORATE ACCOUNTING
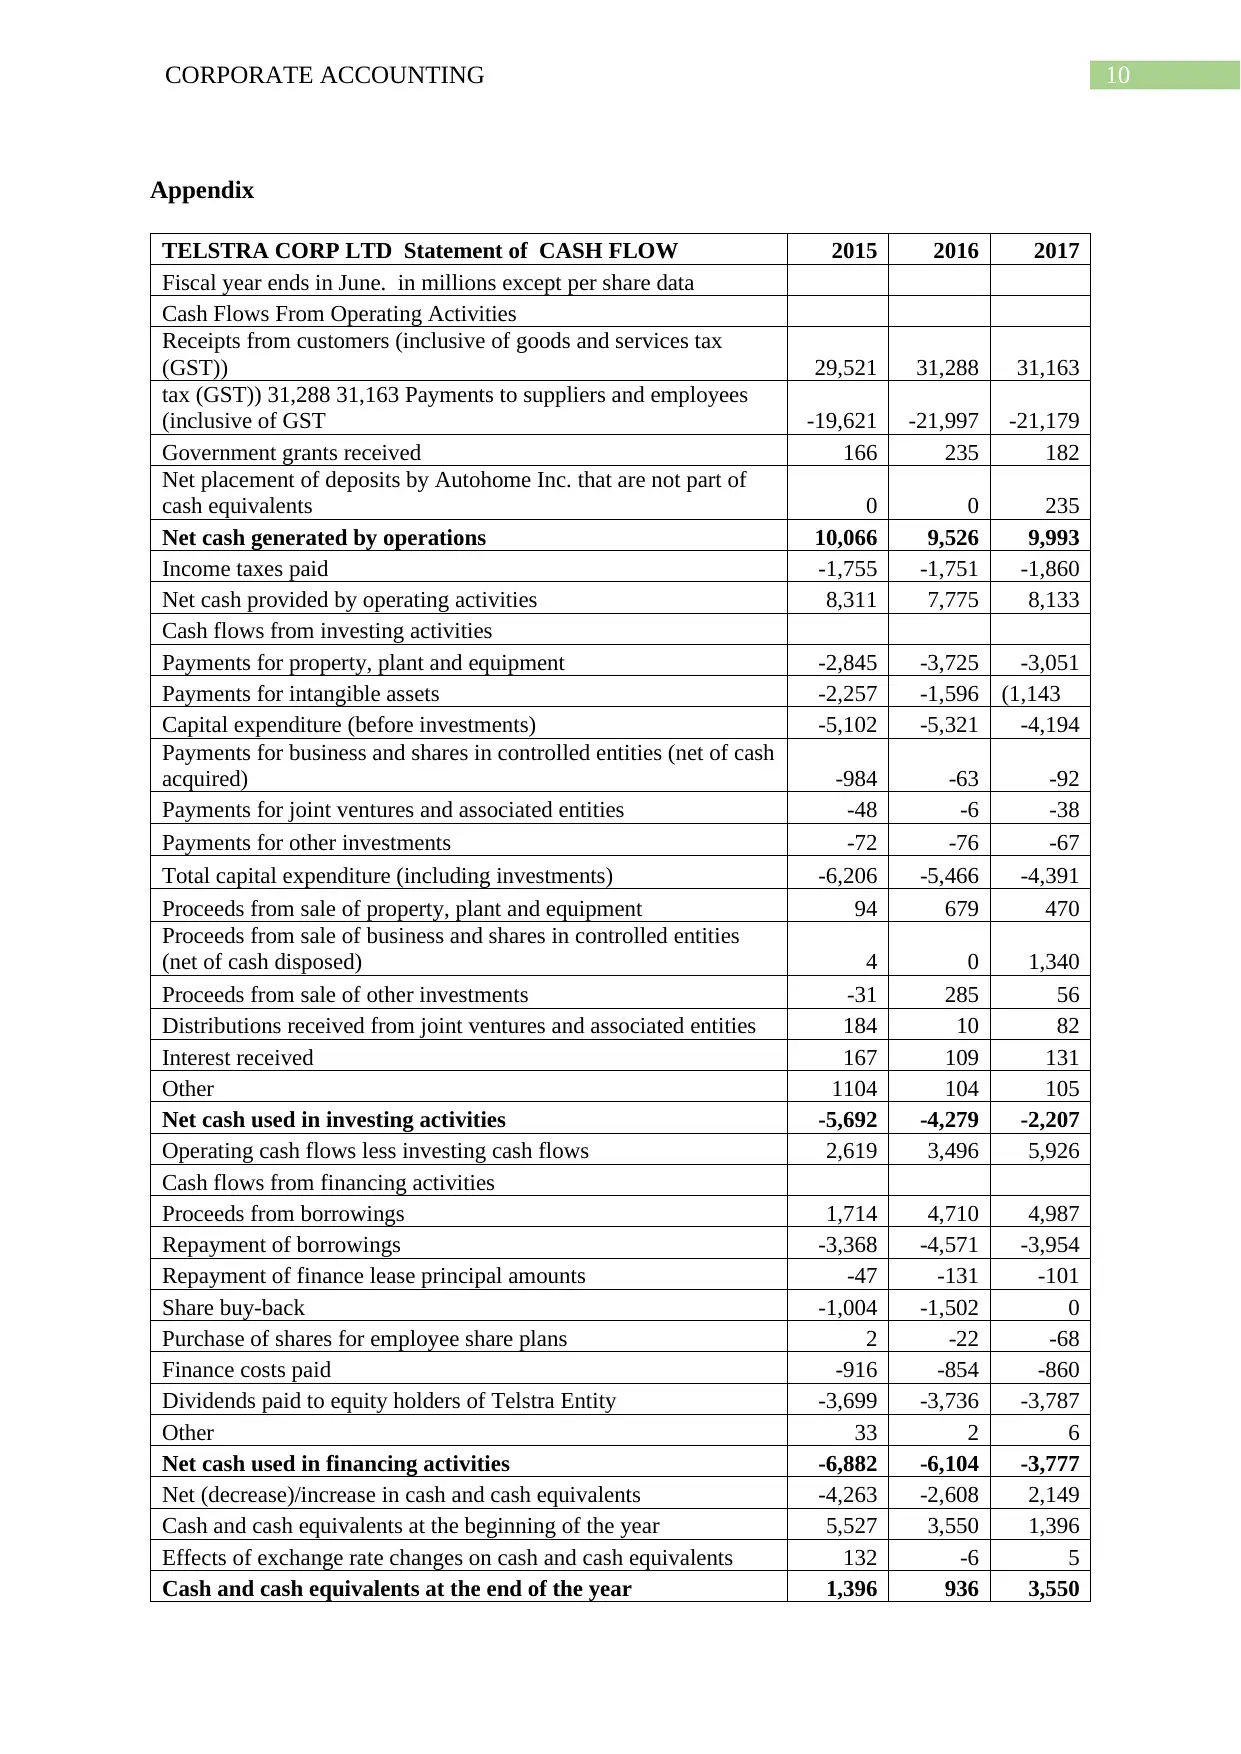
Appendix
TELSTRA CORP LTD Statement of CASH FLOW 2015 2016 2017
Fiscal year ends in June. in millions except per share data
Cash Flows From Operating Activities
Receipts from customers (inclusive of goods and services tax
(GST)) 29,521 31,288 31,163
tax (GST)) 31,288 31,163 Payments to suppliers and employees
(inclusive of GST -19,621 -21,997 -21,179
Government grants received 166 235 182
Net placement of deposits by Autohome Inc. that are not part of
cash equivalents 0 0 235
Net cash generated by operations 10,066 9,526 9,993
Income taxes paid -1,755 -1,751 -1,860
Net cash provided by operating activities 8,311 7,775 8,133
Cash flows from investing activities
Payments for property, plant and equipment -2,845 -3,725 -3,051
Payments for intangible assets -2,257 -1,596 (1,143
Capital expenditure (before investments) -5,102 -5,321 -4,194
Payments for business and shares in controlled entities (net of cash
acquired) -984 -63 -92
Payments for joint ventures and associated entities -48 -6 -38
Payments for other investments -72 -76 -67
Total capital expenditure (including investments) -6,206 -5,466 -4,391
Proceeds from sale of property, plant and equipment 94 679 470
Proceeds from sale of business and shares in controlled entities
(net of cash disposed) 4 0 1,340
Proceeds from sale of other investments -31 285 56
Distributions received from joint ventures and associated entities 184 10 82
Interest received 167 109 131
Other 1104 104 105
Net cash used in investing activities -5,692 -4,279 -2,207
Operating cash flows less investing cash flows 2,619 3,496 5,926
Cash flows from financing activities
Proceeds from borrowings 1,714 4,710 4,987
Repayment of borrowings -3,368 -4,571 -3,954
Repayment of finance lease principal amounts -47 -131 -101
Share buy-back -1,004 -1,502 0
Purchase of shares for employee share plans 2 -22 -68
Finance costs paid -916 -854 -860
Dividends paid to equity holders of Telstra Entity -3,699 -3,736 -3,787
Other 33 2 6
Net cash used in financing activities -6,882 -6,104 -3,777
Net (decrease)/increase in cash and cash equivalents -4,263 -2,608 2,149
Cash and cash equivalents at the beginning of the year 5,527 3,550 1,396
Effects of exchange rate changes on cash and cash equivalents 132 -6 5
Cash and cash equivalents at the end of the year 1,396 936 3,550

11CORPORATE ACCOUNTING
⊘ This is a preview!⊘
Do you want full access?
Subscribe today to unlock all pages.
Trusted by 1+ million students worldwide
1 out of 12
Related Documents


Your All-in-One AI-Powered Toolkit for Academic Success.
+13062052269
info@desklib.com
Available 24*7 on WhatsApp / Email
![[object Object]](/_next/static/media/star-bottom.7253800d.svg)
Unlock your academic potential
Copyright © 2020–2026 A2Z Services. All Rights Reserved. Developed and managed by ZUCOL.