Comprehensive Financial Analysis Report: Telstra Corporation

Verified

Added on  2023/01/20

|8
|1956
|92
Report
AI Summary
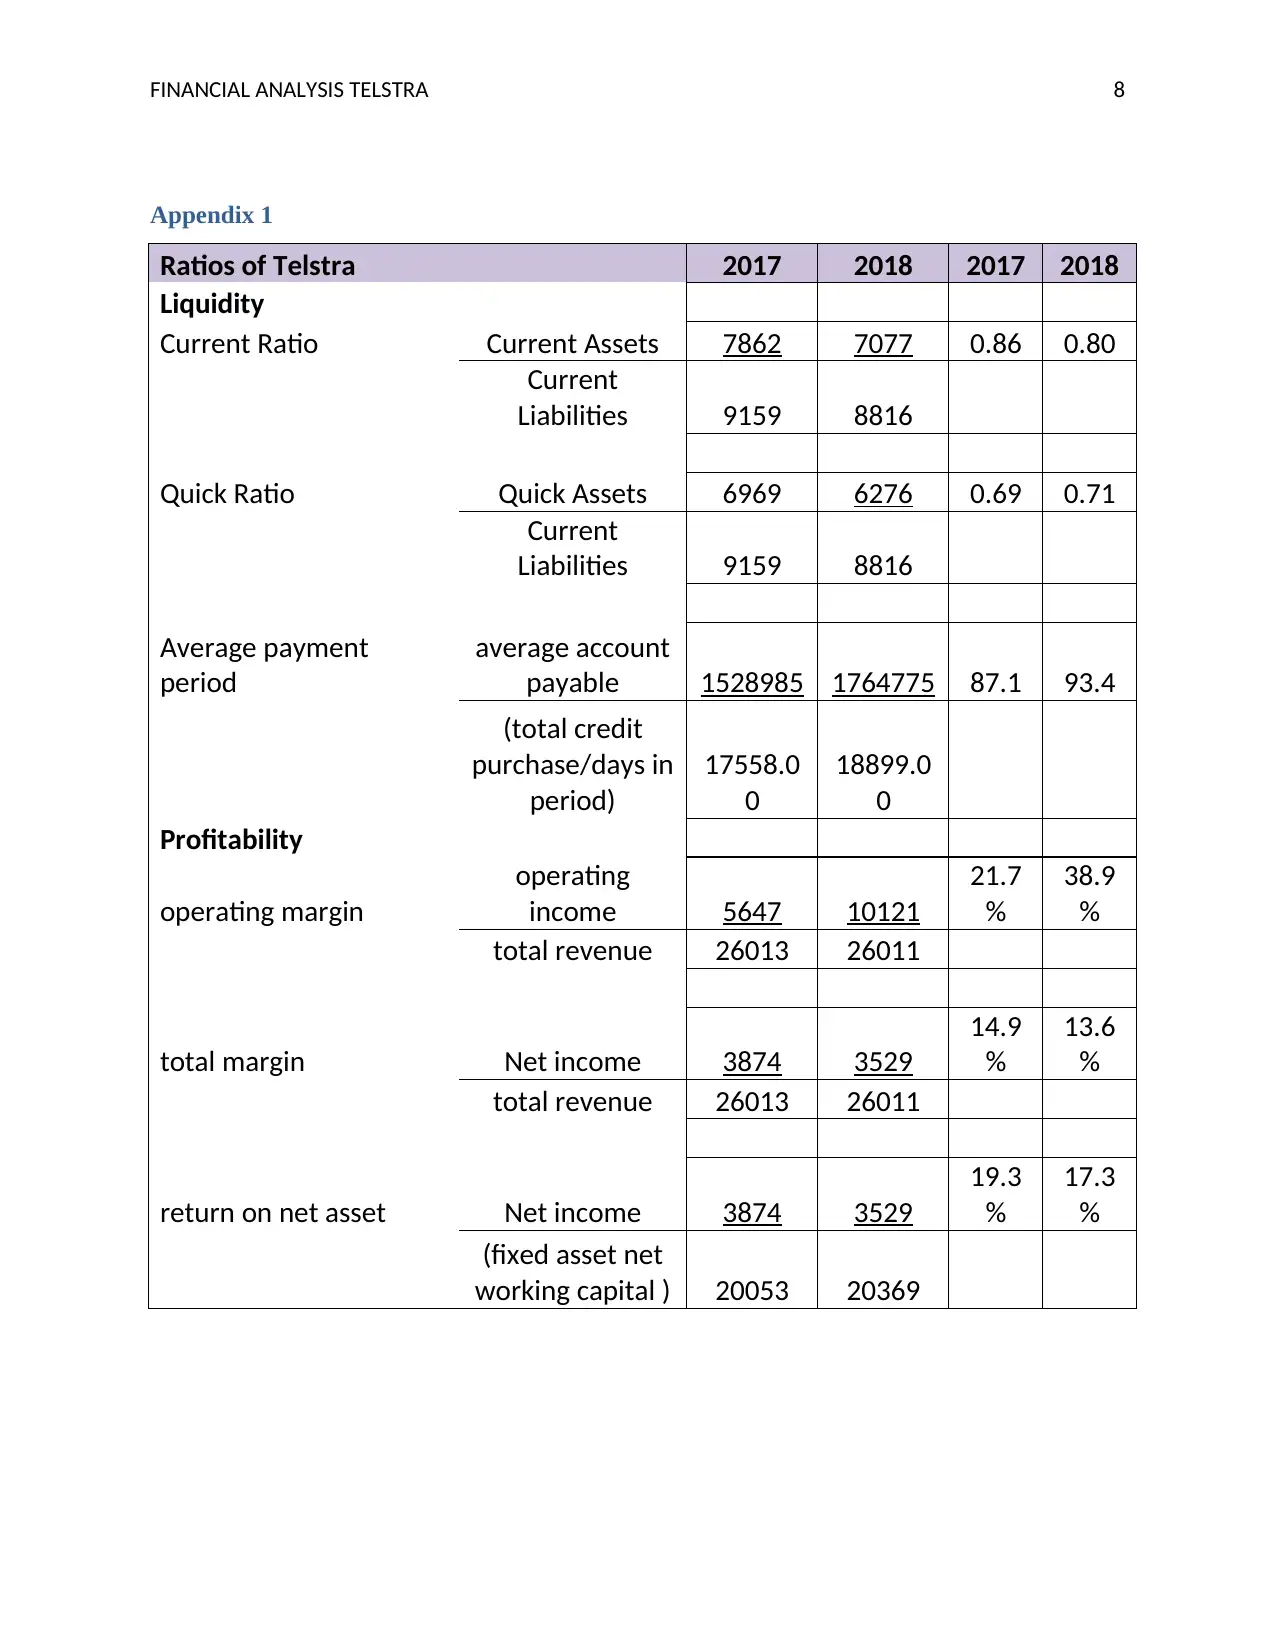
This report provides a comprehensive financial analysis of Telstra Corporation, evaluating its market position using Porter's Five Forces, including the bargaining power of suppliers and buyers, the threat of new substitutes, barriers to entry, and rivalry among existing players. The analysis investigates the number of analysts following the stock and summarizes their recommendations, comparing them to the company's current industry position. The report examines Telstra's financial performance, including profitability and liquidity ratios, and discusses similarities and differences between analyst recommendations and the company's actual performance. It highlights key aspects such as market capitalization, institutional ownership, dividend yield, and payout ratio, providing a detailed overview of Telstra's financial health and strategic considerations. The analysis also explores the impact of factors like competition in the mobile industry and the NBN Co.'s wholesale broadband network on the company's profit margins.
Document Page
Running head: FINANCIAL ANALYSIS TELSTRA 1
FINANCIAL ANALYSIS TELSTRA
tabler-icon-diamond-filled.svg

Paraphrase This Document

Need a fresh take? Get an instant paraphrase of this document with our AI Paraphraser
Document Page
FINANCIAL ANALYSIS TELSTRA 2
Contents
Introduction.................................................................................................................................................3
Porter’s five forces..................................................................................................................................3
Bargaining power of Suppliers............................................................................................................3
Bargaining Power of Buyers................................................................................................................3
Threat of new substitutes.....................................................................................................................4
Barriers to Entry..................................................................................................................................4
Rivalry among the existing players......................................................................................................4
Investigate the number of analysts following the stock and summarize their recommendations.............5
Comment on any similarities and differences between recommendations by analysts and the current
position of the company in the industry...................................................................................................6
References...................................................................................................................................................7
Appendix 1..................................................................................................................................................8
Document Page
FINANCIAL ANALYSIS TELSTRA 3
Introduction
Telstra is one of the largest communication based company set up in Australia, intended
to provide the services covering various areas of communication such as mobile phones, internet,
accessories and advertising agents. Telstra offers a great deal off the services to its customers.
The major revenue of Telstra is from rendering the services to the customers in the form
of the net services. Apart from this due to the higher competition the company is losing on the
fixed line services, therefore the company can invest its most of the funds in leasing the mobile
handsets and other internet services (Investing Co, 2018).
Geographically the Telstra is operating in almost all Australia and it is having the
longstanding international business focus on Asia Pacific Region. Overall the company is
performing better and the revenue of the company is $21608 the total income earned is $29124
(Simply Wall Street, 2019).
Porter’s five forces
It is an analytical tool that is used to determine the five factors that can affect the position
of the market in the industry of the telecommunication.
Bargaining power of Suppliers
The bargaining power of the supplier is moderate and Telstra has entered into different
countries via setting up of the various subsidiaries. China is one of the beneficiaries of the
subsidiary which is established by the Telstra Corporation. This reflects the company is
expanding and is able to manage the businesses overseas. Products supplied from the suppliers
are of high quality and thereafter there is a strong development of the trust among the clients.
Call centers are considered as the good sign of the contact with the customers and hence it can be
stated that the bargaining power of the suppliers is of moderate nature (Namusonge, Mukulu &
Mokaya, 2017).
Bargaining Power of Buyers
The bargaining powers of the buyers are high as they have enough option to shift towards
the new outputs available in the market. There are several factors that affect the position of the
buyers are the gross trading, the uniqueness of the product and the various types of the
Document Page
FINANCIAL ANALYSIS TELSTRA 4
distribution channels. Therefore the customers of the Telstra have the ability to move the price
and switch to the different service provider. Hence Telstra is advised to build the large customer
base with differentiated products so that the customers lead can get the best quality services
(Grant, 2015).
Threat of new substitutes
Development and competition have turned the tables for the profits of the industry. There
may be any existing product and there are few substitutes available for the products that are
produced in the industry in which they incorporate. Since the switching costs are low there is a
possibility that the customers may switch to the new product insisted of Telstra. Though there are
very few substitutes available yet the firms operating within the same industry sells at the lower
cost per unit. There is no ceiling of profit in the industry in which the Telstra operates and hence
there is a moderate level of threat from the availability of the substitutes (Kyengo, Ombui &
Iravo, 2016).
Barriers to Entry
The potential of the new entrants in the market is comparatively low and any profitable
markets will generally lead to high yields to attract the new players in the market. The major
reasons for the low entry is due to the huge capital requirements are required and at same time
the patent rights are also required. The customer loyalty, the accessibility and the different
economies of scale also plays an important role in determining the factors that result in the
barriers to entry. Telstra therefore have the low fear of the new entrants and to secure its position
the company can develop the brand loyalty with the customers, and also have the cordial
relationships with the contractual relationships that can widen the access of the target market
(Adi, 2015).
Rivalry among the existing players
The rivalry among the existing firm will be low in case of the Telstra if there is the
limited number of the players in the market, the industry is probably exceeding at the faster pace
and there is a clear scope of becoming the market leader. The only case the rivalry can be strong
when there is intense competition over the trust factor of the customers and the customers will
switch if they found the lower costs in the market. This factor may create a strategic concern for
Telstra in terms of the rivalry amongst the existing player (Gould & Desjardins, 2015).
tabler-icon-diamond-filled.svg

Paraphrase This Document

Need a fresh take? Get an instant paraphrase of this document with our AI Paraphraser
Document Page
FINANCIAL ANALYSIS TELSTRA 5
Investigate the number of analysts following the stock and summarize their
recommendations.
Telstra has the market capitalization of AU$34 billion and it seems too big to fly under
the radar. Telstra have thee institutional investors and they hold 11% of stock. This can surely
indicate that there is a certain degree of credibility in the investment community. A roundabout
88% of the ownership of the Telstra is owned by general public, mostly retail investors. This
kind of ownership gives the investors a power or says freedom to sway the maximum policy
based decisions which are inclusive of the Board Compensation, dividend payout ratio and lot
more .
Telstra has been paying dividends to its shareholders and at present the yield of the company is
4%. The current payout ratio of the company is 48% which reflects that the dividends are
cumulatively paid form the earnings itself. The analysts have the prediction that the dividend
yield will be increased by 5.2% and the overall payout ratio will be 92%. The recommendations
provided by the analysts in case of the profitability and the liquidity positions of the company are
somewhat similar. When the annual report was observed it can be found that the company’s
interim results showcases a squeeze in the figure of the profit margin due to the growing
footprint of the NBN Co.’s wholesale broadband network and due to the increased competition
in the mobile industry. The profit margins went in the backward direction in case of the mobiles,
fixed line and in the network application services (Investing Co, 2018).
The profitability of the business can be analyzed with the help of the ratio analysis technique that
will determine how much profitable the company is and what kind of returns the investors are
going to get in the future. The return on assets was 19.3% whereas the same decreased to 17.3%
due to the decrease in the net income. The total net margin also saw a fall from 14.9% to 13.6%
whereas the major improvement was seen in the operating margin section which increased from
21.7% to 38.9%. The major reason for the increase in the gross margin was due to the deduction
in the operating costs of the company (Simply Wall Street, 2019).
The liquidity position on the other hand is somewhat similar to the previous year. The current
ratio in the year 2017 was 0.86 whereas in the year 2018 Telstra saw a fall at a minimal range of
0.80. The quick ratio however has improved due to the improvement of the cash cycle and the
cash is rotating at the faster pace. Lastly the average payment period have been increased from
Document Page
FINANCIAL ANALYSIS TELSTRA 6
87.1 to 93.4 days which reflects the capacity of the company is falling at the slower pace, but
falling to pay back to the creditors on time and hence the Telstra shall focus on improving it
(Telstra Corporation, 2018).
Comment on any similarities and differences between recommendations by analysts and
the current position of the company in the industry.
Similarities
The profits have squeezed up, the operating costs are increasing and the company shall get rid of
the obsolete technology. This would definitely lower down the margins and there is high level of
chances in the drop of the share price of the company as well.
Difference
The only difference that the investors can note of is that due to the high brand value and the
increased trust factor the company will regain is performance and the dividends will be assured
to the investors on time.
Document Page
FINANCIAL ANALYSIS TELSTRA 7
References
Adi, B. (2015). An evaluation of the Nigerian telecommunication industry competitiveness:
application of porter’s five forces model. World, 5(3), 15-36.
Gould, A. M., & Desjardins, G. (2015). A spring-clean of Michael Porter’s Attic: The Canadian
telecommunications sector as an exemplar of refurbished generic
strategy. Competitiveness Review, 25(3), 310-323.
Grant, R. M. (2015). Five Forces of Competition. Wiley Encyclopedia of Management, 1-4.
Investing Co, (2018). Telstra Corporation Ltd. (TLS). Retrieved from
https://www.investing.com/equities/telstra-corporation-limited.-ratios
Kyengo, J. W., Ombui, K., & Iravo, M. A. (2016). Influence of competitive strategies on the
performance of telecommunication companies in Kenya. International Academic Journal
of Human Resource and Business Administration, 2(1), 1-16.
Namusonge, A., Mukulu, E., & Mokaya, S. (2017). Relationship Between Strategic Product
Development Practices and Financial Performance of Telecommunication Firms in
Kenya. International Journal of Academic Research in Business and Social
Sciences, 7(11), 309-326.
Simply Wall Street, (2019). How Many Telstra Corporation Limited (ASX:TLS) Shares Have
Insiders Sold, In The Last Year?. Retrieved from
https://simplywall.st/stocks/au/telecom/asx-tls/telstra-shares/news/how-many-telstra-
corporation-limited-asxtls-shares-have-insiders-sold-in-the-last-year/
Telstra Corporation, (2018). Annual Report. Retrieved from
https://www.telstra.com.au/content/dam/tcom/about-us/investors/pdf%20F/2018-Annual-
Report.pdf
tabler-icon-diamond-filled.svg

Paraphrase This Document

Need a fresh take? Get an instant paraphrase of this document with our AI Paraphraser
Document Page
FINANCIAL ANALYSIS TELSTRA 8
Appendix 1
Ratios of Telstra 2017 2018 2017 2018
Liquidity
Current Ratio Current Assets 7862 7077 0.86 0.80
Current
Liabilities 9159 8816
Quick Ratio Quick Assets 6969 6276 0.69 0.71
Current
Liabilities 9159 8816
Average payment
period
average account
payable 1528985 1764775 87.1 93.4
(total credit
purchase/days in
period)
17558.0
0
18899.0
0
Profitability
operating margin
operating
income 5647 10121
21.7
%
38.9
%
total revenue 26013 26011
total margin Net income 3874 3529
14.9
%
13.6
%
total revenue 26013 26011
return on net asset Net income 3874 3529
19.3
%
17.3
%
(fixed asset net
working capital ) 20053 20369
chevron_up_icon
1 out of 8
circle_padding
hide_on_mobile
zoom_out_icon
[object Object]