Accounting and Financial Analysis of Telstra Corporation Limited
VerifiedAdded on 2020/05/28
|14
|2804
|54
Report
AI Summary
This report presents a detailed financial analysis of Telstra Corporation Ltd. covering the period from 2014 to 2016. The analysis includes a thorough examination of the company's income statements, statements of financial position, and cash flow statements to assess its financial performance. Furthermore, the report delves into a comprehensive ratio analysis, evaluating profitability (gross profit margin, net profit margin, operating profit margin, return on equity, and return on assets), efficiency (accounts receivable turnover, asset turnover, and working capital ratio), liquidity (current ratio, quick ratio, and cash ratio), and capital structure ratios (debt ratio, equity ratio, and debt-to-equity ratio). The analysis reveals trends in revenue, profit before and after tax, and key financial metrics, offering insights into Telstra's operational effectiveness, financial stability, and overall market position. The report concludes with an assessment of the company's financial health and future prospects, drawing on the findings from the financial statement and ratio analyses.
Running head: ACCOUNTING AND FINANCE FOR MANAGERS
Accounting and Finance for Managers
Name of the Student
Name of the University
Authors Note
Course ID
Accounting and Finance for Managers
Name of the Student
Name of the University
Authors Note
Course ID
Paraphrase This Document
Need a fresh take? Get an instant paraphrase of this document with our AI Paraphraser
1ACCOUNTING AND FINANCE FOR MANAGERS
Table of Contents
Executive Summary:..................................................................................................................2
Introduction:...............................................................................................................................3
Income statement analysis:........................................................................................................3
Statement of financial position:.................................................................................................4
Cash Flow Statement:................................................................................................................5
Financial Ratio Analysis............................................................................................................5
Profitability Ratios:....................................................................................................................5
Efficiency ratio:..........................................................................................................................7
Liquidity Ratios:.........................................................................................................................8
Capital structure ratios:..............................................................................................................9
Conclusion:..............................................................................................................................10
Reference List:.........................................................................................................................11
Appendix:.................................................................................................................................13
2ACCOUNTING AND FINANCE FOR MANAGERS
Executive Summary:
The contemporary report is dealing with the valuation of the fiscal position of Telstra
Corporation Ltd. The report will reflect the business performance of Telstra Corporation Ltd
for the span of three years ranging from 2014-16. The report will contemplate the income
statement, statement of fiscal position and cash flow statement to attain an in depth
understanding of the financial position of Telstra Corporation Ltd. Moreover, the ratio
analysis will be conducted to further understanding the financial position of Telstra
Corporation Ltd in the terms of the profitability, efficiency, liquidity and capital structure
ratios.
⊘ This is a preview!⊘
Do you want full access?
Subscribe today to unlock all pages.
Trusted by 1+ million students worldwide
3ACCOUNTING AND FINANCE FOR MANAGERS
Introduction:
The present study is concerned with the assessment of the financial position of Telstra
Corporation Ltd. The report will consider the financial performance of Telstra Corporation
Ltd for over the period of three years ranging from 2014-16. The report will consider the
income statement, statement of financial positon and cash flow statement to gain an in depth
understanding of the financial position of Telstra Corporation Ltd. Additionally, the ratio
analysis will be performed to further understanding the financial positon of Telstra
Corporation Ltd in the terms of the profitability, efficiency, liquidity and capital structure
ratios.
Income statement analysis:
As evident from the financial income statement of Telstra Corporation Ltd during the
year ended 2014 the company reported the net revenue of $24,320 million revenue however,
in the year 2015 the company reported a rise in the revenue as the net revenue reported by the
company stood 26,023 (Telstra.com.au, 2015). Taking into the considerations the profit
before income tax, Telstra Corporation Ltd reported some earnings before tax of $6,228 for
the year ended 2014 whereas in the subsequent year of 2015 the company reported some
earnings before tax of $6,073.
The net profit after tax stood $4.3 billion for the year ended 2015 and the rise in the
revenue is mainly attributed to the increase in the total Foxtel subscriber by 18.4%.
Additionally, the profit before tax for the year ended 2016 stood $6,310. Taking into the
considerations net income derived by the Telstra Corporation Ltd in the subsequent year of
2016 it was noticed that in the year 2016 the net income of the company stood $25,911
million (Telstra.com.au, 2015). The net profit after tax reported by the company stood $5.8
Paraphrase This Document
Need a fresh take? Get an instant paraphrase of this document with our AI Paraphraser
4ACCOUNTING AND FINANCE FOR MANAGERS
billion and the rise in the net profit is largely attributable to the sale of auto home shares with
the company reporting the net profit after tax of $1.8 billion (Wahlen etv al., 2014).
During the year 2016, the retail income of Telstra Corporation fell by 1.5% to $16,656
million whereas the EBITDA further fell by 3.9% to $9,220 million. The fall in the EBITDA
was primarily attributed to the falling margin of fixed voice and the effect of migration to the
NBN network.
Statement of financial position:
The statement of financial position represents that the gross debt position for the year
ended 2016 stood $16,009 that consisted of the borrowings of $17,302 million and net
amount of derivative assets for Telstra Corporation standing $1,293 (Telstra.com.au, 2015).
The rise in the derivative assets of $1,047 in comparison to the reported figures of June 2015
reflects debt maturities of $1,581, which was offset by a sum of $2,628 million of increasing
debt.
The non-current assets during the year 2014-15 increased by 15.7 percent to $33,475
million with intangible assets increasing by $2,950 mainly because of the acquisition of the
spectrum. The company reported further increase in goodwill that was resulted from the
acquisition of the controlled entities and organizations (Telstra.com.au, 2015). The non-
current liabilities increased by 6.5% in 2014-15 to $17,806 million.
During the year 2015-16, the balance sheet of Telstra Corporation demonstrated a
strong position with net assets standing $15,907 million. The current assets rose by 34% to
9,340 million and this was largely due to the increase in the cash of $2,154 million. The
current liabilities on the other hand rose by 13.0% to $9,188 million whereas the non-current
liabilities have increased by 2.2% to $18,191 million.
5ACCOUNTING AND FINANCE FOR MANAGERS
Cash Flow Statement:
The net cash provided by the operating activities for the year ended 2014 stood $8613
million whereas in the year the figure stood 8,311 with a fall of 3.5% (Telstra.com.au, 2015).
The net amount of finance cost of Telstra Corporation declined by 28% to $689 million and
this was largely due to the reduction in the net borrowing of $87 million and $175 million
reduction in the other finance cost. By considering the cash flow statement for the year ended
2014 and 2015 the lower of borrowing cost was primarily because of the lower average debt
resulting from the debt maturities that were funded out by Telstra Corporation based on the
existing liquidity (Bourguignon et al., 2015).
During the year 2014-15, the free cash flow generated by the firm from the operating
and investment activities stood $2,619 million reflecting a fall of 65.0 percent. The difference
was primarily because of the payment of spectrum and M&A activities along with the
acquisition of Pacnet Ltd. In comparison to the financial year, 2015 the capital expenditure
reported in the cash flow statement represented a rise of $3,589 and a large part of this
expenditure is incurred on the extended 4G and 4GX services. The reported amount of free
cash flow for 2016 stood $5926 million with an increase of $3,307 million. The increase in
free cash flow is because of the sale of Auto home along with the mergers and acquisition (Ic
et al., 2015).
Financial Ratio Analysis
Profitability Ratios:
Profitability ratio represents the class of financial metrics, which is used to determine
the ability of the business in deriving revenues in respect of its expenditure (Deegan, 2013).
The gross profit margin reported by Telstra has been on a declining trend with gross margin
standing 74.14% in 2014 and 73.42% in 2015. The gross margin further fell to 71.95% in the
⊘ This is a preview!⊘
Do you want full access?
Subscribe today to unlock all pages.
Trusted by 1+ million students worldwide
6ACCOUNTING AND FINANCE FOR MANAGERS
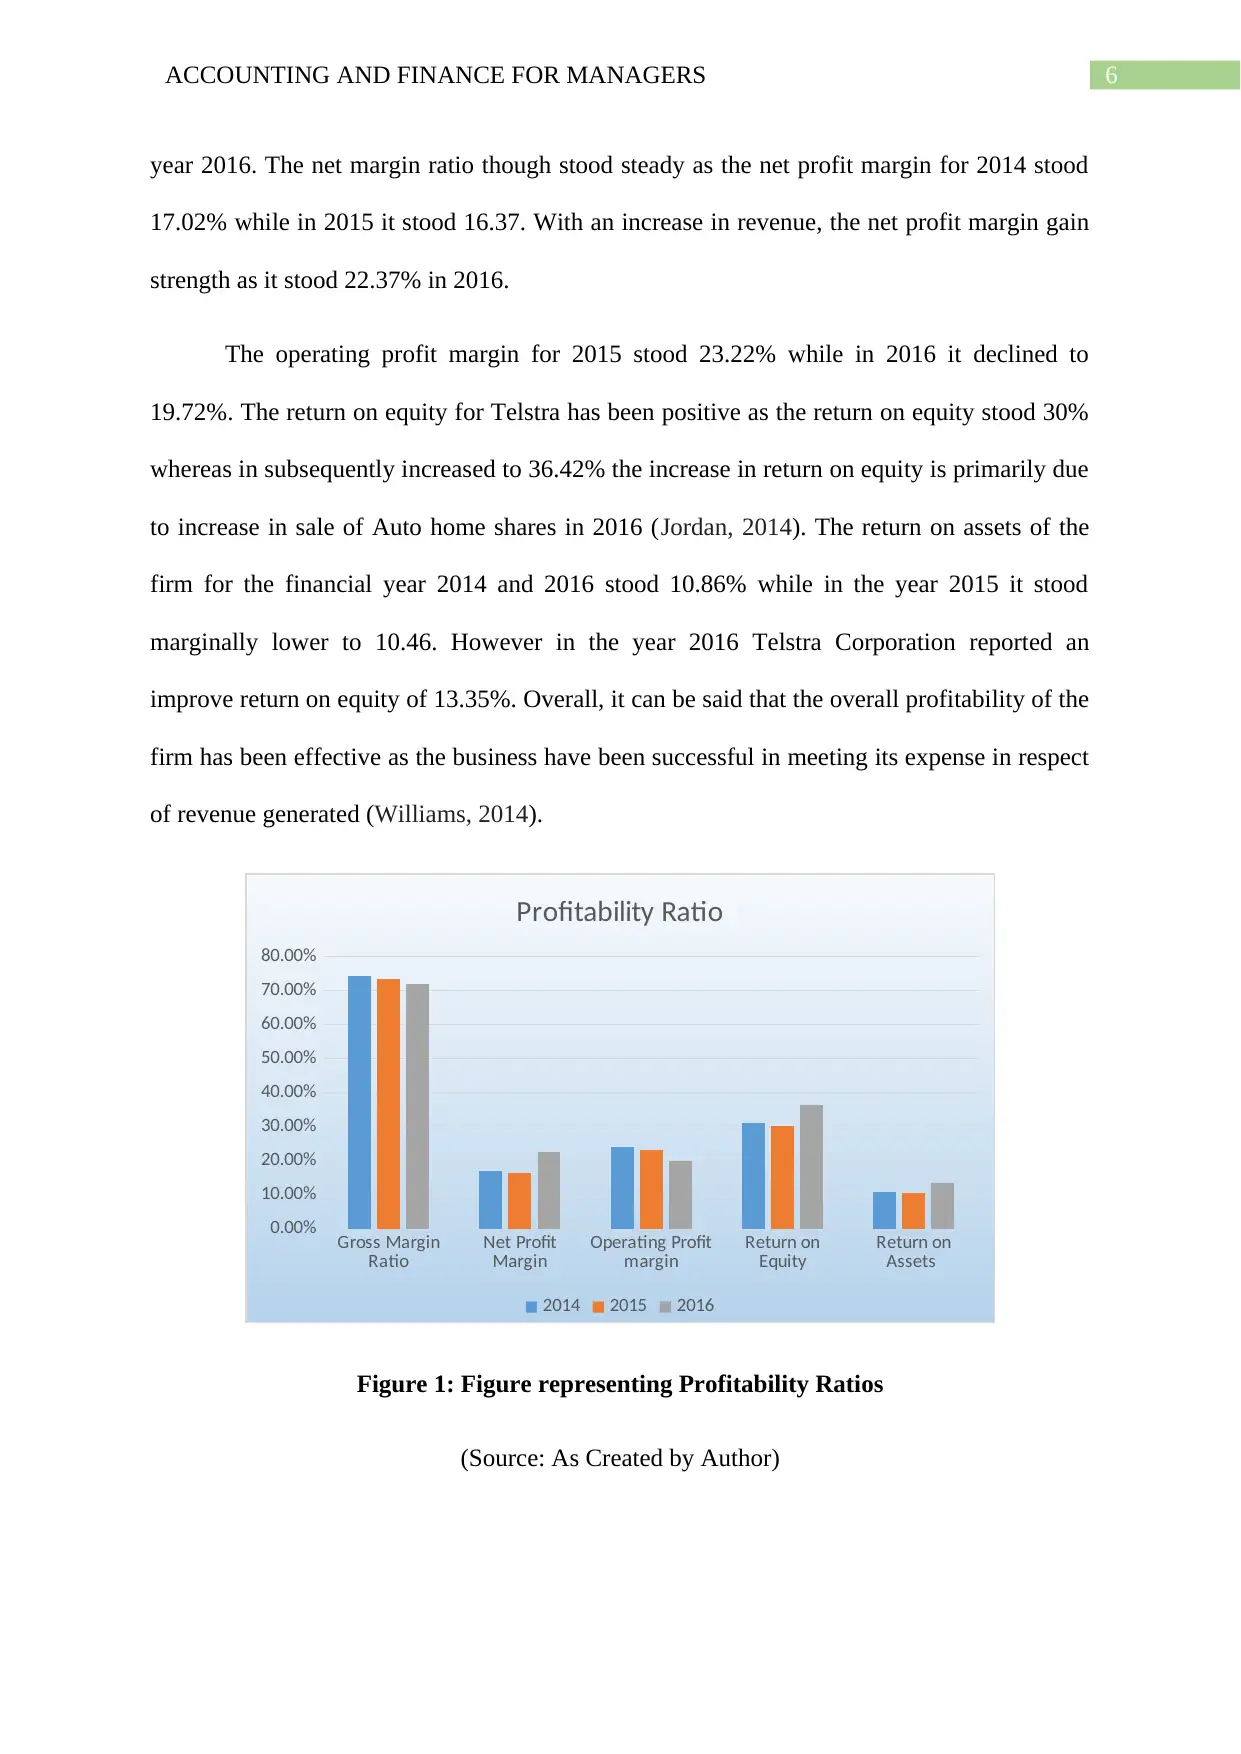
year 2016. The net margin ratio though stood steady as the net profit margin for 2014 stood
17.02% while in 2015 it stood 16.37. With an increase in revenue, the net profit margin gain
strength as it stood 22.37% in 2016.
The operating profit margin for 2015 stood 23.22% while in 2016 it declined to
19.72%. The return on equity for Telstra has been positive as the return on equity stood 30%
whereas in subsequently increased to 36.42% the increase in return on equity is primarily due
to increase in sale of Auto home shares in 2016 (Jordan, 2014). The return on assets of the
firm for the financial year 2014 and 2016 stood 10.86% while in the year 2015 it stood
marginally lower to 10.46. However in the year 2016 Telstra Corporation reported an
improve return on equity of 13.35%. Overall, it can be said that the overall profitability of the
firm has been effective as the business have been successful in meeting its expense in respect
of revenue generated (Williams, 2014).
Gross Margin
Ratio Net Profit
Margin Operating Profit
margin Return on
Equity Return on
Assets
0.00%
10.00%
20.00%
30.00%
40.00%
50.00%
60.00%
70.00%
80.00%
Profitability Ratio
2014 2015 2016
Figure 1: Figure representing Profitability Ratios
(Source: As Created by Author)
Paraphrase This Document
Need a fresh take? Get an instant paraphrase of this document with our AI Paraphraser
7ACCOUNTING AND FINANCE FOR MANAGERS
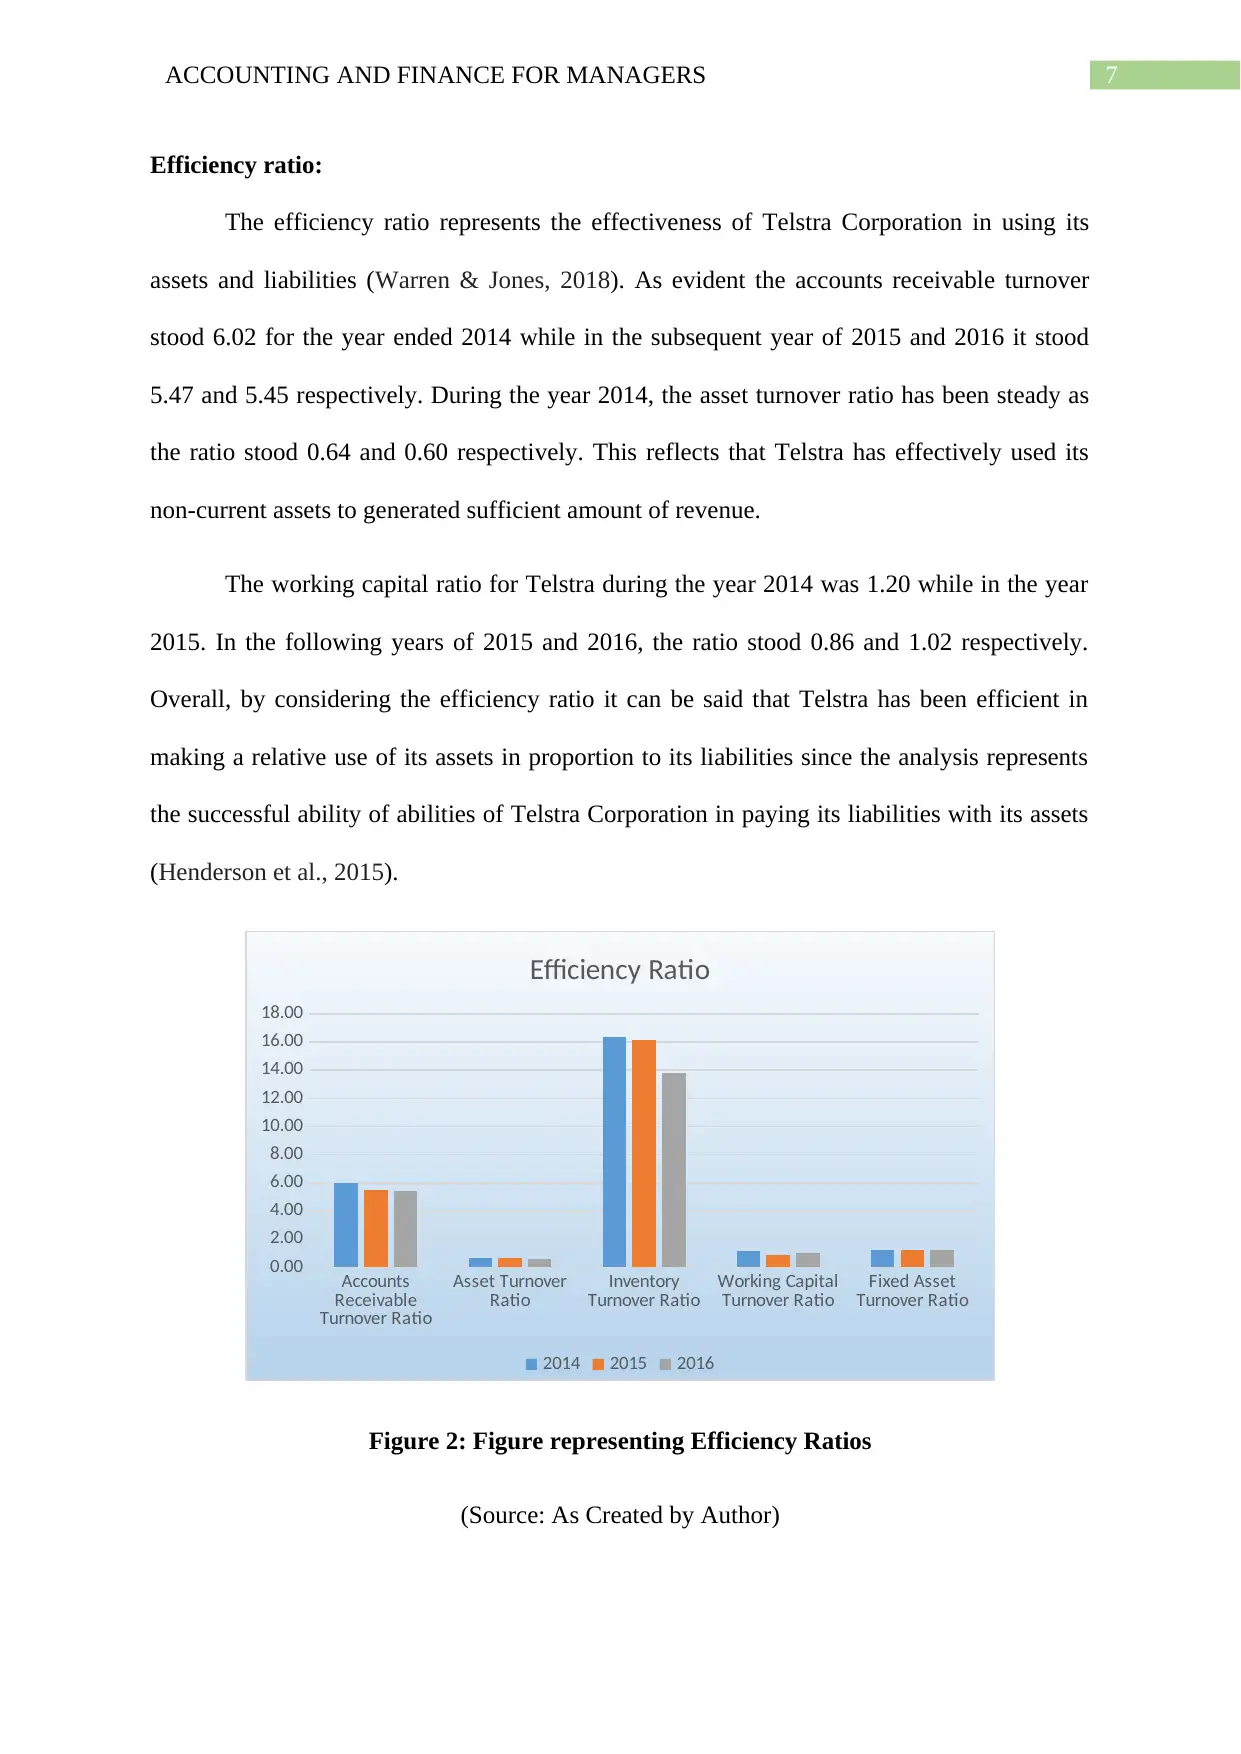
Efficiency ratio:
The efficiency ratio represents the effectiveness of Telstra Corporation in using its
assets and liabilities (Warren & Jones, 2018). As evident the accounts receivable turnover
stood 6.02 for the year ended 2014 while in the subsequent year of 2015 and 2016 it stood
5.47 and 5.45 respectively. During the year 2014, the asset turnover ratio has been steady as
the ratio stood 0.64 and 0.60 respectively. This reflects that Telstra has effectively used its
non-current assets to generated sufficient amount of revenue.
The working capital ratio for Telstra during the year 2014 was 1.20 while in the year
2015. In the following years of 2015 and 2016, the ratio stood 0.86 and 1.02 respectively.
Overall, by considering the efficiency ratio it can be said that Telstra has been efficient in
making a relative use of its assets in proportion to its liabilities since the analysis represents
the successful ability of abilities of Telstra Corporation in paying its liabilities with its assets
(Henderson et al., 2015).
Accounts
Receivable
Turnover Ratio
Asset Turnover
Ratio Inventory
Turnover Ratio Working Capital
Turnover Ratio Fixed Asset
Turnover Ratio
0.00
2.00
4.00
6.00
8.00
10.00
12.00
14.00
16.00
18.00
Efficiency Ratio
2014 2015 2016
Figure 2: Figure representing Efficiency Ratios
(Source: As Created by Author)
8ACCOUNTING AND FINANCE FOR MANAGERS
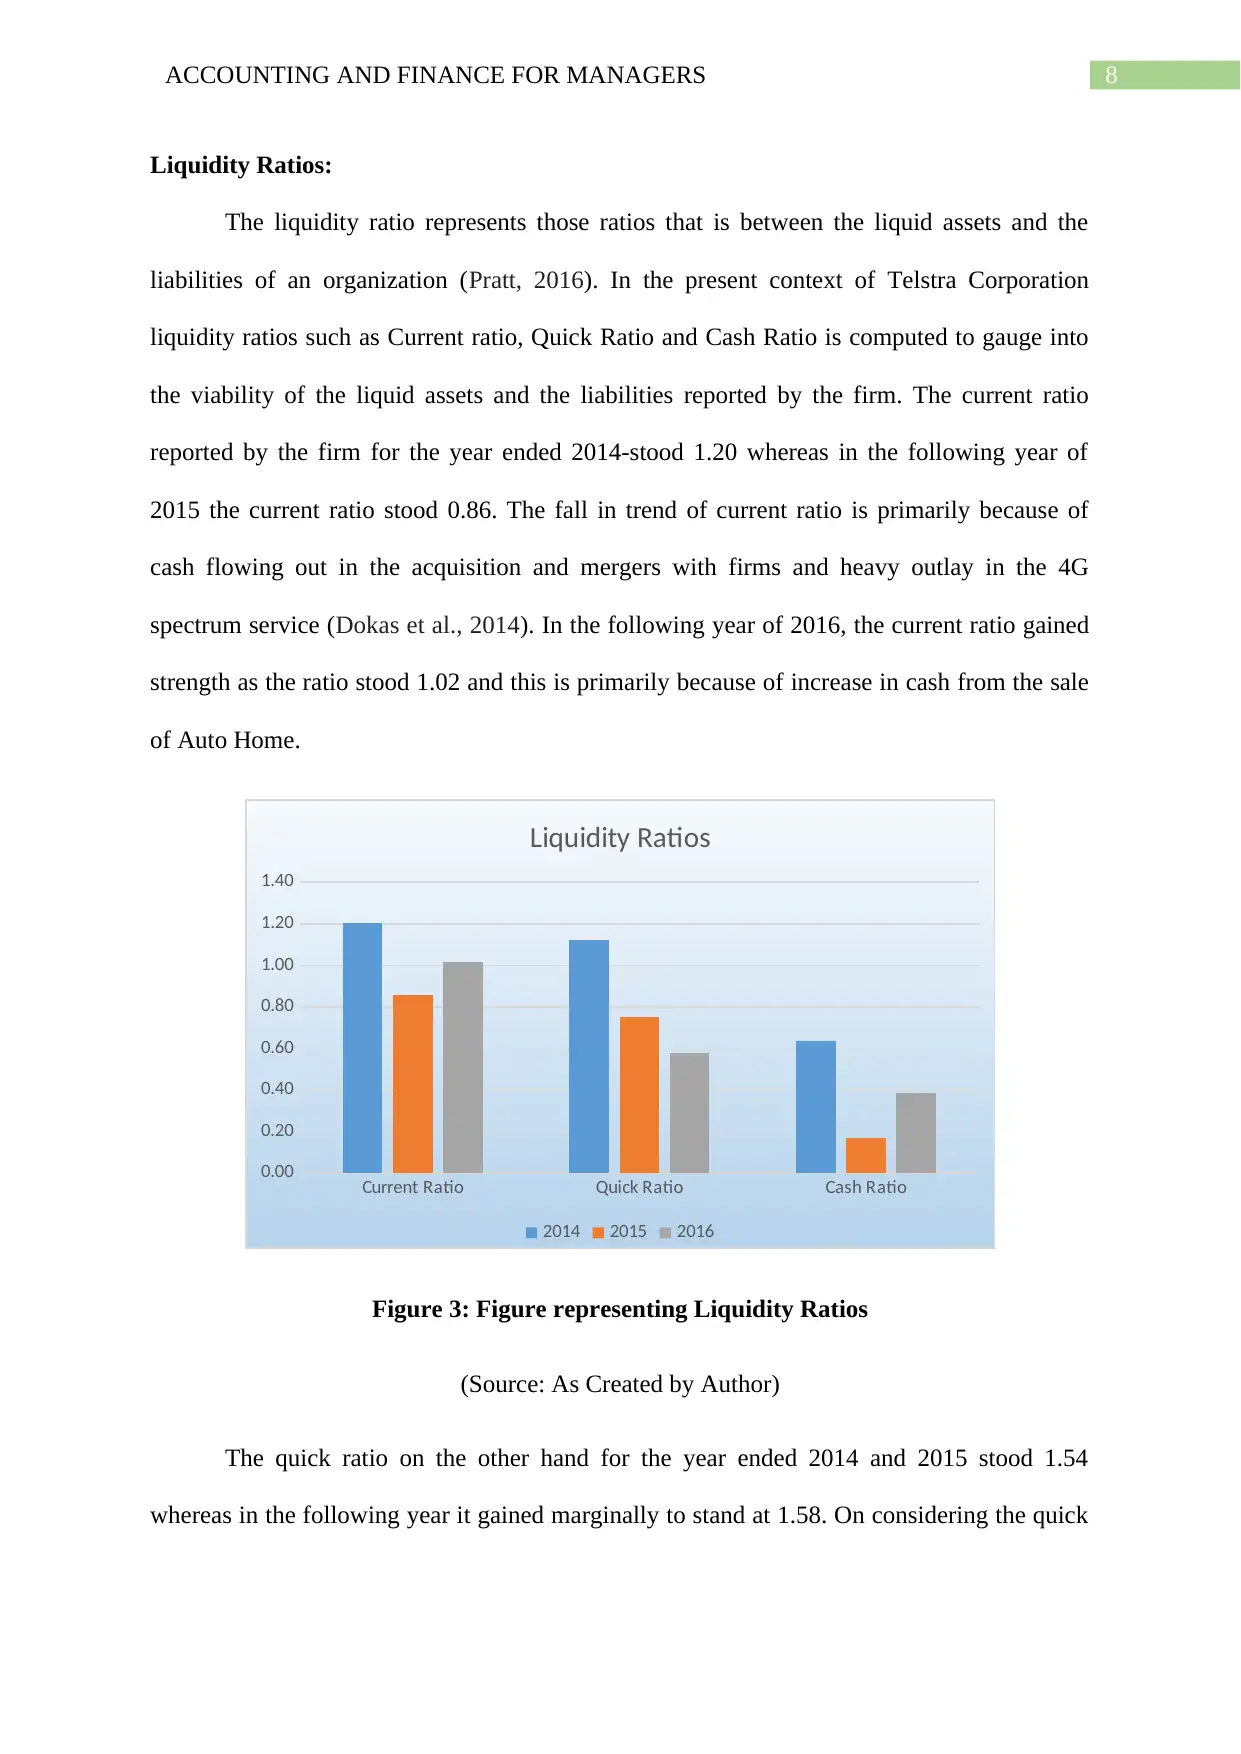
Liquidity Ratios:
The liquidity ratio represents those ratios that is between the liquid assets and the
liabilities of an organization (Pratt, 2016). In the present context of Telstra Corporation
liquidity ratios such as Current ratio, Quick Ratio and Cash Ratio is computed to gauge into
the viability of the liquid assets and the liabilities reported by the firm. The current ratio
reported by the firm for the year ended 2014-stood 1.20 whereas in the following year of
2015 the current ratio stood 0.86. The fall in trend of current ratio is primarily because of
cash flowing out in the acquisition and mergers with firms and heavy outlay in the 4G
spectrum service (Dokas et al., 2014). In the following year of 2016, the current ratio gained
strength as the ratio stood 1.02 and this is primarily because of increase in cash from the sale
of Auto Home.
Current Ratio Quick Ratio Cash Ratio
0.00
0.20
0.40
0.60
0.80
1.00
1.20
1.40
Liquidity Ratios
2014 2015 2016
Figure 3: Figure representing Liquidity Ratios
(Source: As Created by Author)
The quick ratio on the other hand for the year ended 2014 and 2015 stood 1.54
whereas in the following year it gained marginally to stand at 1.58. On considering the quick
⊘ This is a preview!⊘
Do you want full access?
Subscribe today to unlock all pages.
Trusted by 1+ million students worldwide
9ACCOUNTING AND FINANCE FOR MANAGERS
ratio, it can be staid that Telstra Corporation has been efficient in meeting the short-term
financial liabilities (Marshall, 2016).
The cash ratio represents the total cash and cash equivalents to its current liabilities.
As evident in the year 2014 the cash ratio stood 0.64 while in the year 2015 it fell to 0.17.
The fall in cash flow ratio is due to the payments made on spectrum and M&A activities.
However, the cash ratio gained in 2016 with figures standing 0.39 with company reporting an
increase in cash from the sale of Spectrum. Overall Telstra Corporation has been efficient in
meeting its short financial obligations and the company has been successful in converting
cash (Hoskin et al., 2014).
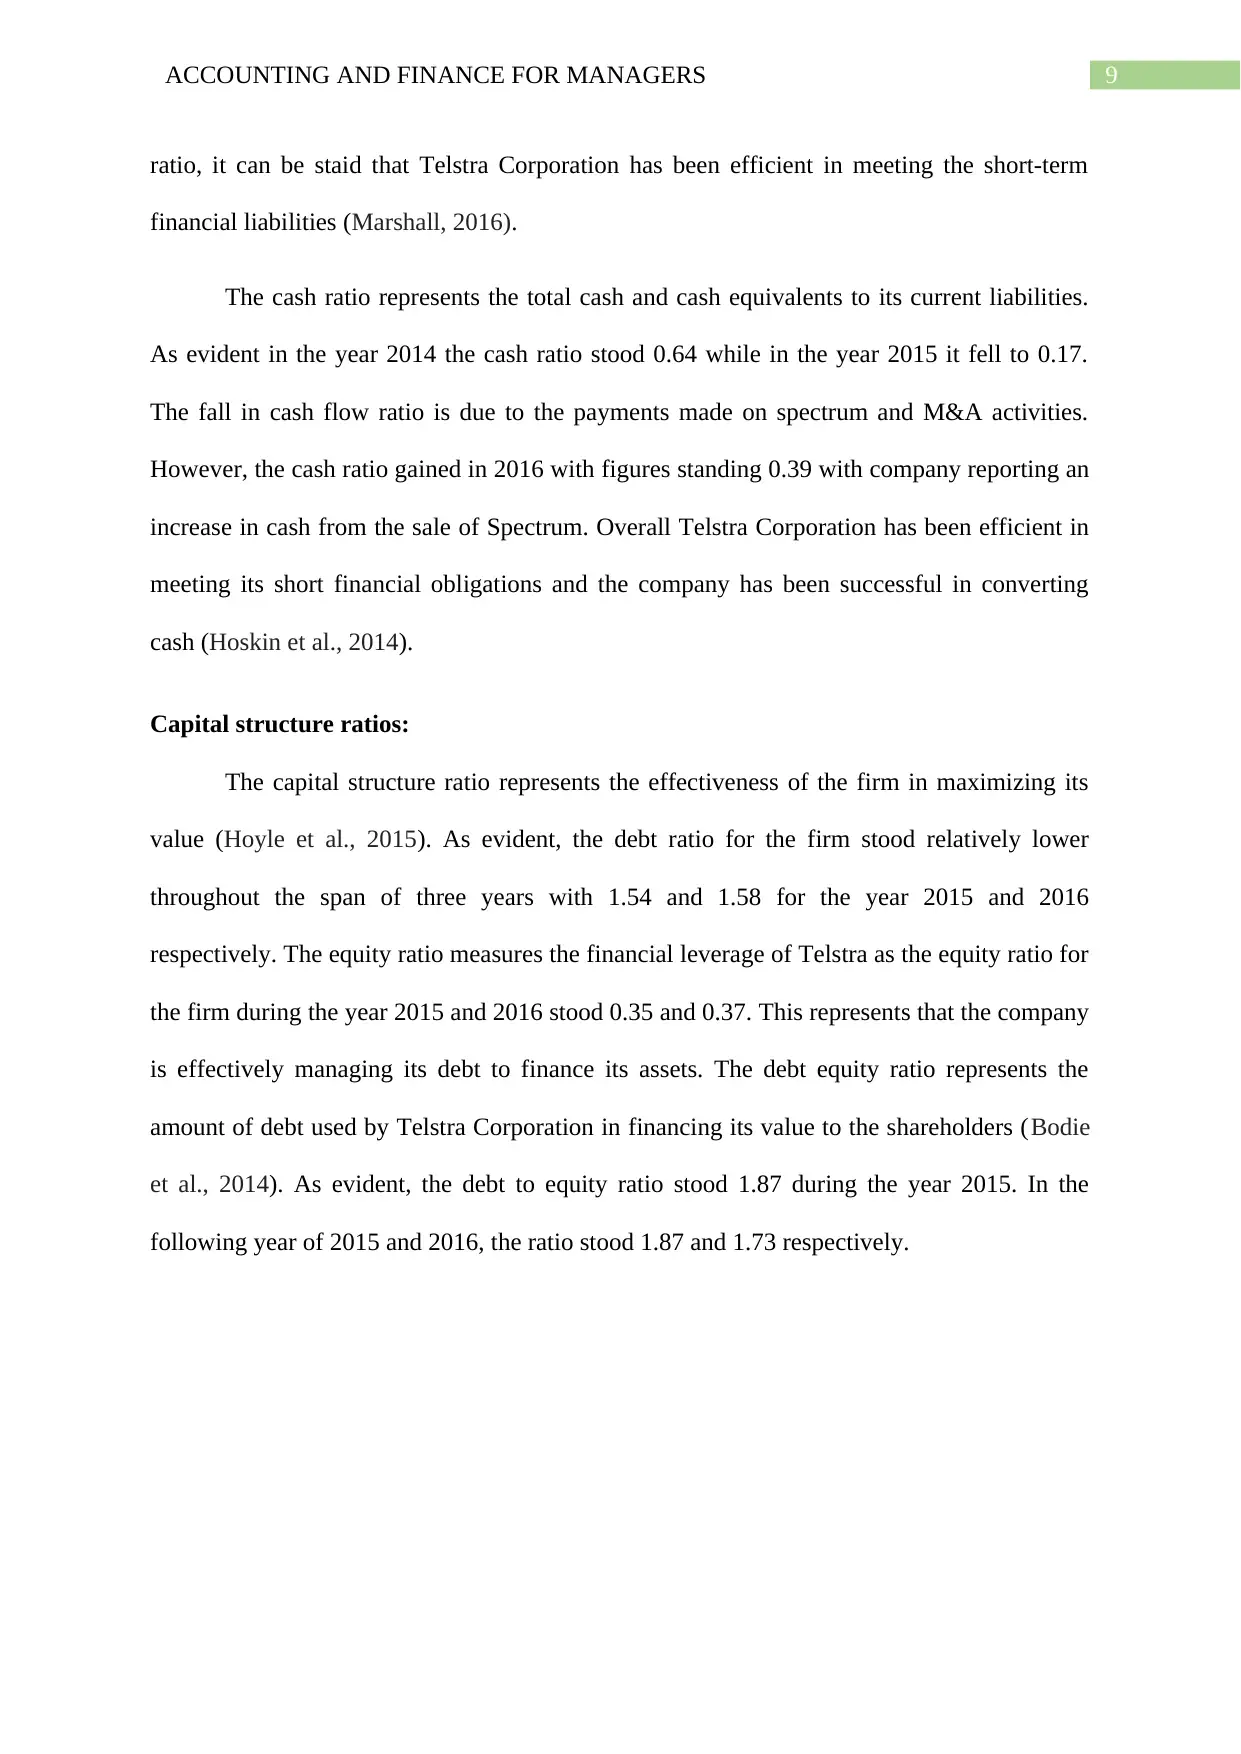
Capital structure ratios:
The capital structure ratio represents the effectiveness of the firm in maximizing its
value (Hoyle et al., 2015). As evident, the debt ratio for the firm stood relatively lower
throughout the span of three years with 1.54 and 1.58 for the year 2015 and 2016
respectively. The equity ratio measures the financial leverage of Telstra as the equity ratio for
the firm during the year 2015 and 2016 stood 0.35 and 0.37. This represents that the company
is effectively managing its debt to finance its assets. The debt equity ratio represents the
amount of debt used by Telstra Corporation in financing its value to the shareholders (Bodie
et al., 2014). As evident, the debt to equity ratio stood 1.87 during the year 2015. In the
following year of 2015 and 2016, the ratio stood 1.87 and 1.73 respectively.
ratio, it can be staid that Telstra Corporation has been efficient in meeting the short-term
financial liabilities (Marshall, 2016).
The cash ratio represents the total cash and cash equivalents to its current liabilities.
As evident in the year 2014 the cash ratio stood 0.64 while in the year 2015 it fell to 0.17.
The fall in cash flow ratio is due to the payments made on spectrum and M&A activities.
However, the cash ratio gained in 2016 with figures standing 0.39 with company reporting an
increase in cash from the sale of Spectrum. Overall Telstra Corporation has been efficient in
meeting its short financial obligations and the company has been successful in converting
cash (Hoskin et al., 2014).
Capital structure ratios:
The capital structure ratio represents the effectiveness of the firm in maximizing its
value (Hoyle et al., 2015). As evident, the debt ratio for the firm stood relatively lower
throughout the span of three years with 1.54 and 1.58 for the year 2015 and 2016
respectively. The equity ratio measures the financial leverage of Telstra as the equity ratio for
the firm during the year 2015 and 2016 stood 0.35 and 0.37. This represents that the company
is effectively managing its debt to finance its assets. The debt equity ratio represents the
amount of debt used by Telstra Corporation in financing its value to the shareholders (Bodie
et al., 2014). As evident, the debt to equity ratio stood 1.87 during the year 2015. In the
following year of 2015 and 2016, the ratio stood 1.87 and 1.73 respectively.
Paraphrase This Document
Need a fresh take? Get an instant paraphrase of this document with our AI Paraphraser
10ACCOUNTING AND FINANCE FOR MANAGERS
Debt Ratio Equity Ratio Debt-Equity Ratio Gearing Ratio
0.00
0.20
0.40
0.60
0.80
1.00
1.20
1.40
1.60
1.80
2.00
Capital Structure Ratios
2014 2015 2016
Figure 4: Figure representing Capital Structure Ratios
(Source: As Created by Author)
Conclusion:
On a conclusive note the analysis, suggest that the overall performance of the firm has
been growing as the business has made advancement in technologies and constant innovation
so that it can reshape the telecommunication technology and market as well. The company
has been able to transform the consumer anticipation with segmented products across its area
of operations. The financial analysis represents that the company has performed well in the
market by improving its revenue from operations.
11ACCOUNTING AND FINANCE FOR MANAGERS
Reference List:
Bodie, Z., Kane, A., & Marcus, A. J. (2014). Investments, 10e. McGraw-Hill Education.
Bourguignon, F., Branson, W. H., & De Melo, J. (2015). Adjustment and income
distribution: A micro-macro model for counterfactual analysis. In Modeling
Developing Countries' Policies in General Equilibrium (pp. 117-139).
Deegan, C. (2013). Financial accounting theory. McGraw-Hill Education Australia.
Dokas, I., Giokas, D., & Tsamis, A. (2014). Liquidity efficiency in the Greek listed firms: a
financial ratio based on data envelopment analysis. International Journal of
Corporate Finance and Accounting (IJCFA), 1(1), 40-59.
Henderson, S., Peirson, G., Herbohn, K., & Howieson, B. (2015). Issues in financial
accounting. Pearson Higher Education AU.
Hoskin, R. E., Fizzell, M. R., & Cherry, D. C. (2014). Financial Accounting: a user
perspective. Wiley Global Education.
Hoyle, J. B., Schaefer, T., & Doupnik, T. (2015). Advanced accounting. McGraw Hill.
Ic, Y. T., Tekin, M., Pamukoglu, F. Z., & Yildirim, S. E. (2015). Development of a financial
performance benchmarking model for corporate firms. Journal of the Faculty of
Engineering and Architecture of Gazi University, 30(1), 71-85.
Jordan, B. (2014). Fundamentals of investments. McGraw-Hill Higher Education.
Marshall, D. (2016). Accounting: What the numbers mean. McGraw-Hill Higher Education.
Pratt, J. (2016). Financial accounting in an economic context. John Wiley & Sons.
Telstra - mobile phones, prepaid phones, broadband, internet, home phones, business phones.
(2018). Telstra.com.au. Retrieved 10 January 2018, from https://www.telstra.com.au/
⊘ This is a preview!⊘
Do you want full access?
Subscribe today to unlock all pages.
Trusted by 1+ million students worldwide
1 out of 14
Related Documents


Your All-in-One AI-Powered Toolkit for Academic Success.
+13062052269
info@desklib.com
Available 24*7 on WhatsApp / Email
![[object Object]](/_next/static/media/star-bottom.7253800d.svg)
Unlock your academic potential
Copyright © 2020–2026 A2Z Services. All Rights Reserved. Developed and managed by ZUCOL.