Analyzing Financial Leverage and Organizational Performance: Telstra
VerifiedAdded on 2020/10/22
|16
|5076
|406
Report
AI Summary
This report provides an in-depth analysis of the impact of financial leverage on the organizational performance of Telstra, a major Australian telecommunications company. It begins with an executive summary, followed by an introduction to the topic, an overview of Telstra, and the research problems and objectives. The literature review covers capital structure, financial performance indicators, the relationship between financial leverage and profitability, and how financial leverage can improve organizational performance. The research methodology includes qualitative and quantitative methods to analyze the implications affecting the organization. The study uses financial ratios such as debt ratio, interest coverage ratio, return on assets, and debt-equity ratio to evaluate Telstra's financial position. The report also examines Telstra's capital structure, including debt and equity, and their impact on financial performance. The conclusion summarizes the findings, and the report includes a comprehensive list of references.

EFFECT OF FINANCIAL LEVERAGE
ON ORGANIZATIONAL
PERFORMANCE
ON ORGANIZATIONAL
PERFORMANCE
Paraphrase This Document
Need a fresh take? Get an instant paraphrase of this document with our AI Paraphraser
EXECUTIVE SUMMARY
This project research is summaries with specific information about the topic related with
the effects of financial leverages on the organisational performances. For this purpose, one of the
most effective organisation named as “TELSTRA” is taken into consideration. All the associated
issues those are faced by the companies is discussed under this research accordingly. In order to
analyse the matter, researcher has set basic aims and objectives in context to the company after
making proper investigation of the facts and figures those are affecting the performance of the
company. apart from this, certain research methods are also being taken into account such as
qualitative and quantitative to analyse all the implications those are affecting the organisation.
Along with this, certain financial leverages and measure to analyse the financial position of the
company is being discussed under this research properly. However, various types of research
methods which will be helpful for the researcher to conduct all essential aspects more
effectively.
Table of Contents
EXECUTIVE SUMMARY.............................................................................................................2
INTRODUCTION...........................................................................................................................1
Introduction to the topic..............................................................................................................1
Overview of the organisation......................................................................................................1
Real problems and importance of research topic........................................................................2
RESEARCH PROBLEMS..............................................................................................................2
RESEARCH OBJECTIVES............................................................................................................2
LITERATURE REVIEW................................................................................................................4
Capital structure..........................................................................................................................4
Indicators to measure financial performance of an organisation................................................4
Current relation between Financial leverage and profitability....................................................7
Financial leverage to improve performance of organisation.......................................................8
RESEARCH METHODOLOGY...................................................................................................12
CONCLUSION..............................................................................................................................13
REFERENCES..............................................................................................................................14
⊘ This is a preview!⊘
Do you want full access?
Subscribe today to unlock all pages.
Trusted by 1+ million students worldwide
INTRODUCTION
Introduction to the topic
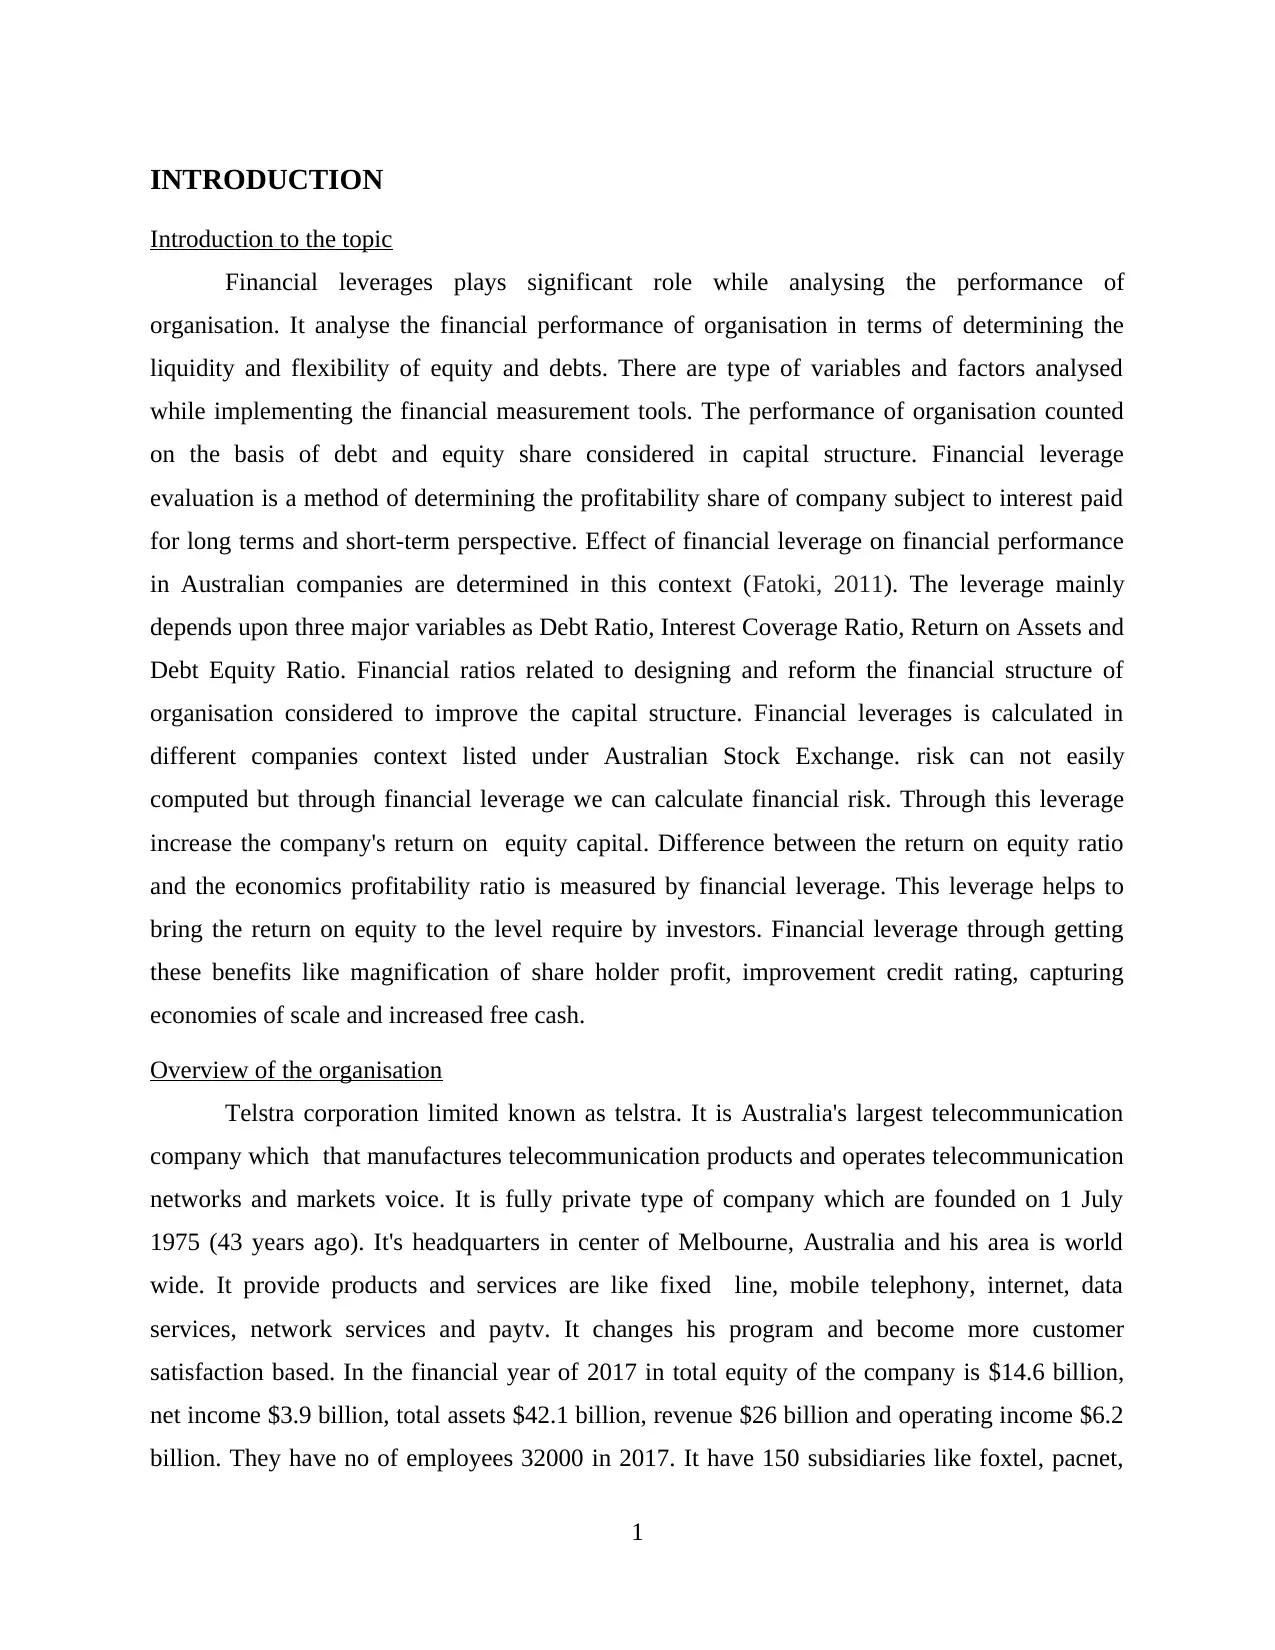
Financial leverages plays significant role while analysing the performance of
organisation. It analyse the financial performance of organisation in terms of determining the
liquidity and flexibility of equity and debts. There are type of variables and factors analysed
while implementing the financial measurement tools. The performance of organisation counted
on the basis of debt and equity share considered in capital structure. Financial leverage
evaluation is a method of determining the profitability share of company subject to interest paid
for long terms and short-term perspective. Effect of financial leverage on financial performance
in Australian companies are determined in this context (Fatoki, 2011). The leverage mainly
depends upon three major variables as Debt Ratio, Interest Coverage Ratio, Return on Assets and
Debt Equity Ratio. Financial ratios related to designing and reform the financial structure of
organisation considered to improve the capital structure. Financial leverages is calculated in
different companies context listed under Australian Stock Exchange. risk can not easily
computed but through financial leverage we can calculate financial risk. Through this leverage
increase the company's return on equity capital. Difference between the return on equity ratio
and the economics profitability ratio is measured by financial leverage. This leverage helps to
bring the return on equity to the level require by investors. Financial leverage through getting
these benefits like magnification of share holder profit, improvement credit rating, capturing
economies of scale and increased free cash.
Overview of the organisation
Telstra corporation limited known as telstra. It is Australia's largest telecommunication
company which that manufactures telecommunication products and operates telecommunication
networks and markets voice. It is fully private type of company which are founded on 1 July
1975 (43 years ago). It's headquarters in center of Melbourne, Australia and his area is world
wide. It provide products and services are like fixed line, mobile telephony, internet, data
services, network services and paytv. It changes his program and become more customer
satisfaction based. In the financial year of 2017 in total equity of the company is $14.6 billion,
net income $3.9 billion, total assets $42.1 billion, revenue $26 billion and operating income $6.2
billion. They have no of employees 32000 in 2017. It have 150 subsidiaries like foxtel, pacnet,
1
Introduction to the topic
Financial leverages plays significant role while analysing the performance of
organisation. It analyse the financial performance of organisation in terms of determining the
liquidity and flexibility of equity and debts. There are type of variables and factors analysed
while implementing the financial measurement tools. The performance of organisation counted
on the basis of debt and equity share considered in capital structure. Financial leverage
evaluation is a method of determining the profitability share of company subject to interest paid
for long terms and short-term perspective. Effect of financial leverage on financial performance
in Australian companies are determined in this context (Fatoki, 2011). The leverage mainly
depends upon three major variables as Debt Ratio, Interest Coverage Ratio, Return on Assets and
Debt Equity Ratio. Financial ratios related to designing and reform the financial structure of
organisation considered to improve the capital structure. Financial leverages is calculated in
different companies context listed under Australian Stock Exchange. risk can not easily
computed but through financial leverage we can calculate financial risk. Through this leverage
increase the company's return on equity capital. Difference between the return on equity ratio
and the economics profitability ratio is measured by financial leverage. This leverage helps to
bring the return on equity to the level require by investors. Financial leverage through getting
these benefits like magnification of share holder profit, improvement credit rating, capturing
economies of scale and increased free cash.
Overview of the organisation
Telstra corporation limited known as telstra. It is Australia's largest telecommunication
company which that manufactures telecommunication products and operates telecommunication
networks and markets voice. It is fully private type of company which are founded on 1 July
1975 (43 years ago). It's headquarters in center of Melbourne, Australia and his area is world
wide. It provide products and services are like fixed line, mobile telephony, internet, data
services, network services and paytv. It changes his program and become more customer
satisfaction based. In the financial year of 2017 in total equity of the company is $14.6 billion,
net income $3.9 billion, total assets $42.1 billion, revenue $26 billion and operating income $6.2
billion. They have no of employees 32000 in 2017. It have 150 subsidiaries like foxtel, pacnet,
1
Paraphrase This Document
Need a fresh take? Get an instant paraphrase of this document with our AI Paraphraser
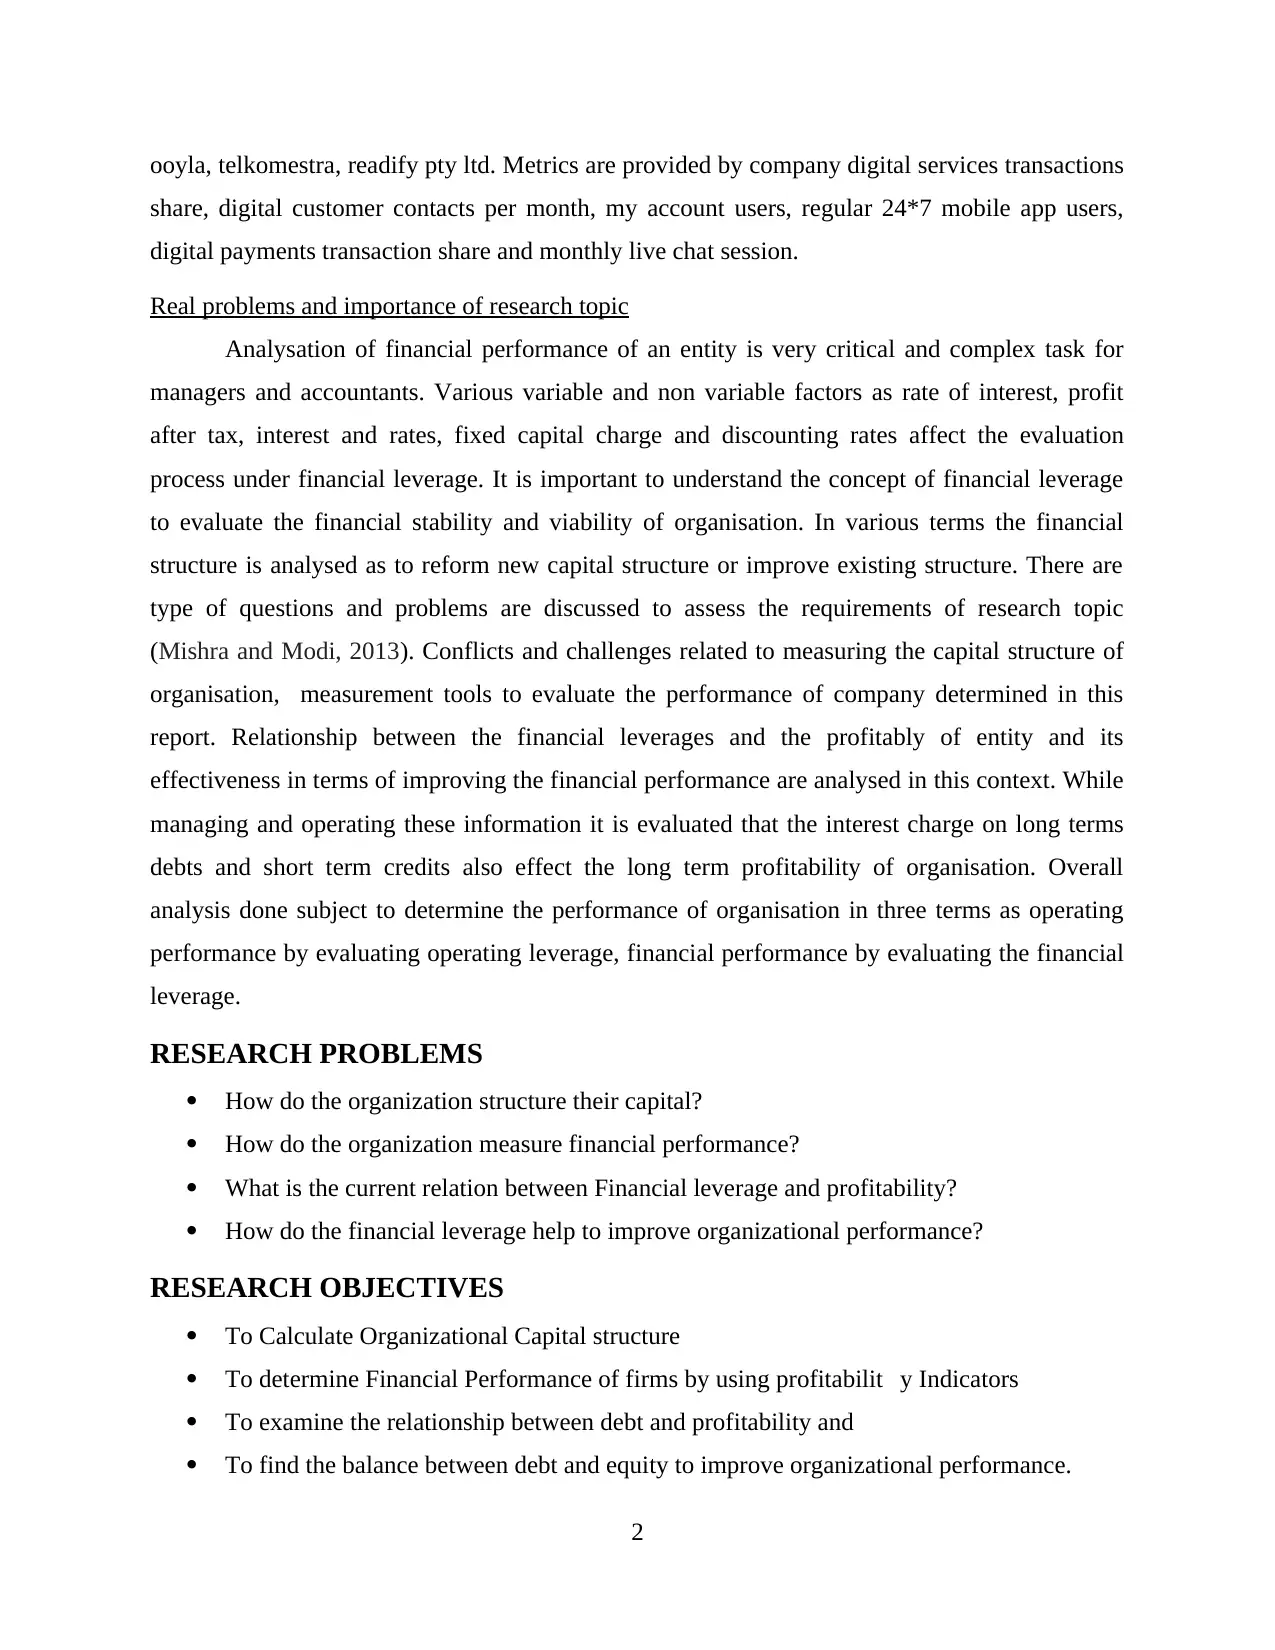
ooyla, telkomestra, readify pty ltd. Metrics are provided by company digital services transactions
share, digital customer contacts per month, my account users, regular 24*7 mobile app users,
digital payments transaction share and monthly live chat session.
Real problems and importance of research topic
Analysation of financial performance of an entity is very critical and complex task for
managers and accountants. Various variable and non variable factors as rate of interest, profit
after tax, interest and rates, fixed capital charge and discounting rates affect the evaluation
process under financial leverage. It is important to understand the concept of financial leverage
to evaluate the financial stability and viability of organisation. In various terms the financial
structure is analysed as to reform new capital structure or improve existing structure. There are
type of questions and problems are discussed to assess the requirements of research topic
(Mishra and Modi, 2013). Conflicts and challenges related to measuring the capital structure of
organisation, measurement tools to evaluate the performance of company determined in this
report. Relationship between the financial leverages and the profitably of entity and its
effectiveness in terms of improving the financial performance are analysed in this context. While
managing and operating these information it is evaluated that the interest charge on long terms
debts and short term credits also effect the long term profitability of organisation. Overall
analysis done subject to determine the performance of organisation in three terms as operating
performance by evaluating operating leverage, financial performance by evaluating the financial
leverage.
RESEARCH PROBLEMS
How do the organization structure their capital?
How do the organization measure financial performance?
What is the current relation between Financial leverage and profitability?
How do the financial leverage help to improve organizational performance?
RESEARCH OBJECTIVES
To Calculate Organizational Capital structure
To determine Financial Performance of firms by using profitabilit y Indicators
To examine the relationship between debt and profitability and
To find the balance between debt and equity to improve organizational performance.
2
LITERATURE REVIEW
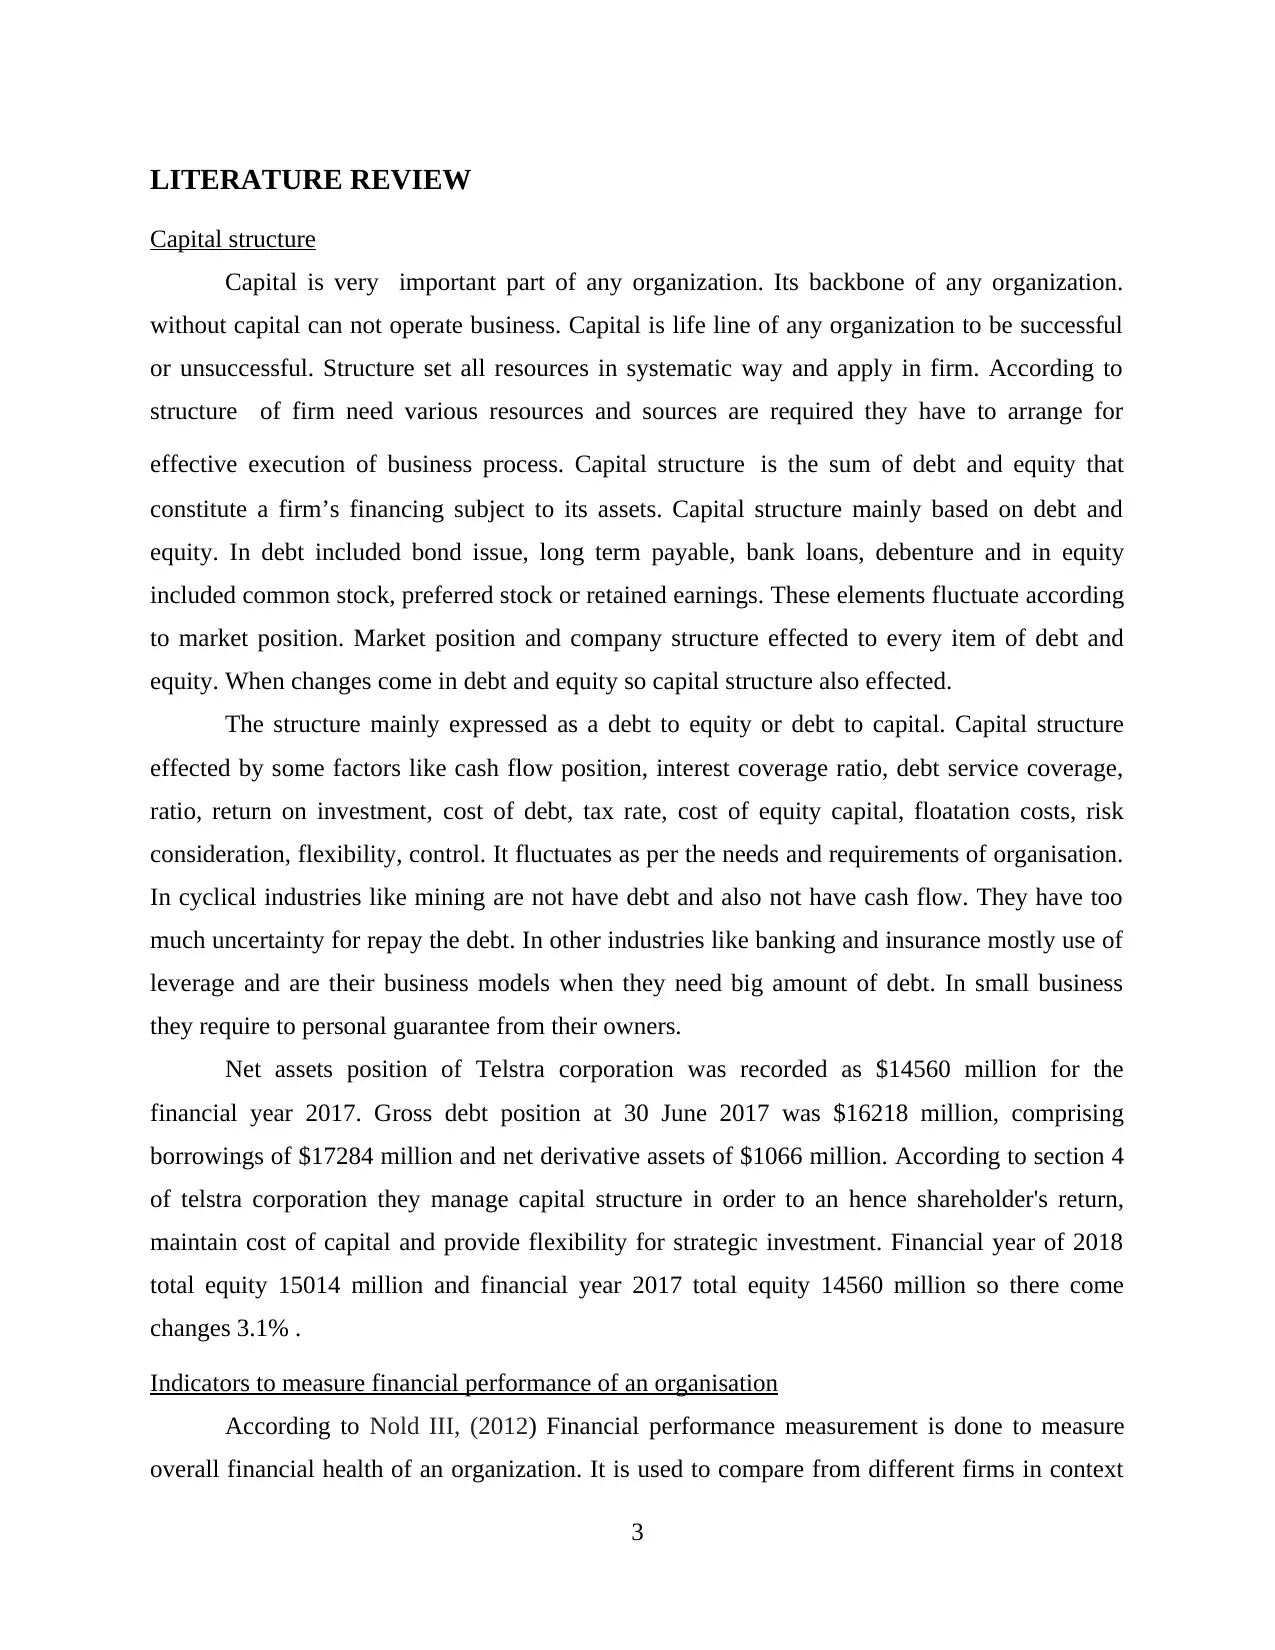
Capital structure
Capital is very important part of any organization. Its backbone of any organization.
without capital can not operate business. Capital is life line of any organization to be successful
or unsuccessful. Structure set all resources in systematic way and apply in firm. According to
structure of firm need various resources and sources are required they have to arrange for
effective execution of business process. Capital structure is the sum of debt and equity that
constitute a firm’s financing subject to its assets. Capital structure mainly based on debt and
equity. In debt included bond issue, long term payable, bank loans, debenture and in equity
included common stock, preferred stock or retained earnings. These elements fluctuate according
to market position. Market position and company structure effected to every item of debt and
equity. When changes come in debt and equity so capital structure also effected.
The structure mainly expressed as a debt to equity or debt to capital. Capital structure
effected by some factors like cash flow position, interest coverage ratio, debt service coverage,
ratio, return on investment, cost of debt, tax rate, cost of equity capital, floatation costs, risk
consideration, flexibility, control. It fluctuates as per the needs and requirements of organisation.
In cyclical industries like mining are not have debt and also not have cash flow. They have too
much uncertainty for repay the debt. In other industries like banking and insurance mostly use of
leverage and are their business models when they need big amount of debt. In small business
they require to personal guarantee from their owners.
Net assets position of Telstra corporation was recorded as $14560 million for the
financial year 2017. Gross debt position at 30 June 2017 was $16218 million, comprising
borrowings of $17284 million and net derivative assets of $1066 million. According to section 4
of telstra corporation they manage capital structure in order to an hence shareholder's return,
maintain cost of capital and provide flexibility for strategic investment. Financial year of 2018
total equity 15014 million and financial year 2017 total equity 14560 million so there come
changes 3.1% .
Indicators to measure financial performance of an organisation
According to Nold III, (2012) Financial performance measurement is done to measure
overall financial health of an organization. It is used to compare from different firms in context
3
⊘ This is a preview!⊘
Do you want full access?
Subscribe today to unlock all pages.
Trusted by 1+ million students worldwide
of income generation from assets. There are many stakeholders such as creditors, investors,
employees, management, government etc. have their interest in getting informed and updated
about the financial performance of an organization. Source of information for measuring
financial performance on annual basis are balance sheet, income statement and cash flow
statement. Balance sheet shows the position of assets and liabilities at the end of financial year.
Income statement provides gross profit margin, cost of goods sold, revenue and expenses of a
company. Cash flow statement is a combination of income statement and balance sheet provides
the uses of cash flow from operations, investing and financing activities.
Ratio analysis is also used to evaluate financial performance on the basis of historical
data and one can compare these ratios either with different accounting year of same company or
with the different company in the same industry. Financial ratios are mainly categorized in four
main groups which are as follows:
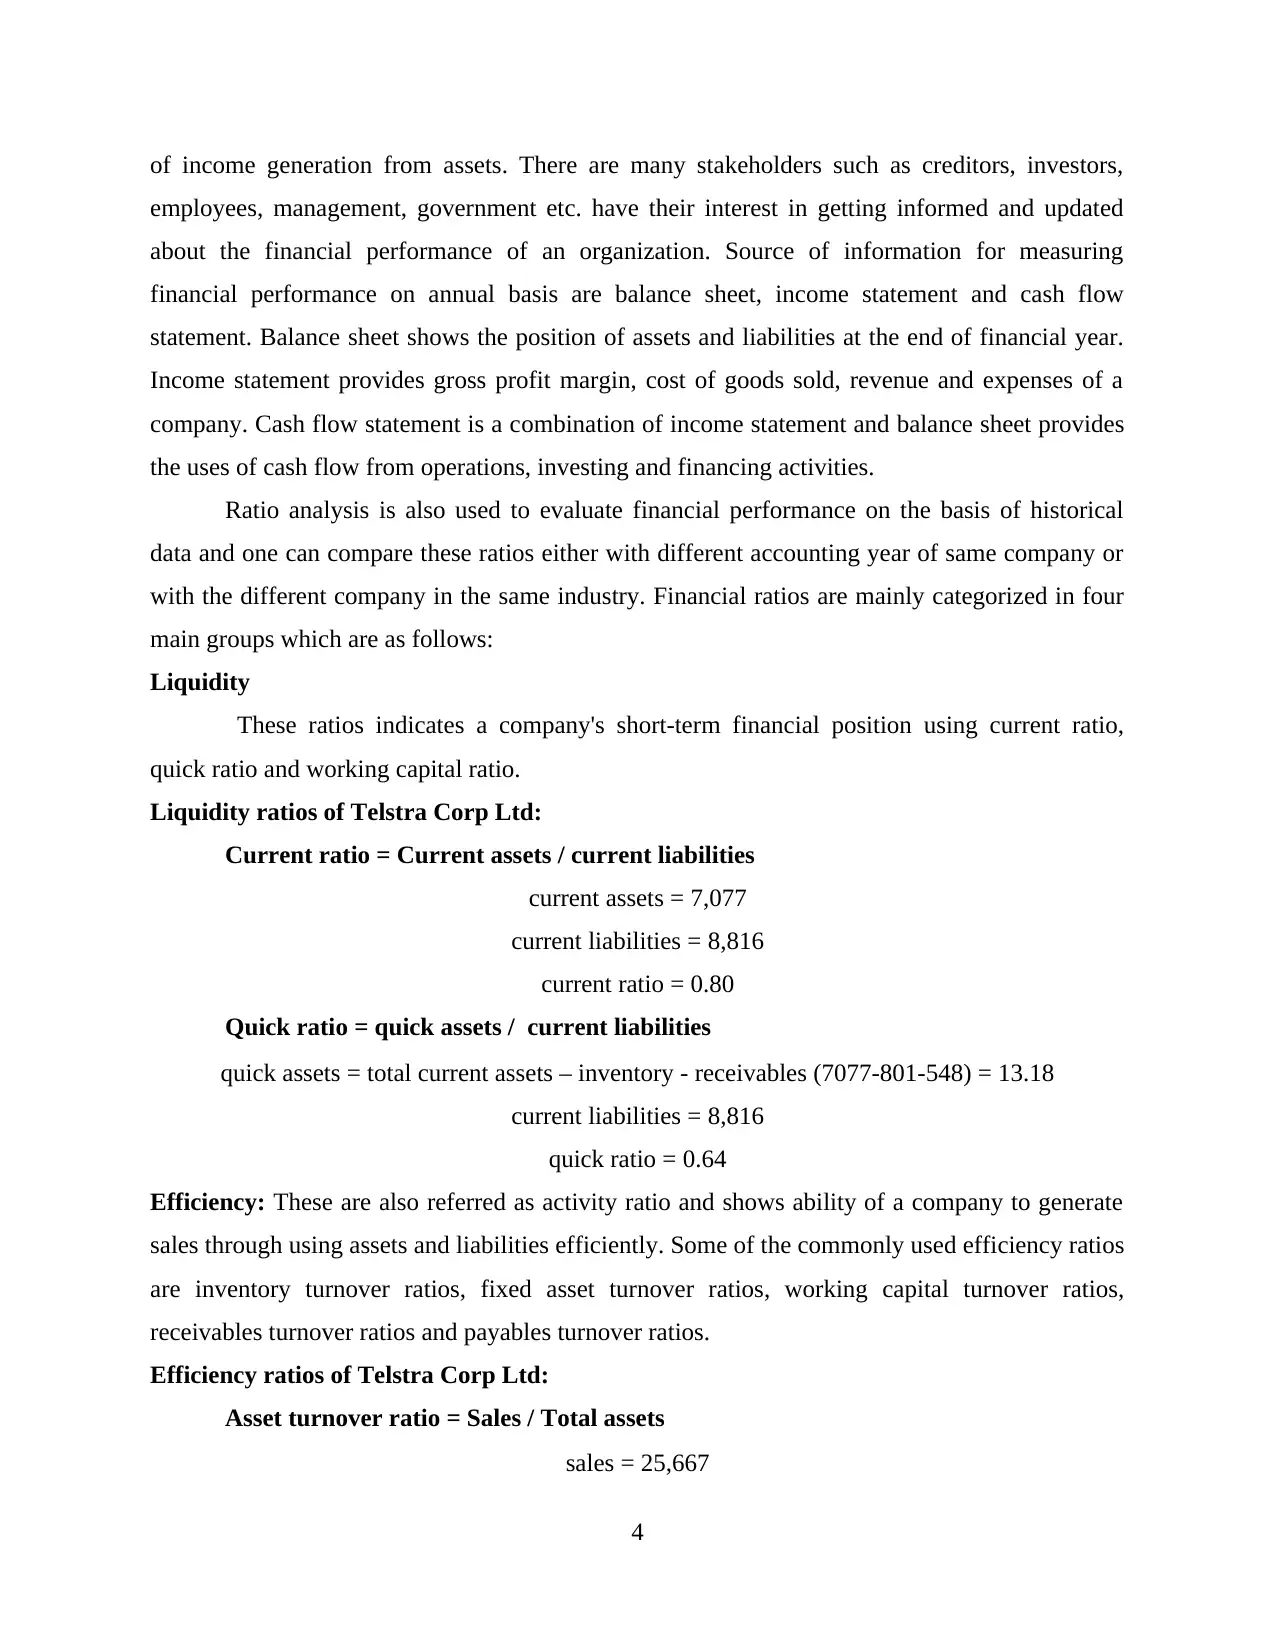
Liquidity
These ratios indicates a company's short-term financial position using current ratio,
quick ratio and working capital ratio.
Liquidity ratios of Telstra Corp Ltd:
Current ratio = Current assets / current liabilities
current assets = 7,077
current liabilities = 8,816
current ratio = 0.80
Quick ratio = quick assets / current liabilities
quick assets = total current assets – inventory - receivables (7077-801-548) = 13.18
current liabilities = 8,816
quick ratio = 0.64
Efficiency: These are also referred as activity ratio and shows ability of a company to generate
sales through using assets and liabilities efficiently. Some of the commonly used efficiency ratios
are inventory turnover ratios, fixed asset turnover ratios, working capital turnover ratios,
receivables turnover ratios and payables turnover ratios.
Efficiency ratios of Telstra Corp Ltd:
Asset turnover ratio = Sales / Total assets
sales = 25,667
4
employees, management, government etc. have their interest in getting informed and updated
about the financial performance of an organization. Source of information for measuring
financial performance on annual basis are balance sheet, income statement and cash flow
statement. Balance sheet shows the position of assets and liabilities at the end of financial year.
Income statement provides gross profit margin, cost of goods sold, revenue and expenses of a
company. Cash flow statement is a combination of income statement and balance sheet provides
the uses of cash flow from operations, investing and financing activities.
Ratio analysis is also used to evaluate financial performance on the basis of historical
data and one can compare these ratios either with different accounting year of same company or
with the different company in the same industry. Financial ratios are mainly categorized in four
main groups which are as follows:
Liquidity
These ratios indicates a company's short-term financial position using current ratio,
quick ratio and working capital ratio.
Liquidity ratios of Telstra Corp Ltd:
Current ratio = Current assets / current liabilities
current assets = 7,077
current liabilities = 8,816
current ratio = 0.80
Quick ratio = quick assets / current liabilities
quick assets = total current assets – inventory - receivables (7077-801-548) = 13.18
current liabilities = 8,816
quick ratio = 0.64
Efficiency: These are also referred as activity ratio and shows ability of a company to generate
sales through using assets and liabilities efficiently. Some of the commonly used efficiency ratios
are inventory turnover ratios, fixed asset turnover ratios, working capital turnover ratios,
receivables turnover ratios and payables turnover ratios.
Efficiency ratios of Telstra Corp Ltd:
Asset turnover ratio = Sales / Total assets
sales = 25,667
4
Paraphrase This Document
Need a fresh take? Get an instant paraphrase of this document with our AI Paraphraser
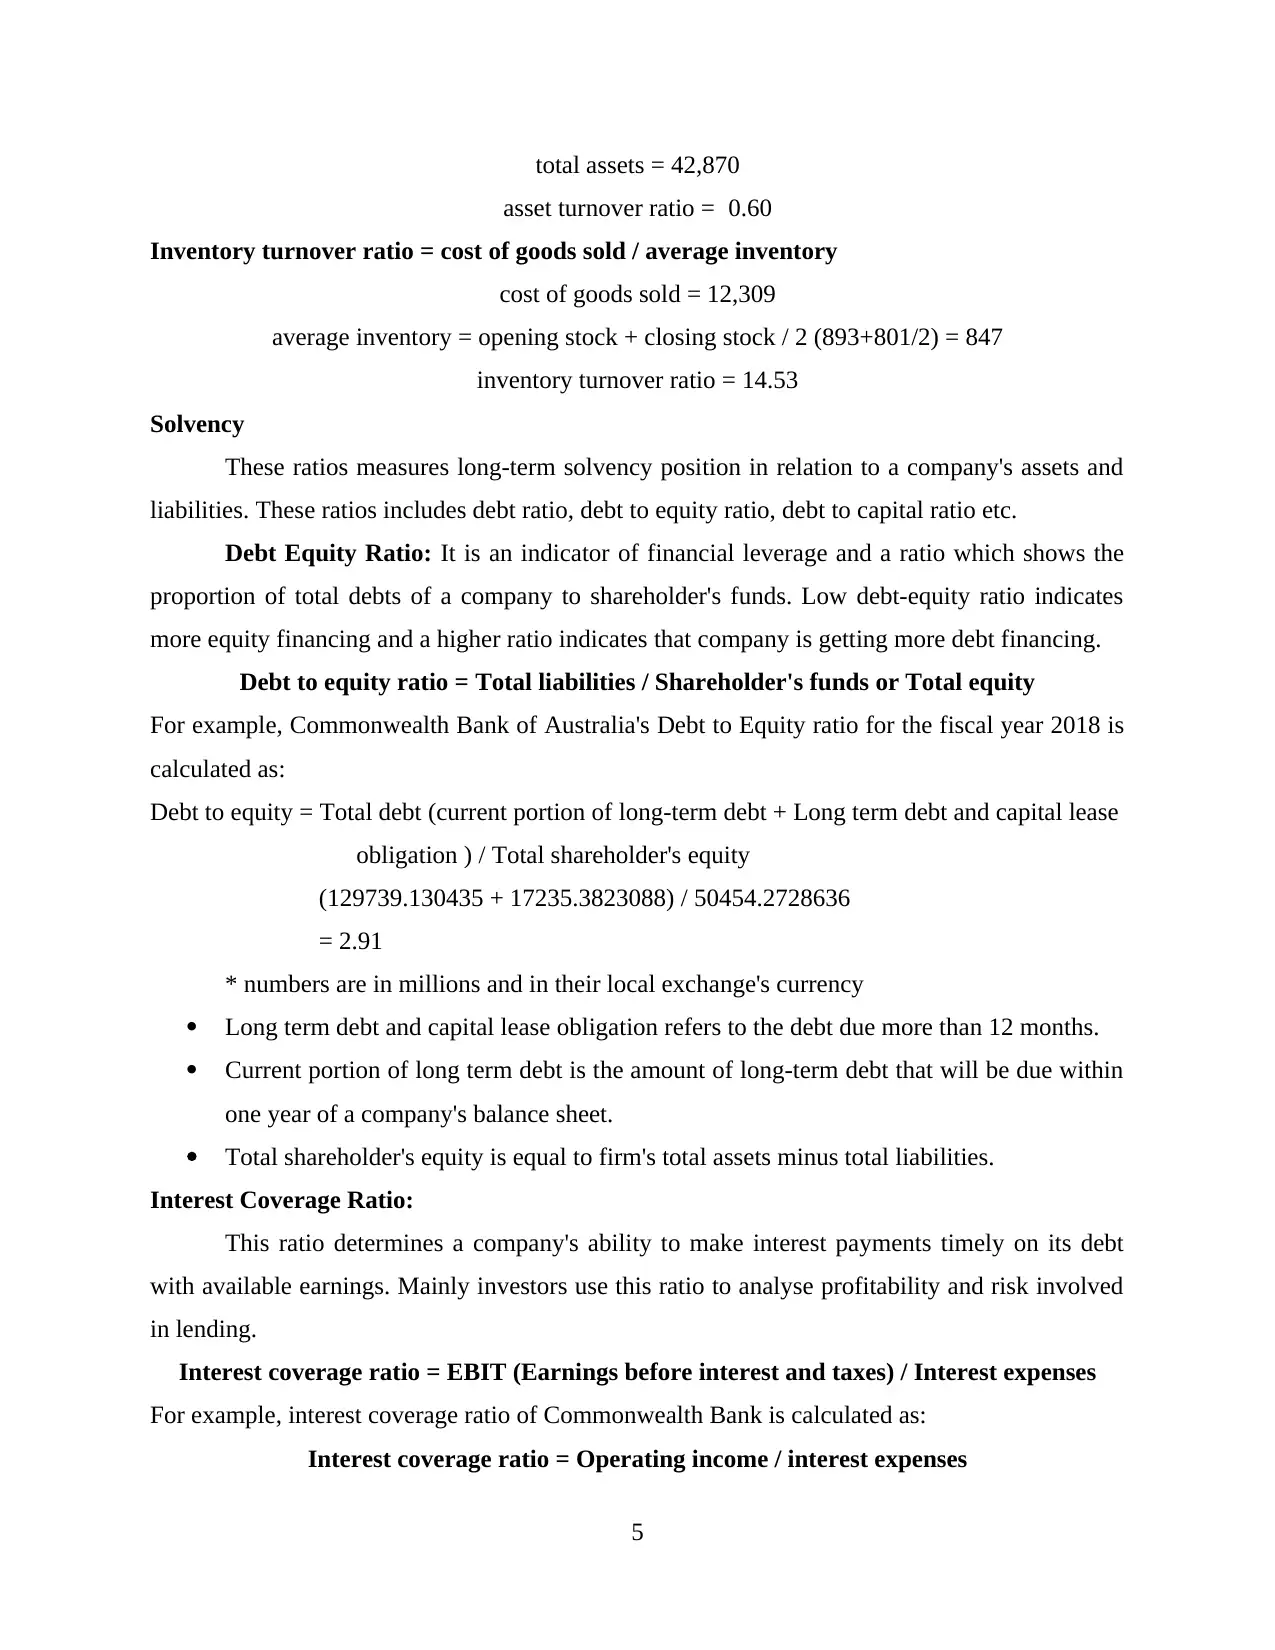
total assets = 42,870
asset turnover ratio = 0.60
Inventory turnover ratio = cost of goods sold / average inventory
cost of goods sold = 12,309
average inventory = opening stock + closing stock / 2 (893+801/2) = 847
inventory turnover ratio = 14.53
Solvency
These ratios measures long-term solvency position in relation to a company's assets and
liabilities. These ratios includes debt ratio, debt to equity ratio, debt to capital ratio etc.
Debt Equity Ratio: It is an indicator of financial leverage and a ratio which shows the
proportion of total debts of a company to shareholder's funds. Low debt-equity ratio indicates
more equity financing and a higher ratio indicates that company is getting more debt financing.
Debt to equity ratio = Total liabilities / Shareholder's funds or Total equity
For example, Commonwealth Bank of Australia's Debt to Equity ratio for the fiscal year 2018 is
calculated as:
Debt to equity = Total debt (current portion of long-term debt + Long term debt and capital lease
obligation ) / Total shareholder's equity
(129739.130435 + 17235.3823088) / 50454.2728636
= 2.91
* numbers are in millions and in their local exchange's currency
Long term debt and capital lease obligation refers to the debt due more than 12 months.
Current portion of long term debt is the amount of long-term debt that will be due within
one year of a company's balance sheet.
Total shareholder's equity is equal to firm's total assets minus total liabilities.
Interest Coverage Ratio:
This ratio determines a company's ability to make interest payments timely on its debt
with available earnings. Mainly investors use this ratio to analyse profitability and risk involved
in lending.
Interest coverage ratio = EBIT (Earnings before interest and taxes) / Interest expenses
For example, interest coverage ratio of Commonwealth Bank is calculated as:
Interest coverage ratio = Operating income / interest expenses
5
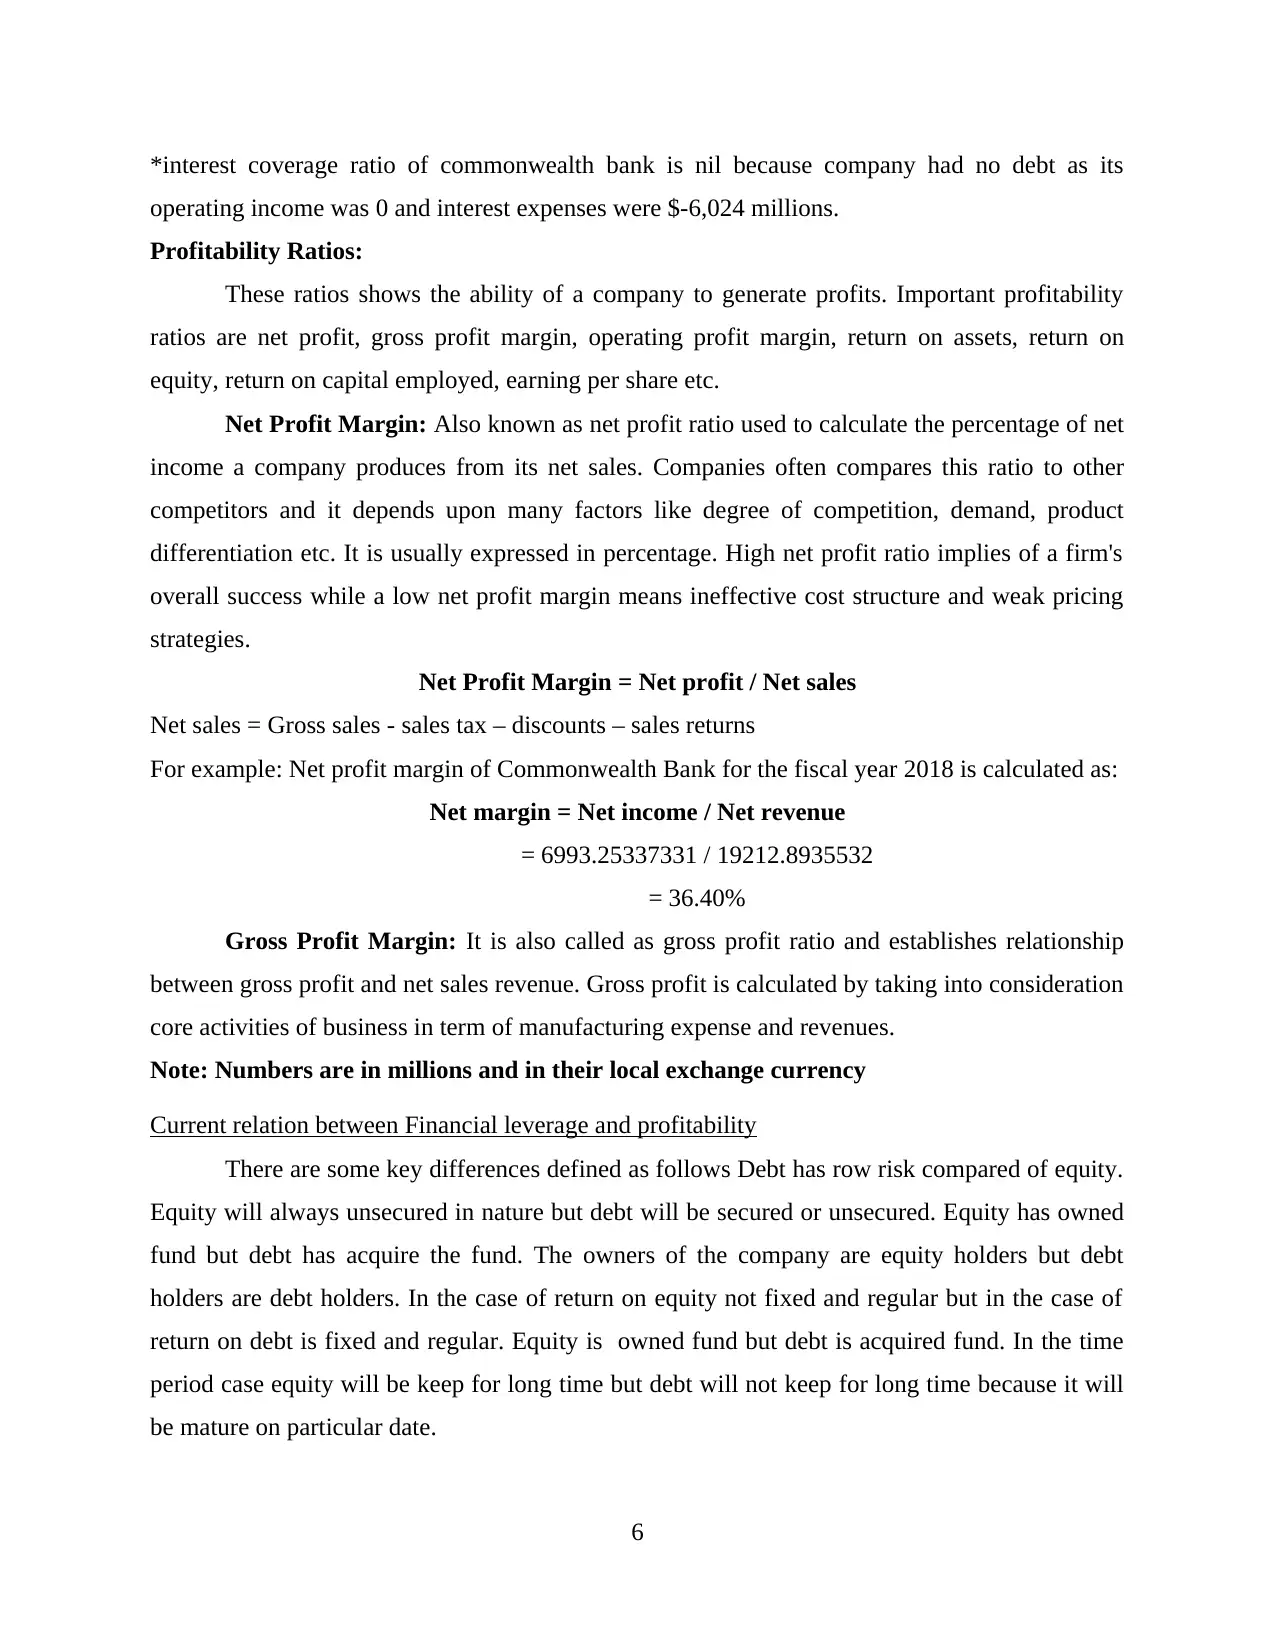
*interest coverage ratio of commonwealth bank is nil because company had no debt as its
operating income was 0 and interest expenses were $-6,024 millions.
Profitability Ratios:
These ratios shows the ability of a company to generate profits. Important profitability
ratios are net profit, gross profit margin, operating profit margin, return on assets, return on
equity, return on capital employed, earning per share etc.
Net Profit Margin: Also known as net profit ratio used to calculate the percentage of net
income a company produces from its net sales. Companies often compares this ratio to other
competitors and it depends upon many factors like degree of competition, demand, product
differentiation etc. It is usually expressed in percentage. High net profit ratio implies of a firm's
overall success while a low net profit margin means ineffective cost structure and weak pricing
strategies.
Net Profit Margin = Net profit / Net sales
Net sales = Gross sales - sales tax – discounts – sales returns
For example: Net profit margin of Commonwealth Bank for the fiscal year 2018 is calculated as:
Net margin = Net income / Net revenue
= 6993.25337331 / 19212.8935532
= 36.40%
Gross Profit Margin: It is also called as gross profit ratio and establishes relationship
between gross profit and net sales revenue. Gross profit is calculated by taking into consideration
core activities of business in term of manufacturing expense and revenues.
Note: Numbers are in millions and in their local exchange currency
Current relation between Financial leverage and profitability
There are some key differences defined as follows Debt has row risk compared of equity.
Equity will always unsecured in nature but debt will be secured or unsecured. Equity has owned
fund but debt has acquire the fund. The owners of the company are equity holders but debt
holders are debt holders. In the case of return on equity not fixed and regular but in the case of
return on debt is fixed and regular. Equity is owned fund but debt is acquired fund. In the time
period case equity will be keep for long time but debt will not keep for long time because it will
be mature on particular date.
6
⊘ This is a preview!⊘
Do you want full access?
Subscribe today to unlock all pages.
Trusted by 1+ million students worldwide
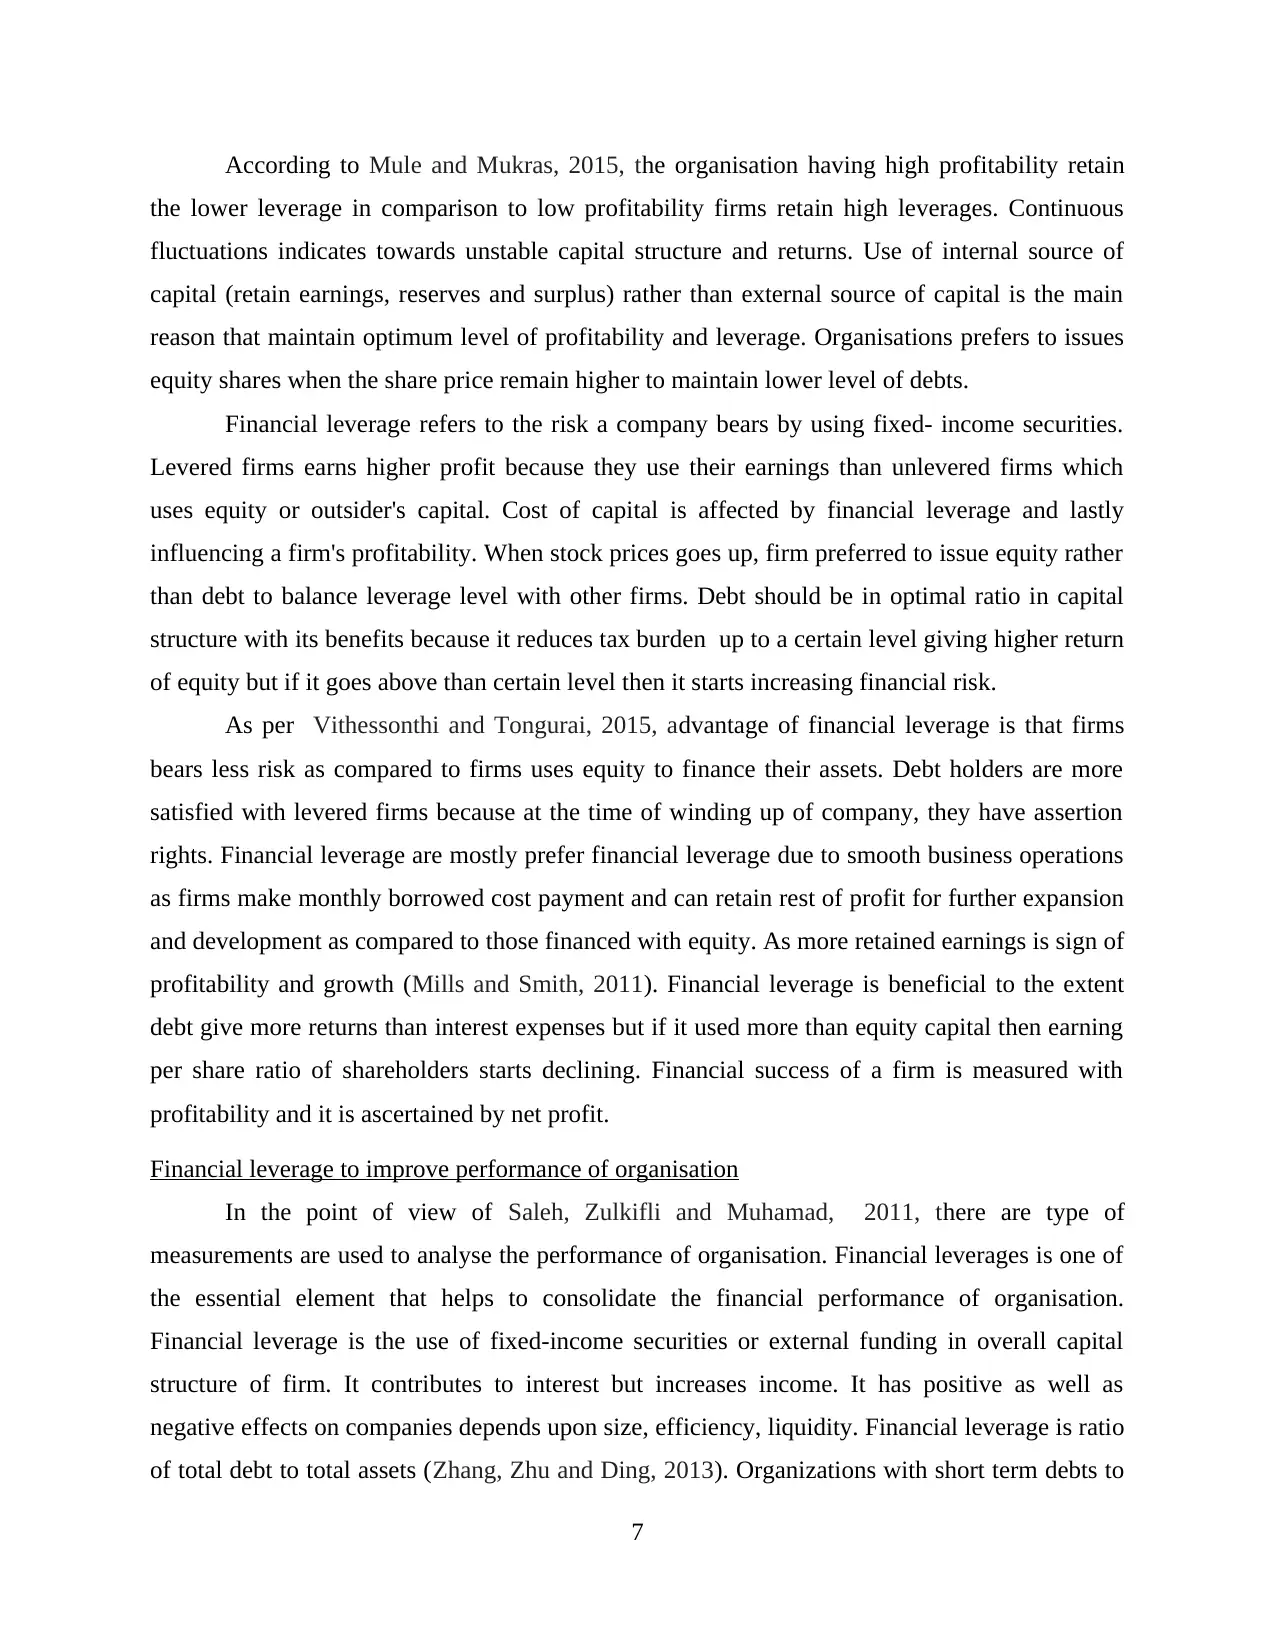
According to Mule and Mukras, 2015, the organisation having high profitability retain
the lower leverage in comparison to low profitability firms retain high leverages. Continuous
fluctuations indicates towards unstable capital structure and returns. Use of internal source of
capital (retain earnings, reserves and surplus) rather than external source of capital is the main
reason that maintain optimum level of profitability and leverage. Organisations prefers to issues
equity shares when the share price remain higher to maintain lower level of debts.
Financial leverage refers to the risk a company bears by using fixed- income securities.
Levered firms earns higher profit because they use their earnings than unlevered firms which
uses equity or outsider's capital. Cost of capital is affected by financial leverage and lastly
influencing a firm's profitability. When stock prices goes up, firm preferred to issue equity rather
than debt to balance leverage level with other firms. Debt should be in optimal ratio in capital
structure with its benefits because it reduces tax burden up to a certain level giving higher return
of equity but if it goes above than certain level then it starts increasing financial risk.
As per Vithessonthi and Tongurai, 2015, advantage of financial leverage is that firms
bears less risk as compared to firms uses equity to finance their assets. Debt holders are more
satisfied with levered firms because at the time of winding up of company, they have assertion
rights. Financial leverage are mostly prefer financial leverage due to smooth business operations
as firms make monthly borrowed cost payment and can retain rest of profit for further expansion
and development as compared to those financed with equity. As more retained earnings is sign of
profitability and growth (Mills and Smith, 2011). Financial leverage is beneficial to the extent
debt give more returns than interest expenses but if it used more than equity capital then earning
per share ratio of shareholders starts declining. Financial success of a firm is measured with
profitability and it is ascertained by net profit.
Financial leverage to improve performance of organisation
In the point of view of Saleh, Zulkifli and Muhamad, 2011, there are type of
measurements are used to analyse the performance of organisation. Financial leverages is one of
the essential element that helps to consolidate the financial performance of organisation.
Financial leverage is the use of fixed-income securities or external funding in overall capital
structure of firm. It contributes to interest but increases income. It has positive as well as
negative effects on companies depends upon size, efficiency, liquidity. Financial leverage is ratio
of total debt to total assets (Zhang, Zhu and Ding, 2013). Organizations with short term debts to
7
Paraphrase This Document
Need a fresh take? Get an instant paraphrase of this document with our AI Paraphraser
total assets have high growth and performance because direct and indirect costs are associated
with long-term debts results low profitability. High performance resulted in high rate tax rate.
Profitability and efficiency increased by using financial leverages. As debt increases, managerial
efficiency and interest also increases because interest is tax deductible. But these should be used
optimally that cost should not exceed benefits. As per the Miller, Le Breton‐Miller and Lester,
2011 along with this, management should also take care about shareholder's objective of wealth
maximization. Soundness of financial performance depends on quality of assets, capital
adequacy, dividend policy, earnings. Financial leverages indicates positive effect in short-term
period but may be negative in longer span of time. High leverage helps to reduce agency
expenses because managers can misuse organization's high profitability for their personal
benefits. Size of organization also effects on borrowings, as huge firms can get funding from
diversified sources having low risk of bankruptcy hence having a low cost of capital.
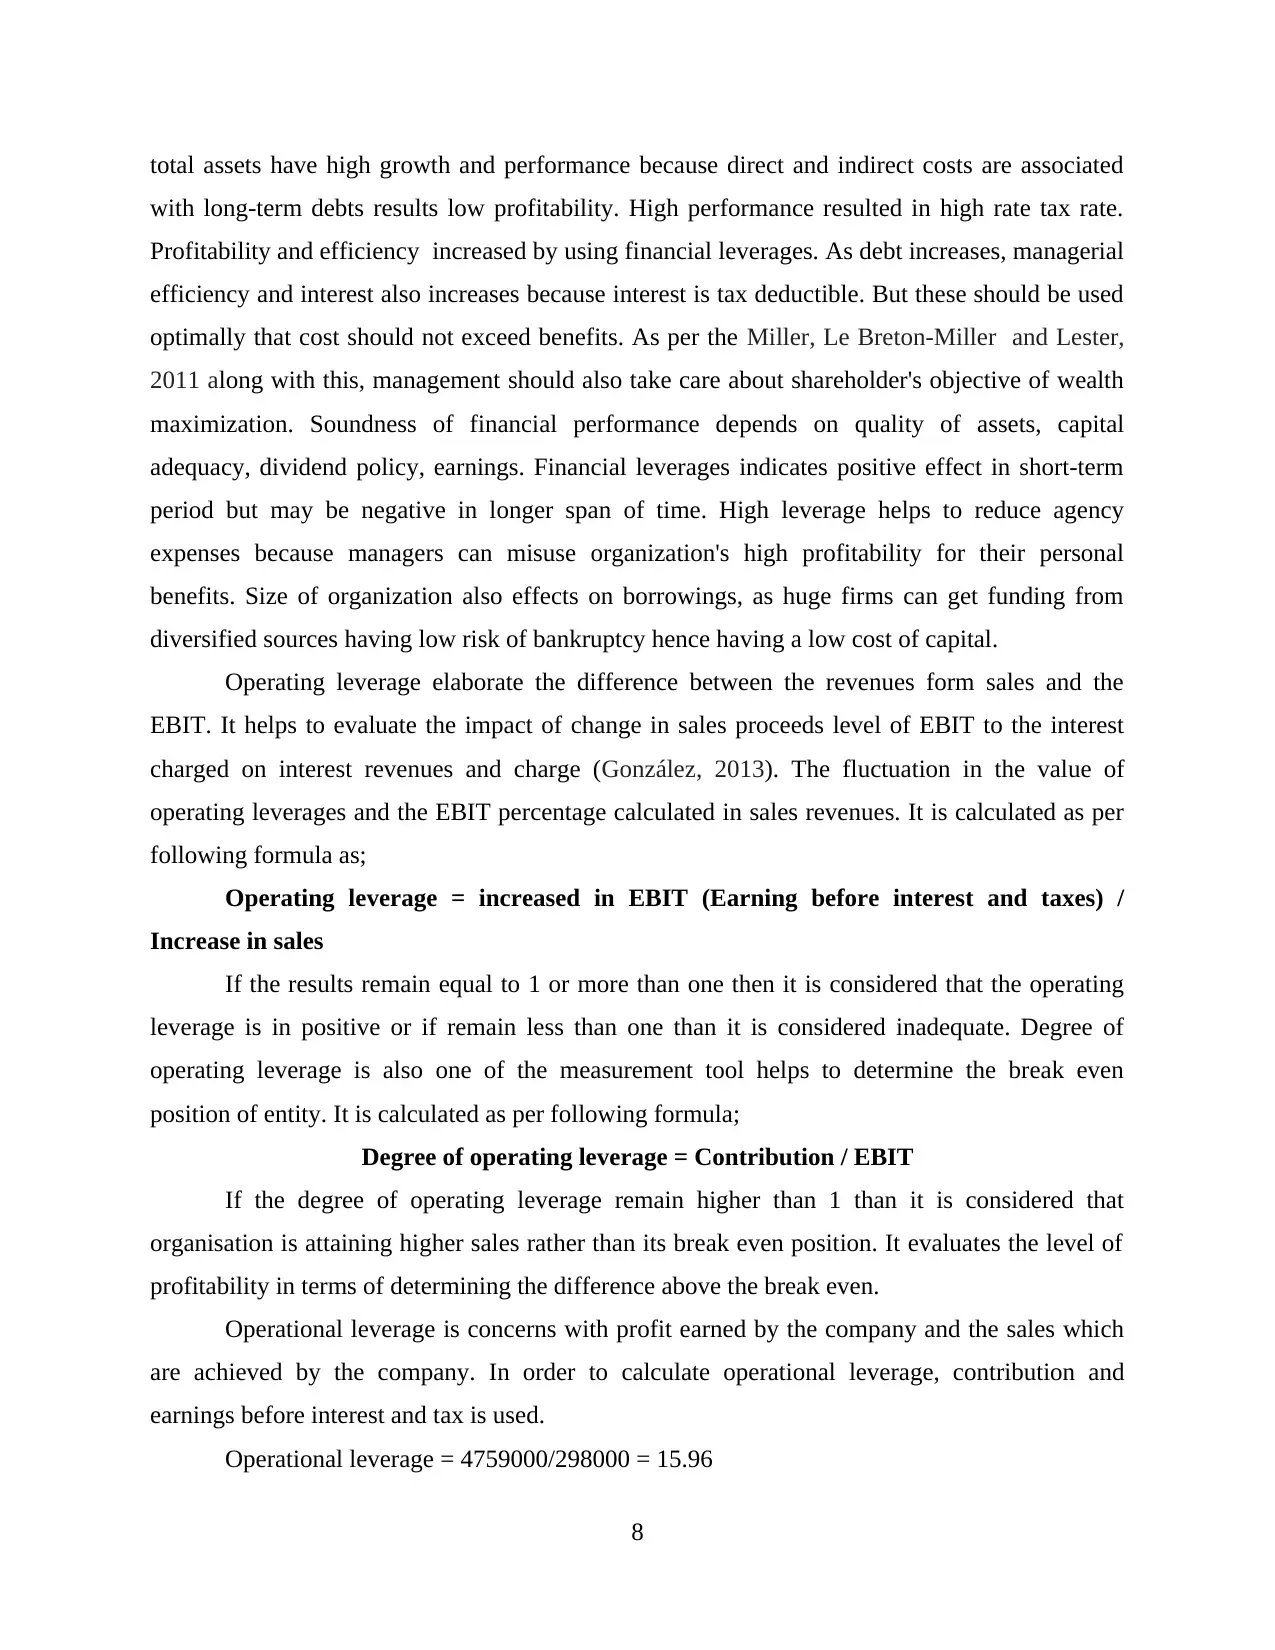
Operating leverage elaborate the difference between the revenues form sales and the
EBIT. It helps to evaluate the impact of change in sales proceeds level of EBIT to the interest
charged on interest revenues and charge (González, 2013). The fluctuation in the value of
operating leverages and the EBIT percentage calculated in sales revenues. It is calculated as per
following formula as;
Operating leverage = increased in EBIT (Earning before interest and taxes) /
Increase in sales
If the results remain equal to 1 or more than one then it is considered that the operating
leverage is in positive or if remain less than one than it is considered inadequate. Degree of
operating leverage is also one of the measurement tool helps to determine the break even
position of entity. It is calculated as per following formula;
Degree of operating leverage = Contribution / EBIT
If the degree of operating leverage remain higher than 1 than it is considered that
organisation is attaining higher sales rather than its break even position. It evaluates the level of
profitability in terms of determining the difference above the break even.
Operational leverage is concerns with profit earned by the company and the sales which
are achieved by the company. In order to calculate operational leverage, contribution and
earnings before interest and tax is used.
Operational leverage = 4759000/298000 = 15.96
8
with long-term debts results low profitability. High performance resulted in high rate tax rate.
Profitability and efficiency increased by using financial leverages. As debt increases, managerial
efficiency and interest also increases because interest is tax deductible. But these should be used
optimally that cost should not exceed benefits. As per the Miller, Le Breton‐Miller and Lester,
2011 along with this, management should also take care about shareholder's objective of wealth
maximization. Soundness of financial performance depends on quality of assets, capital
adequacy, dividend policy, earnings. Financial leverages indicates positive effect in short-term
period but may be negative in longer span of time. High leverage helps to reduce agency
expenses because managers can misuse organization's high profitability for their personal
benefits. Size of organization also effects on borrowings, as huge firms can get funding from
diversified sources having low risk of bankruptcy hence having a low cost of capital.
Operating leverage elaborate the difference between the revenues form sales and the
EBIT. It helps to evaluate the impact of change in sales proceeds level of EBIT to the interest
charged on interest revenues and charge (González, 2013). The fluctuation in the value of
operating leverages and the EBIT percentage calculated in sales revenues. It is calculated as per
following formula as;
Operating leverage = increased in EBIT (Earning before interest and taxes) /
Increase in sales
If the results remain equal to 1 or more than one then it is considered that the operating
leverage is in positive or if remain less than one than it is considered inadequate. Degree of
operating leverage is also one of the measurement tool helps to determine the break even
position of entity. It is calculated as per following formula;
Degree of operating leverage = Contribution / EBIT
If the degree of operating leverage remain higher than 1 than it is considered that
organisation is attaining higher sales rather than its break even position. It evaluates the level of
profitability in terms of determining the difference above the break even.
Operational leverage is concerns with profit earned by the company and the sales which
are achieved by the company. In order to calculate operational leverage, contribution and
earnings before interest and tax is used.
Operational leverage = 4759000/298000 = 15.96
8
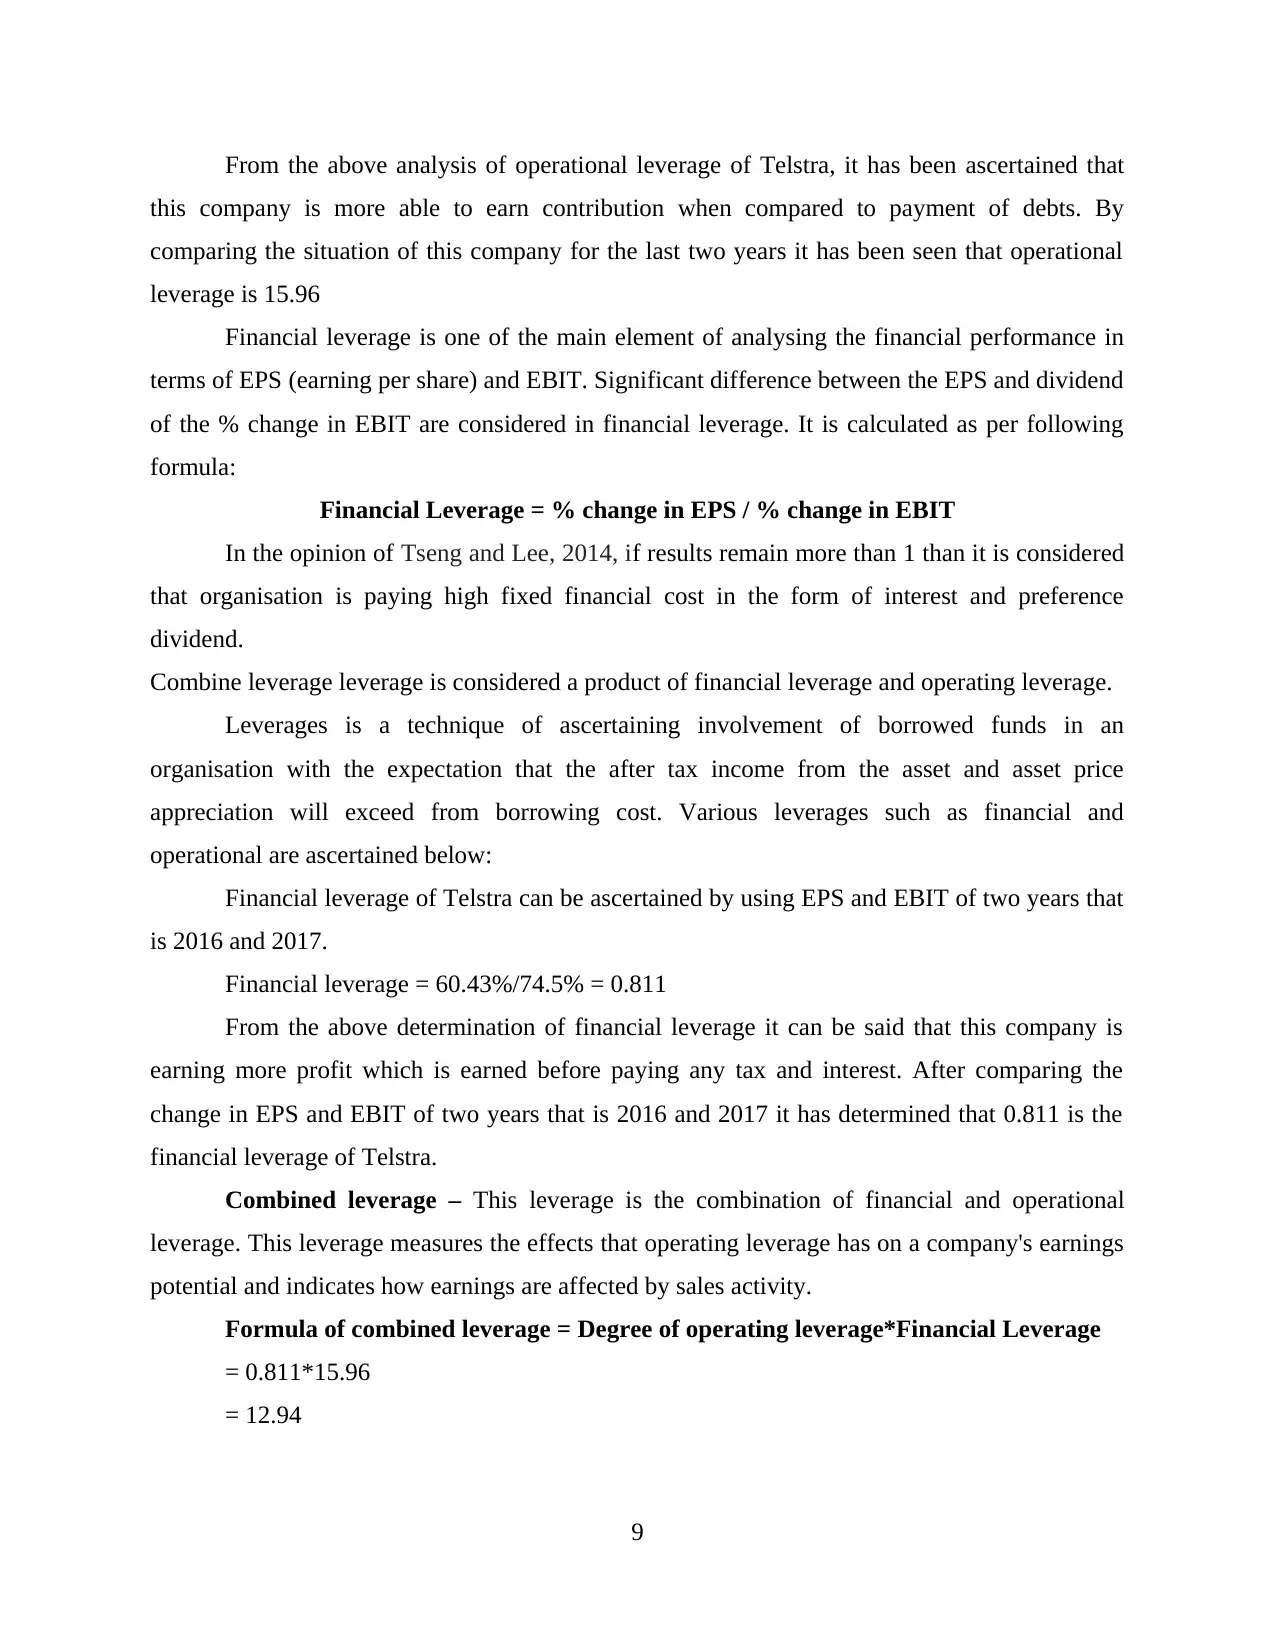
From the above analysis of operational leverage of Telstra, it has been ascertained that
this company is more able to earn contribution when compared to payment of debts. By
comparing the situation of this company for the last two years it has been seen that operational
leverage is 15.96
Financial leverage is one of the main element of analysing the financial performance in
terms of EPS (earning per share) and EBIT. Significant difference between the EPS and dividend
of the % change in EBIT are considered in financial leverage. It is calculated as per following
formula:
Financial Leverage = % change in EPS / % change in EBIT
In the opinion of Tseng and Lee, 2014, if results remain more than 1 than it is considered
that organisation is paying high fixed financial cost in the form of interest and preference
dividend.
Combine leverage leverage is considered a product of financial leverage and operating leverage.
Leverages is a technique of ascertaining involvement of borrowed funds in an
organisation with the expectation that the after tax income from the asset and asset price
appreciation will exceed from borrowing cost. Various leverages such as financial and
operational are ascertained below:
Financial leverage of Telstra can be ascertained by using EPS and EBIT of two years that
is 2016 and 2017.
Financial leverage = 60.43%/74.5% = 0.811
From the above determination of financial leverage it can be said that this company is
earning more profit which is earned before paying any tax and interest. After comparing the
change in EPS and EBIT of two years that is 2016 and 2017 it has determined that 0.811 is the
financial leverage of Telstra.
Combined leverage – This leverage is the combination of financial and operational
leverage. This leverage measures the effects that operating leverage has on a company's earnings
potential and indicates how earnings are affected by sales activity.
Formula of combined leverage = Degree of operating leverage*Financial Leverage
= 0.811*15.96
= 12.94
9
⊘ This is a preview!⊘
Do you want full access?
Subscribe today to unlock all pages.
Trusted by 1+ million students worldwide
1 out of 16
Related Documents


Your All-in-One AI-Powered Toolkit for Academic Success.
+13062052269
info@desklib.com
Available 24*7 on WhatsApp / Email
![[object Object]](/_next/static/media/star-bottom.7253800d.svg)
Unlock your academic potential
Copyright © 2020–2026 A2Z Services. All Rights Reserved. Developed and managed by ZUCOL.