Comprehensive Financial Analysis of Telstra's 2018 Annual Report
VerifiedAdded on 2022/10/10
|8
|1968
|487
Report
AI Summary
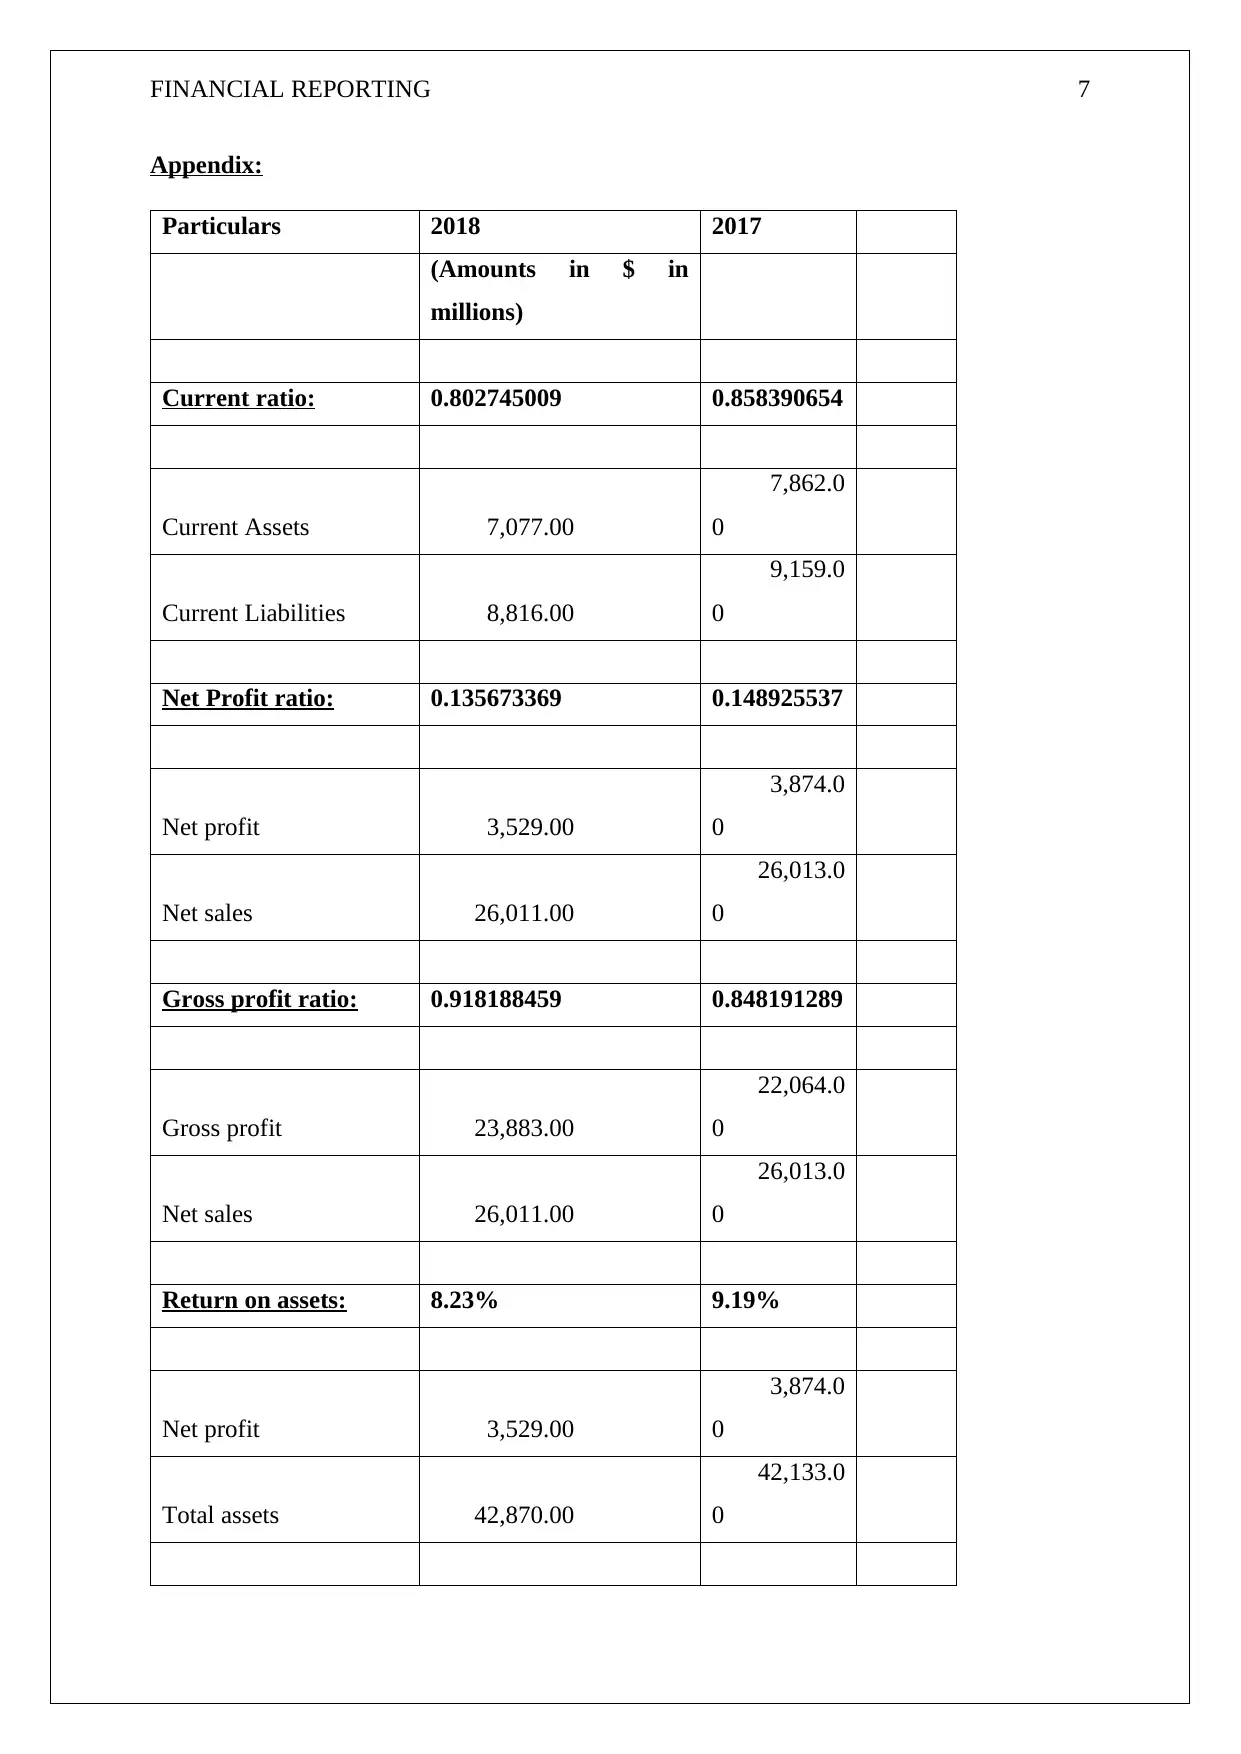
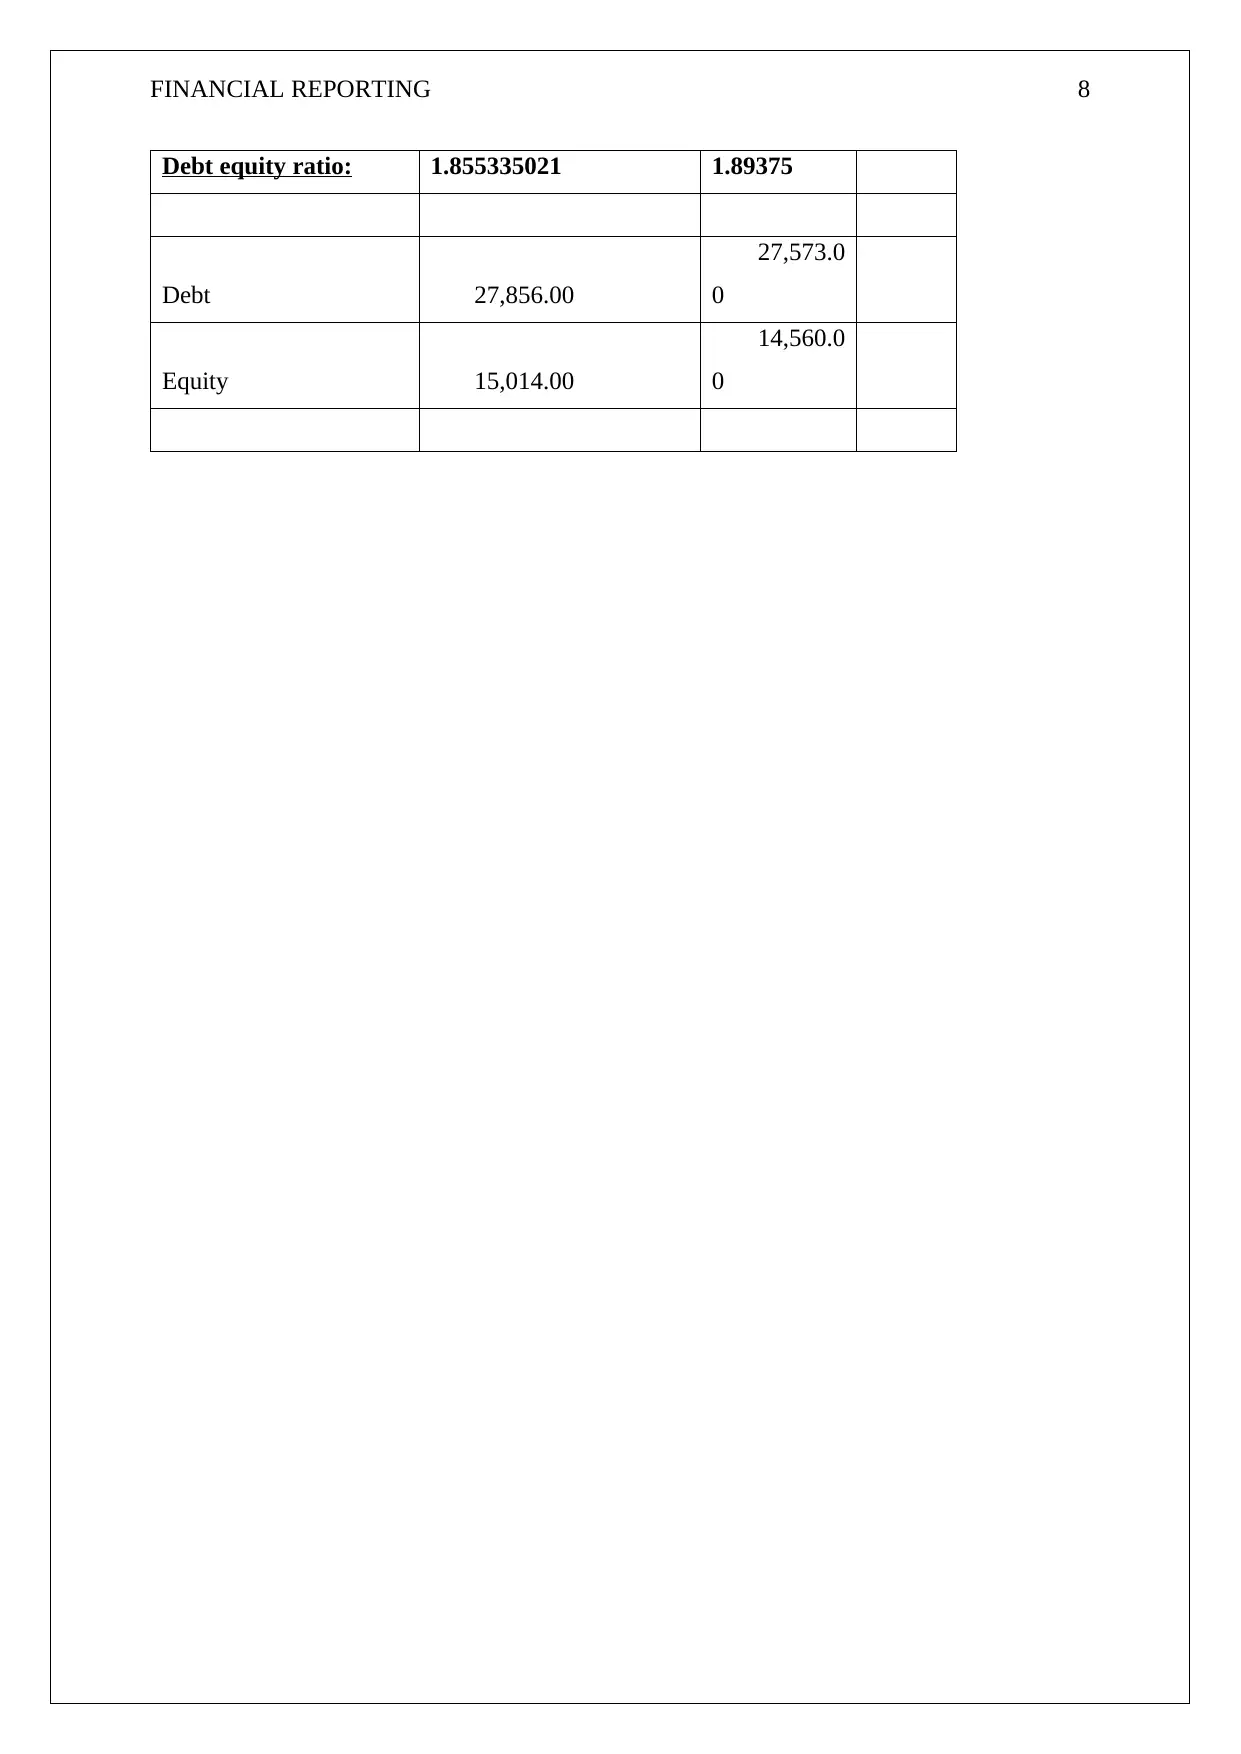
This report provides a detailed analysis of Telstra's 2018 financial performance based on the provided annual report excerpt. The analysis includes a review of key financial ratios such as current ratio, net profit ratio, gross profit ratio, return on assets, and debt-equity ratio, highlighting their trends and implications. The report also examines Telstra's sustainability reporting, focusing on its environmental and social initiatives, including digital literacy programs, emissions reduction, mobile coverage, and community investments. Furthermore, the report discusses improvements in areas like dividend payments, labor expenses, and goods and services costs, while also acknowledging areas of concern such as the decrease in net profit. The analysis emphasizes the importance of audit opinions and earnings per share for investors. The sustainability section details Telstra's achievements in environmental solutions, community engagement, and ethical governance, providing a comprehensive overview of the company's performance and its commitment to various stakeholders. The report is a valuable resource for understanding Telstra's financial and sustainability strategies during the year 2018.

FINANCIAL REPORTING 1
FINANCIAL
REPORTING
FINANCIAL
REPORTING
Paraphrase This Document
Need a fresh take? Get an instant paraphrase of this document with our AI Paraphraser

FINANCIAL REPORTING 2
Financial reporting:
Current ratio:
This is the ratio which is expressed between the current assets and the current liabilities of the
company. It indicates the ability of the company to meet its short term obligations ("Current
Ratio Formula - Examples, How to Calculate Current Ratio", 2019).
The current ratio of the company has deteriorated when compared with the previous year.
The reduction is mainly due to the fall in the current assets and the current liabilities.
Net profit ratio:
This is the ratio which is expressed between the amount of the net profit earned by the
company and the net sales of the company. It indicates the degree of profitability achieved by
the company during the year.
The net profit ratio of the company has deteriorated when compared with the previous year.
The reduction is mainly due to the fall in the net sales and the net profit (Bragg & Bragg,
2019).
Gross profit ratio:
This is the ratio which is expressed between the amount of the gross profit earned by the
company and the net sales of the company. It indicates the degree of profitability achieved by
the company during the year ("Gross Profit Ratio (GP Ratio) - Formula, Explanation,
Example and Interpretation | Accounting for Management", 2019).
The gross profit ratio of the company has improved when compared with the previous year.
The reduction is mainly due to the fall in the amount of net sales and the increase of gross
profit.
Return on assets ratio:
This is the ratio which is expressed between the total amount of the assets of the company
and the total net profit earned by the company during the year. It shows the efficiency with
which the total assets of the company re being employed so as to give the profits ("Return on
assets ratio", 2019).
This ratio of the company has deteriorated when compared with the previous year. The
reduction is mainly due to the fall in the net profit and the rise in the amount of total assets.

FINANCIAL REPORTING 3
Debt equity ratio:
This is the ratio which is expressed between the debt and the equity of the company. It
indicates the amount of the debt or the equity employed into the business ("Debt to Equity
Ratio - How to Calculate Leverage, Formula, Examples", 2019).
The debt equity ratio of the company has deteriorated when compared with the previous year.
The reduction is mainly due to the fall in the debt and the equity amounts, but the fall is not
in the same amount.
The above ratios shows that the position of the company has deteriorated over the year. And
this means that the company needs to work hard towards the improving the financial position
of the company. The following shows the improvements that have taken place in the
company when compared with the previous year of 2017:
The year of 2018 marks an improvement in the amount of the dividend which has been paid
by the company. The company has paid 11 cents on each ordinary share which consist of 7.5
cents and the special dividend to the tune of 3.5 cents. The shares of the company are being
traded which excludes the entitlement to the amount of the dividend from Aug to Sep, 2018.
This means that the total amount of the dividend for the company during the year of 2018 is
about 22 cents which includes 15 cents in the ordinary shares and 7 cents as social dividend.
This means that the year 2018 marked the payment of the 78% of the total amount of the
underlying earnings.
With regard to the improvement in the labour, the company has successfully decreased its
expenses by about 4.2% or an amount to $224 million to about $5157 million. The company
has successful reduced its redundancy costs by about 47.9% or to an amount of $150 million
which the result of the decrease is restructuring costs that were incurred during the previous
year of 2017. The labour substitution costs reduced by 6.1% or to the amount of $59 million
and this was mainly due to the reduction in the amount of labour outsourcing. The company
also went on to reduce its salaries along with the associated costs which were reduced by the
amount of $9 million or about 2%. This took place due to the decrease in the number of
employees that were off shore. There was no reduction in the total full times staff and its
equivalents. There was an increase in the number domestic which was set off by the decrease
in the number of the off shore employees.
⊘ This is a preview!⊘
Do you want full access?
Subscribe today to unlock all pages.

Trusted by 1+ million students worldwide

FINANCIAL REPORTING 4
In terms of the goods and the services that were purchased, the total goods and the services
purchased increased by 14.2% or by the number of $1087 million to the $8758 million. The
cost of the goods that were sold include the mobile handsets, cellular Wi-Fi. The costs of the
company increased due to the expensive handsets that were sold while the fixed costs
pertaining with the hardware increased due to the use of the smarter modems.
With regard to the payments with regard to the networks, the costs increase by about 34% or
an amount of $575 million to $2267 million and includes an amount of $494 million
pertaining with the access payments since the customer migrated with the nbn services. The
costs pertaining with the goods and the services increased by 9.2% or the amount of $248
million which was mainly due to the increase in the service fees of an amount of $192
million.
With regard to the expenses, the total amount of the expenses, these were increased by 10.6%
or an amount of $478 million to $4984 million. For the impairment expenses, these were
reduced by an amount of $262 million and this was due to the charge of impairment for the
Ooyala Holdings Group and the other expenses were increased by about 14.9% or with an
amount of $357 million.
For the purposes of making an investment into the company, any investor would want to
know the audit opinion on the financial of the company since that would show the credibility
of the facts contained in the financial statements. Further, the earning per share of the
company have to be kept in mind so that it attracts the investors to invest into the company.
There has been a decrease in the amount f the net profit.
Sustainability reporting:
With regard to the sustainability reporting of the company undertaken for review, the
following are the highlights for it during the year:
With regard to reaching the population of the country in which it operates, it has
reached to about 48000 people through its digital literacy programs
It has successfully reached to the reduction of the emissions intensity by about 24%
The company has successfully helped about 1 million customers and they still remain
with the company
The company has successfully extended its mobile coverage services to about 99.5%
of the entire population of the country
Paraphrase This Document
Need a fresh take? Get an instant paraphrase of this document with our AI Paraphraser

FINANCIAL REPORTING 5
The company has been recognised on the CDP 2017 list of A category
The company has collected an amount of 3871 tonnes of e waste and it has recycled it
to the tune of 99.9%
The company has achieved the employee sustainable engagement to the score of 74.
During the year, the company was also named as the Employer of choice for gender
equality and the recognition was given by the Australian Government Workplace
Gender Equality Agency.
The company provides about 130 million value through the way of social and
community investment programs ("Sustainable reporting", 2019).
With regard to the environmental solutions, the company uses its technology to challenge the
changes that are taking place in the environment and this would help in the better of the
relationship between the company and its suppliers, customers and the communities. The
company has undertaken many more initiatives for the purposes of maintaining string
strategic pillars. There is a high level of information which is adhered to and which is used
for the purposes of achieving and laying down the targets which have to be fulfilled by the
company. The board of the company is very much responsible for the purposes of overseeing,
monitoring the effectiveness of the strategies and the policies of the company. It is the board
of the company that regularly receives the updates on the progress on the sustainability of the
company and this is done twice in each year.
The board is responsible for the overseeing of the implementation of the sustainability
strategies and they closely work together towards achieving the targets and also towards the
performance indicators. The company has also undertaken many initiatives towards the group
code of conduct and towards ensuring a diversity and the inclusion, health and safety,
privacy, human rights, environment and the disability services policies. The supplier code of
conduct sets out the expectations of the various business partners and of the suppliers.
From the above initiatives, it could be stated that the company is going in the right direction
when it comes to the achievement of the various goals. This means that the company has
been improving year by year and it is going in the right direction which shows that the
company is careful about it does for the society and the community and this shows the sense
of responsibility in the minds of the company.

FINANCIAL REPORTING 6
References:
Annual report 2018. (2019). Retrieved 12 September 2019, from
https://www.telstra.com.au/content/dam/tcom/about-us/investors/pdf%20F/2018-
Annual-Report-singlepages.pdf
Bragg, S., & Bragg, S. (2019). Net profit ratio — AccountingTools. Retrieved 12 September
2019, from https://www.accountingtools.com/articles/2017/5/5/net-profit-ratio
Current Ratio Formula - Examples, How to Calculate Current Ratio. (2019). Retrieved 12
September 2019, from
https://corporatefinanceinstitute.com/resources/knowledge/finance/current-ratio-formula/
Debt to Equity Ratio - How to Calculate Leverage, Formula, Examples. (2019). Retrieved 12
September 2019, from
https://corporatefinanceinstitute.com/resources/knowledge/finance/debt-to-equity-ratio-
formula/
Gross Profit Ratio (GP Ratio) - Formula, Explanation, Example and Interpretation |
Accounting for Management. (2019). Retrieved 12 September 2019, from
https://www.accountingformanagement.org/gross-profit-ratio/
Return on assets ratio. (2019). Retrieved 12 September 2019, from https://bizfluent.com/info-
12036358-net-assets-total-assets-ratio.html
Sustainable reporting. (2019). Retrieved 12 September 2019, from
https://www.telstraglobal.com/images/assets/articles/Bigger-Picture-2017-Sustainability-
Report.pdf
⊘ This is a preview!⊘
Do you want full access?
Subscribe today to unlock all pages.

Trusted by 1+ million students worldwide

FINANCIAL REPORTING 7
Appendix:
Particulars 2018 2017
(Amounts in $ in
millions)
Current ratio: 0.802745009 0.858390654
Current Assets 7,077.00
7,862.0
0
Current Liabilities 8,816.00
9,159.0
0
Net Profit ratio: 0.135673369 0.148925537
Net profit 3,529.00
3,874.0
0
Net sales 26,011.00
26,013.0
0
Gross profit ratio: 0.918188459 0.848191289
Gross profit 23,883.00
22,064.0
0
Net sales 26,011.00
26,013.0
0
Return on assets: 8.23% 9.19%
Net profit 3,529.00
3,874.0
0
Total assets 42,870.00
42,133.0
0
Paraphrase This Document
Need a fresh take? Get an instant paraphrase of this document with our AI Paraphraser

FINANCIAL REPORTING 8
Debt equity ratio: 1.855335021 1.89375
Debt 27,856.00
27,573.0
0
Equity 15,014.00
14,560.0
0
Debt equity ratio: 1.855335021 1.89375
Debt 27,856.00
27,573.0
0
Equity 15,014.00
14,560.0
0
1 out of 8
Related Documents

Your All-in-One AI-Powered Toolkit for Academic Success.
+13062052269
info@desklib.com
Available 24*7 on WhatsApp / Email
Unlock your academic potential
Copyright © 2020–2025 A2Z Services. All Rights Reserved. Developed and managed by ZUCOL.