Comparative Financial Performance: Telstra vs. Queste Communications
VerifiedAdded on 2020/05/28
|23
|3643
|333
AI Summary
The document provides an extensive analysis comparing the financial performances of Telstra and Queste Communications using a variety of financial ratios. Key aspects such as profitability, efficiency, liquidity, and capital structures are examined. The analyses highlight that despite certain negative cash flows in specific years, Telstra has shown overall better performance compared to Queste. This is evidenced through its superior profit margins, efficient use of assets, effective debt management, and robust liquidity positions. The study underscores Telstra's ability to generate profits more effectively than Queste Communications.
ACCOUNTING AND FINANCE 1
Executive summary
Telstra Corporation Ltd. is a telecommunication company in Australia. This report is all
about the overall financial analysis of the company, comparing with Queste Communications
Ltd, another company in telecom sector which is listed on Australian Securities Exchange
(About Us. 2018). It includes the financial statements and ratio analysis from year 2013 to
2017.
First part of the report deals with the horizontal and vertical analysis of Telstra’s income
statement, balance sheet and cash flow statement. It shows the percentage change of each of
the item mentioned in the statements. Some variations can be seen in the sales and net profit
made by the company. Telstra’s liabilities, assets and equities, all has increased with some
proportion during the period of five years. The analysis of cash flow statement has also
reported negative cash flows over the period.
The second part deals with the ratio analysis of the company which includes calculation of
profitability, efficiency, liquidity and capital structure ratios compared with Queste
communication Ltd. Telstra’s profitability and efficiency is much better than Queste. The
profits of Queste are in negative values whereas Telstra’s profits are positive, though
declining. Looking at the liquidity ratio, it can be said that Queste is much more liquid than
Telstra. Debt to equity ratio indicates that the liabilities of Telstra are comparatively more
than Queste in proportion to its total equities. Equity ratio of Queste is more than Telstra
where as its Debt ratio is lower than it.
The third part has conclusion which includes the overall findings of the analysis done. It
states that although the net profit of the former company is reducing but it is performing
much better than the latter company in terms of profitability and efficiency.
Paraphrase This Document
Need a fresh take? Get an instant paraphrase of this document with our AI Paraphraser
ACCOUNTING AND FINANCE 2
Contents
Introduction...........................................................................................................................................3
Income statement...................................................................................................................................3
Balance sheet.........................................................................................................................................5
Cash Flow Statement.............................................................................................................................7
Financial Ratio Analysis........................................................................................................................8
Profitability ratios..............................................................................................................................8
Efficiency ratios.................................................................................................................................9
Liquidity ratios................................................................................................................................10
Capital structure ratio......................................................................................................................12
Conclusion...........................................................................................................................................12
References...........................................................................................................................................13
Appendix.............................................................................................................................................15
ACCOUNTING AND FINANCE 3
Introduction
Telstra Corporation Limited is a leading telecommunications and technology company
operating in Australia. The company builds telecommunication networks and provide product
and services like mobile, internet access, pay television and many other. It provides 17.4
million mobile services, 6.8 million fixed voice services and 3.5 million retail fixed
broadband services.
The vision and mission of the company is to connect more and more people and to provide
them more opportunities. For this, the company build simple and easy to use technology and
content solutions, making it the largest national mobile network of Australia ("Telstra",
2018).
Telstra was previously originated with the Australia Post as a government department but
now it is fully privatized. The CEO of the company is now focusing to make the company
more consumer focused by undergoing a change program. In August 2011, Telstra announces
to expand its customer services to social media having 24/7 coverage. By the end of
November 2012, the company enjoys the increase in its live chats and the growth rate of this
service has also increased to a great extent ("Telstra", 2018).
As of 2016, the company owns about 360 retail stores and more than 300 stores are equipped
with low energy Bluetooth beacons. After the privatization, the shares of Telstra has risen to
$5 per share in December 2013 to $6 per share in December 2014. The company is listed on
Australian Stock Exchange (ASX) and traded as ASX: TLS. The company is looking forward
to extend its growth in the international markets under the new CEO Andy Penn ("Telstra -
Investors", 2018).
Income statement
The income statement also known as statement of performance, is prepared to measure the
amount of profit created by the company. It also provides users with an idea about the
profitability of a concern (Buckland & Davis, 2016). Profit and loss is basically the difference
between the total income and total expense. If the difference is positive, it is profit and if it is
negative, there is a loss. A financial profit shows an increase in the owner’s equity and a loss
shows a decrease in the same. Income means earning benefits through reduction in liabilities
or inflow of assets (Hussey, 2011).
⊘ This is a preview!⊘
Do you want full access?
Subscribe today to unlock all pages.
Trusted by 1+ million students worldwide
ACCOUNTING AND FINANCE 4
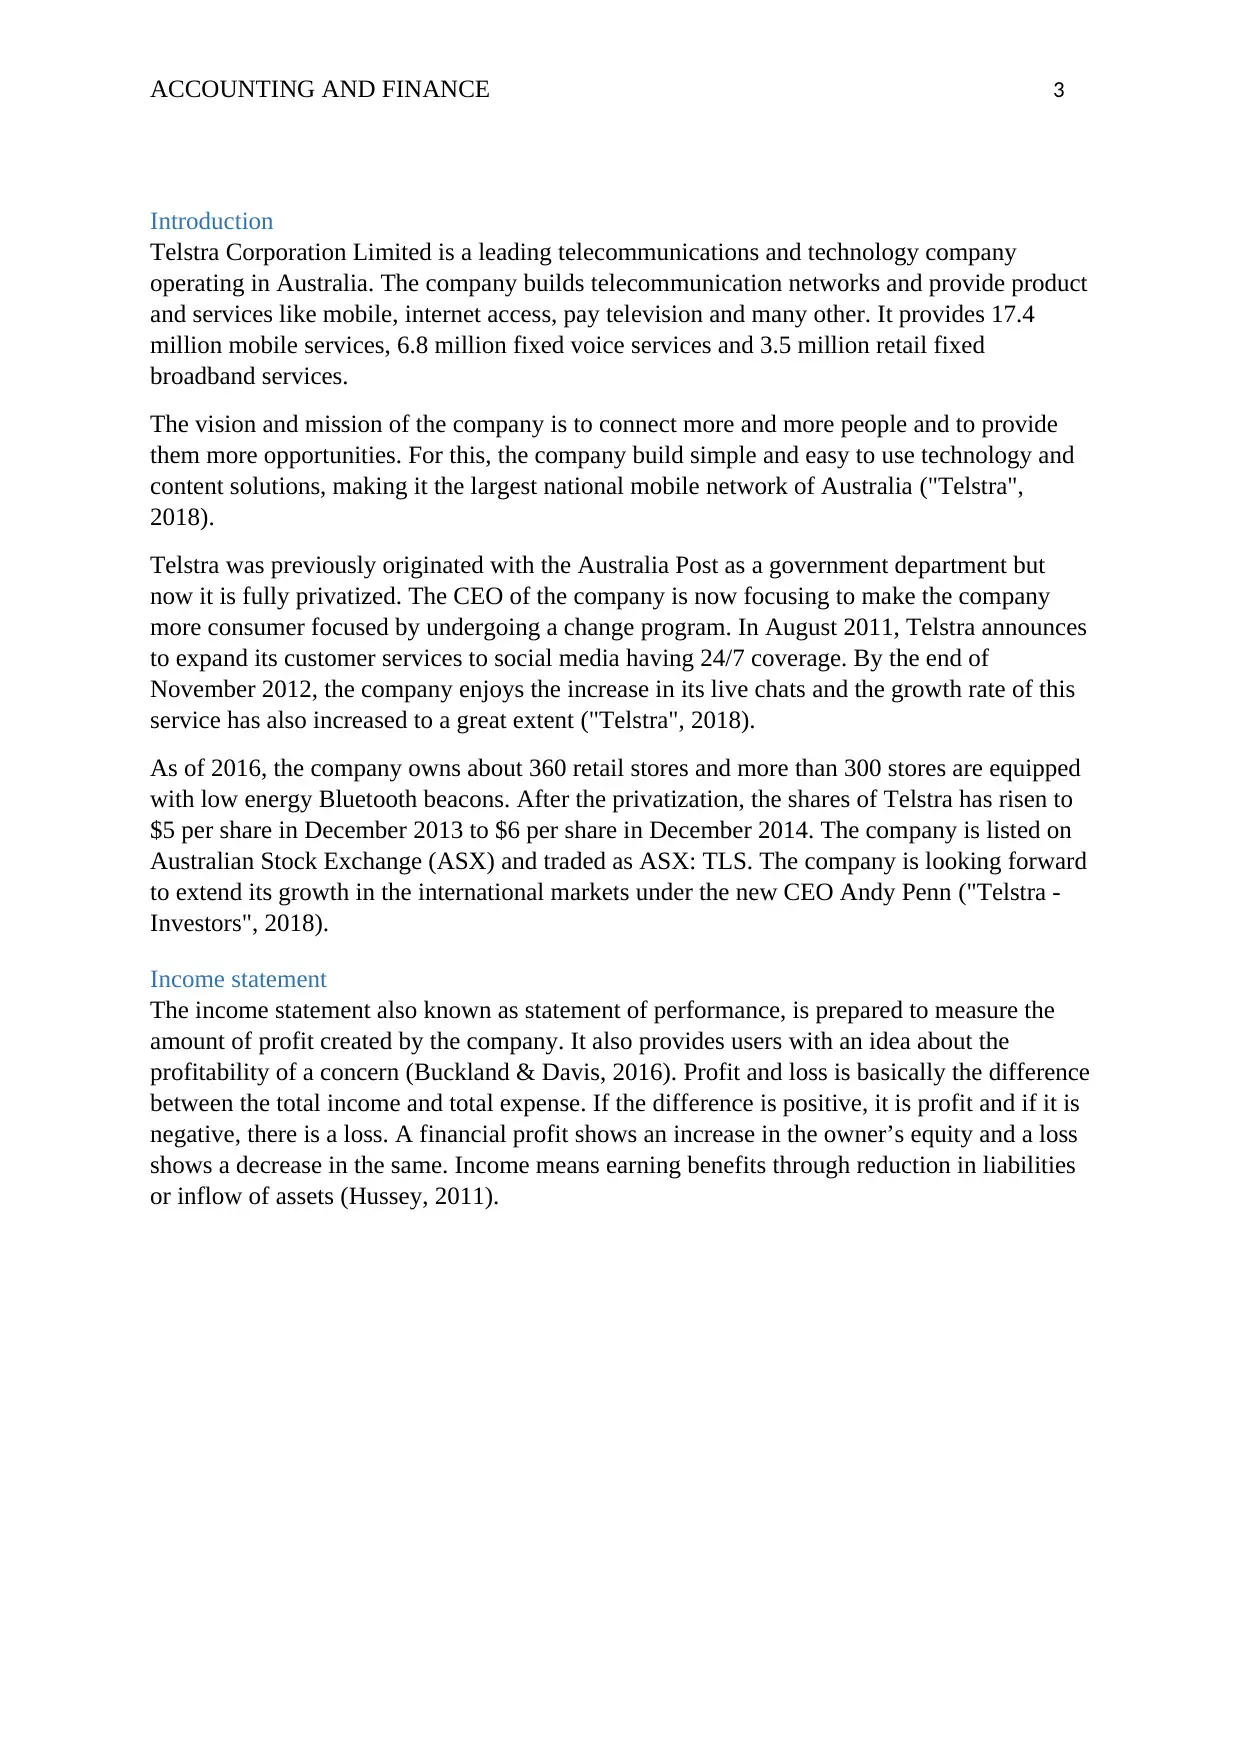
Figure 1: Total net income or loss for the year ending 2013-2017
1 2 3 4 5
3,400
3,600
3,800
4,000
4,200
4,400
4,600
4,800
Net income/loss For Financial Year Ending
2013-2017
Years
AUD$ (Million)
The summary of income statement (Appendix 1.1) shows the data of Telstra Corporation for
the financial year starting from 2013 to 2017. During the first two years, it can be seen that
the profit has increased by $684 million. In financial year 2015, the trend reversed and profit
started decreased by $263 and continues to decline by approx. 17% in FY 2016 and 2017, as
compare to the percentage change in FY 2014. The maximum profit earned was in FY 2014,
$4,549 (Figure 1).
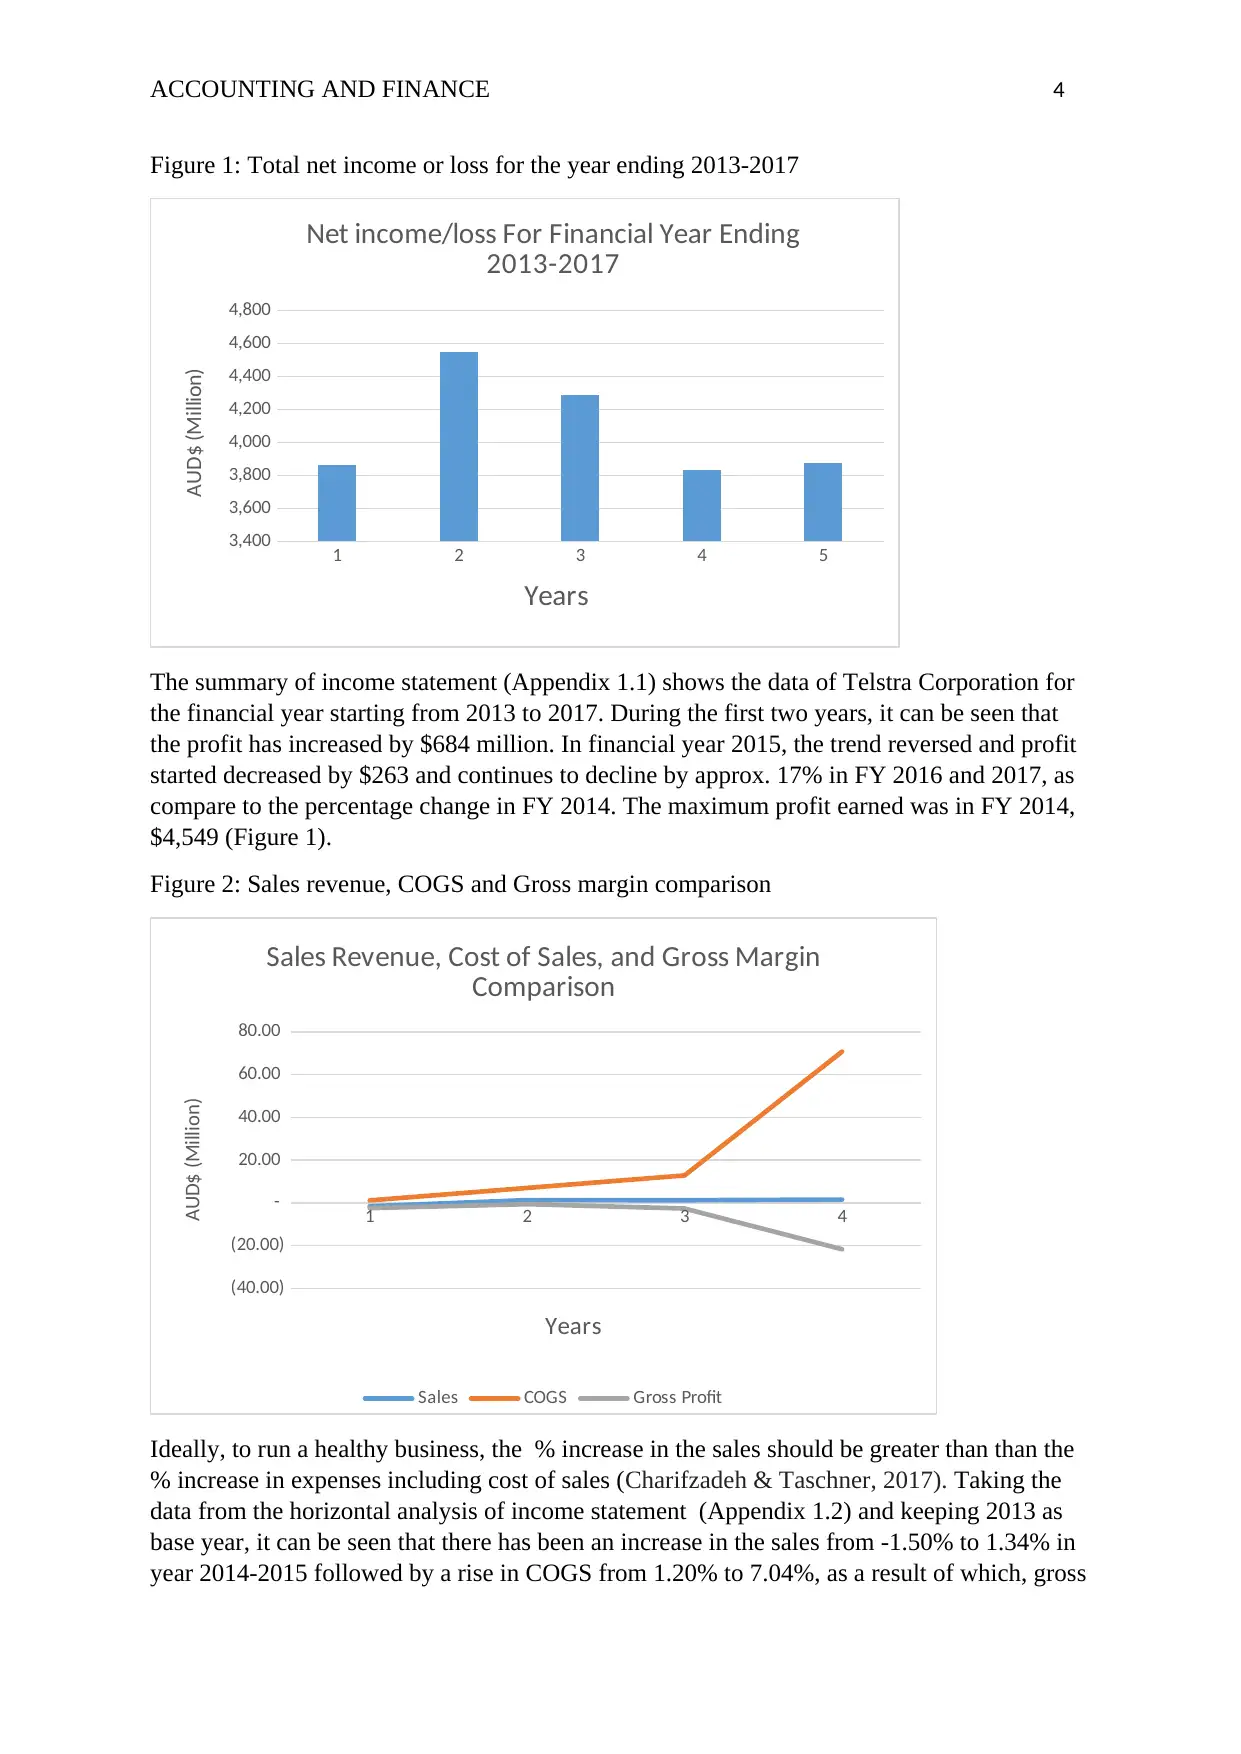
Figure 2: Sales revenue, COGS and Gross margin comparison
1 2 3 4
(40.00)
(20.00)
-
20.00
40.00
60.00
80.00
Sales Revenue, Cost of Sales, and Gross Margin
Comparison
Sales COGS Gross Profit
Years
AUD$ (Million)
Ideally, to run a healthy business, the % increase in the sales should be greater than than the
% increase in expenses including cost of sales (Charifzadeh & Taschner, 2017). Taking the
data from the horizontal analysis of income statement (Appendix 1.2) and keeping 2013 as
base year, it can be seen that there has been an increase in the sales from -1.50% to 1.34% in
year 2014-2015 followed by a rise in COGS from 1.20% to 7.04%, as a result of which, gross
Figure 1: Total net income or loss for the year ending 2013-2017
1 2 3 4 5
3,400
3,600
3,800
4,000
4,200
4,400
4,600
4,800
Net income/loss For Financial Year Ending
2013-2017
Years
AUD$ (Million)
The summary of income statement (Appendix 1.1) shows the data of Telstra Corporation for
the financial year starting from 2013 to 2017. During the first two years, it can be seen that
the profit has increased by $684 million. In financial year 2015, the trend reversed and profit
started decreased by $263 and continues to decline by approx. 17% in FY 2016 and 2017, as
compare to the percentage change in FY 2014. The maximum profit earned was in FY 2014,
$4,549 (Figure 1).
Figure 2: Sales revenue, COGS and Gross margin comparison
1 2 3 4
(40.00)
(20.00)
-
20.00
40.00
60.00
80.00
Sales Revenue, Cost of Sales, and Gross Margin
Comparison
Sales COGS Gross Profit
Years
AUD$ (Million)
Ideally, to run a healthy business, the % increase in the sales should be greater than than the
% increase in expenses including cost of sales (Charifzadeh & Taschner, 2017). Taking the
data from the horizontal analysis of income statement (Appendix 1.2) and keeping 2013 as
base year, it can be seen that there has been an increase in the sales from -1.50% to 1.34% in
year 2014-2015 followed by a rise in COGS from 1.20% to 7.04%, as a result of which, gross
Paraphrase This Document
Need a fresh take? Get an instant paraphrase of this document with our AI Paraphraser
ACCOUNTING AND FINANCE 5
profit has declined $18,975 in FY2015 as compare to that of $19.084 in 2013. The same trend
continues in the subsequent years and profit tends to declines.
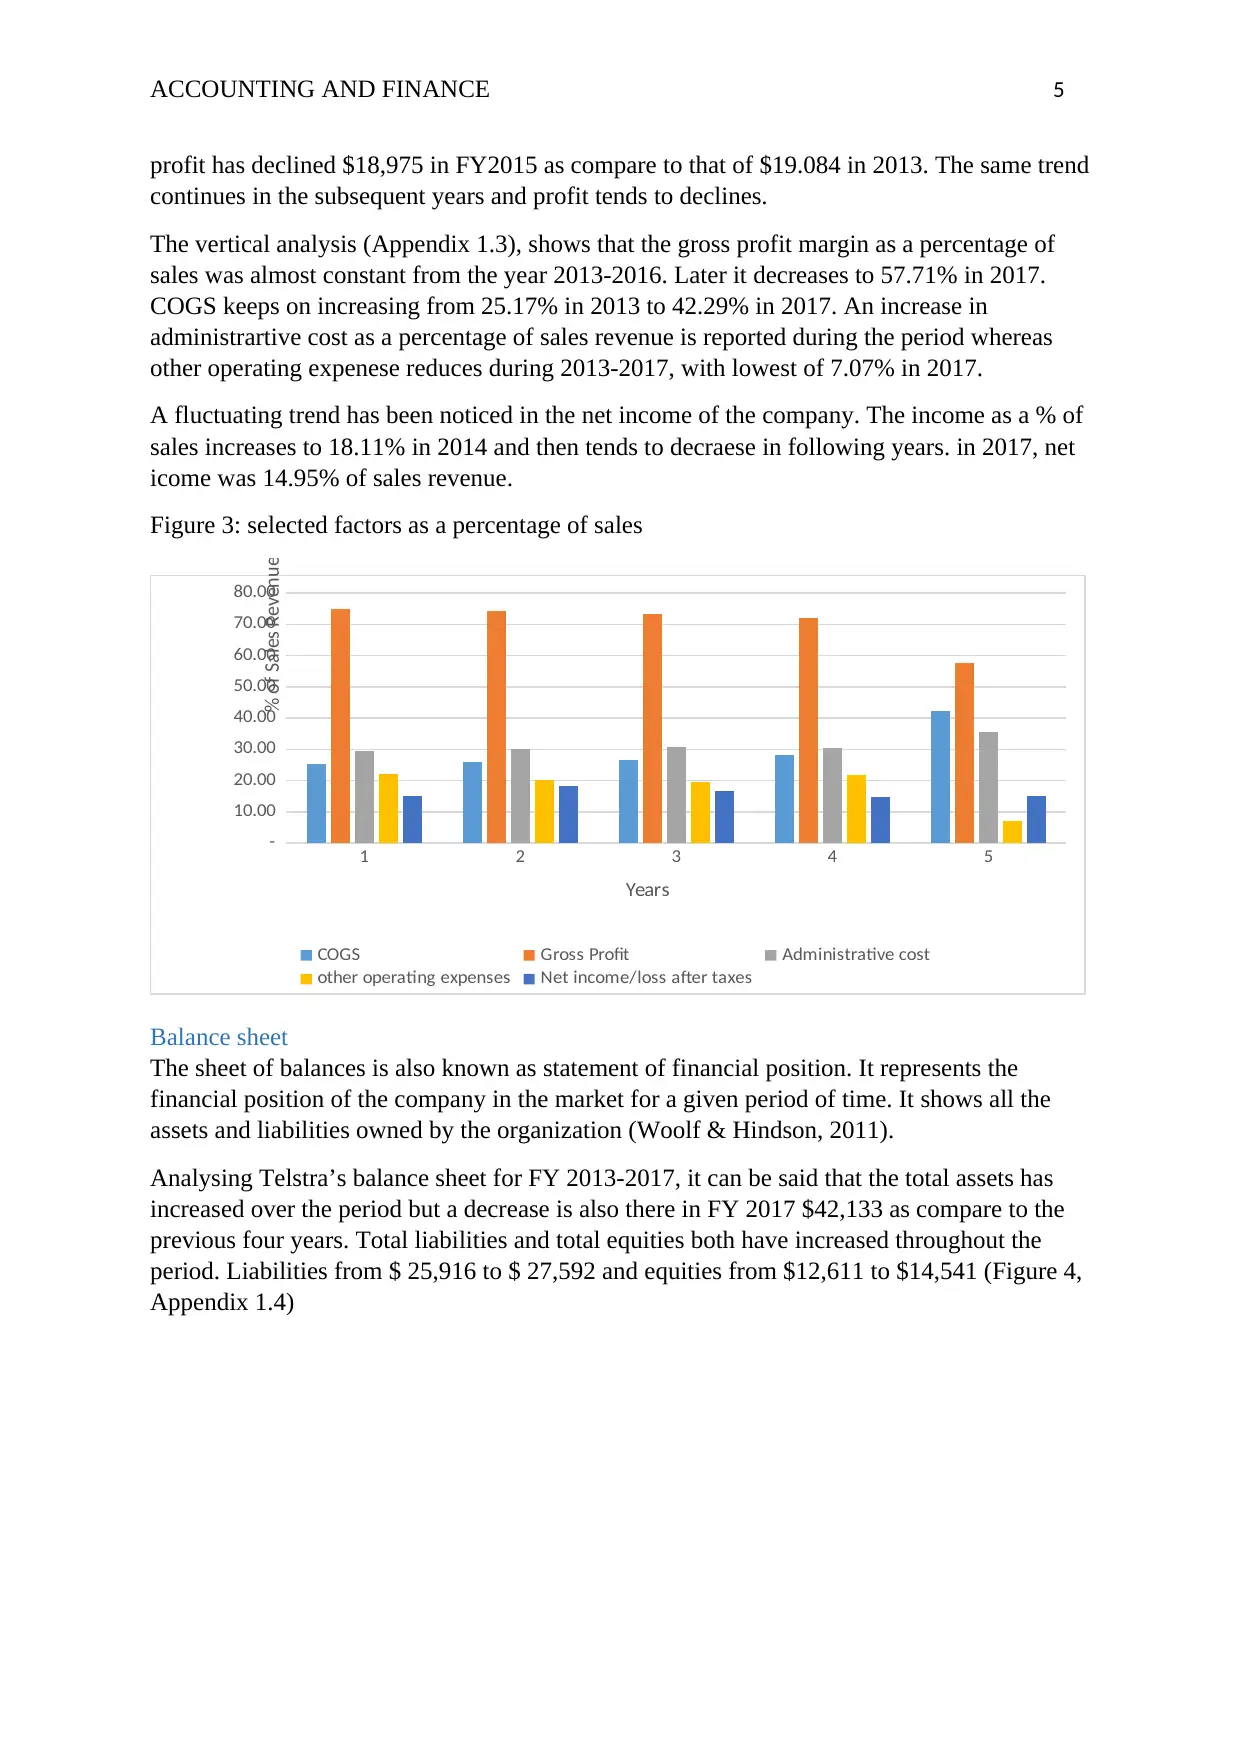
The vertical analysis (Appendix 1.3), shows that the gross profit margin as a percentage of
sales was almost constant from the year 2013-2016. Later it decreases to 57.71% in 2017.
COGS keeps on increasing from 25.17% in 2013 to 42.29% in 2017. An increase in
administrartive cost as a percentage of sales revenue is reported during the period whereas
other operating expenese reduces during 2013-2017, with lowest of 7.07% in 2017.
A fluctuating trend has been noticed in the net income of the company. The income as a % of
sales increases to 18.11% in 2014 and then tends to decraese in following years. in 2017, net
icome was 14.95% of sales revenue.
Figure 3: selected factors as a percentage of sales
1 2 3 4 5
-
10.00
20.00
30.00
40.00
50.00
60.00
70.00
80.00
COGS Gross Profit Administrative cost
other operating expenses Net income/loss after taxes
Years
% of Sales Revenue
Balance sheet
The sheet of balances is also known as statement of financial position. It represents the
financial position of the company in the market for a given period of time. It shows all the
assets and liabilities owned by the organization (Woolf & Hindson, 2011).
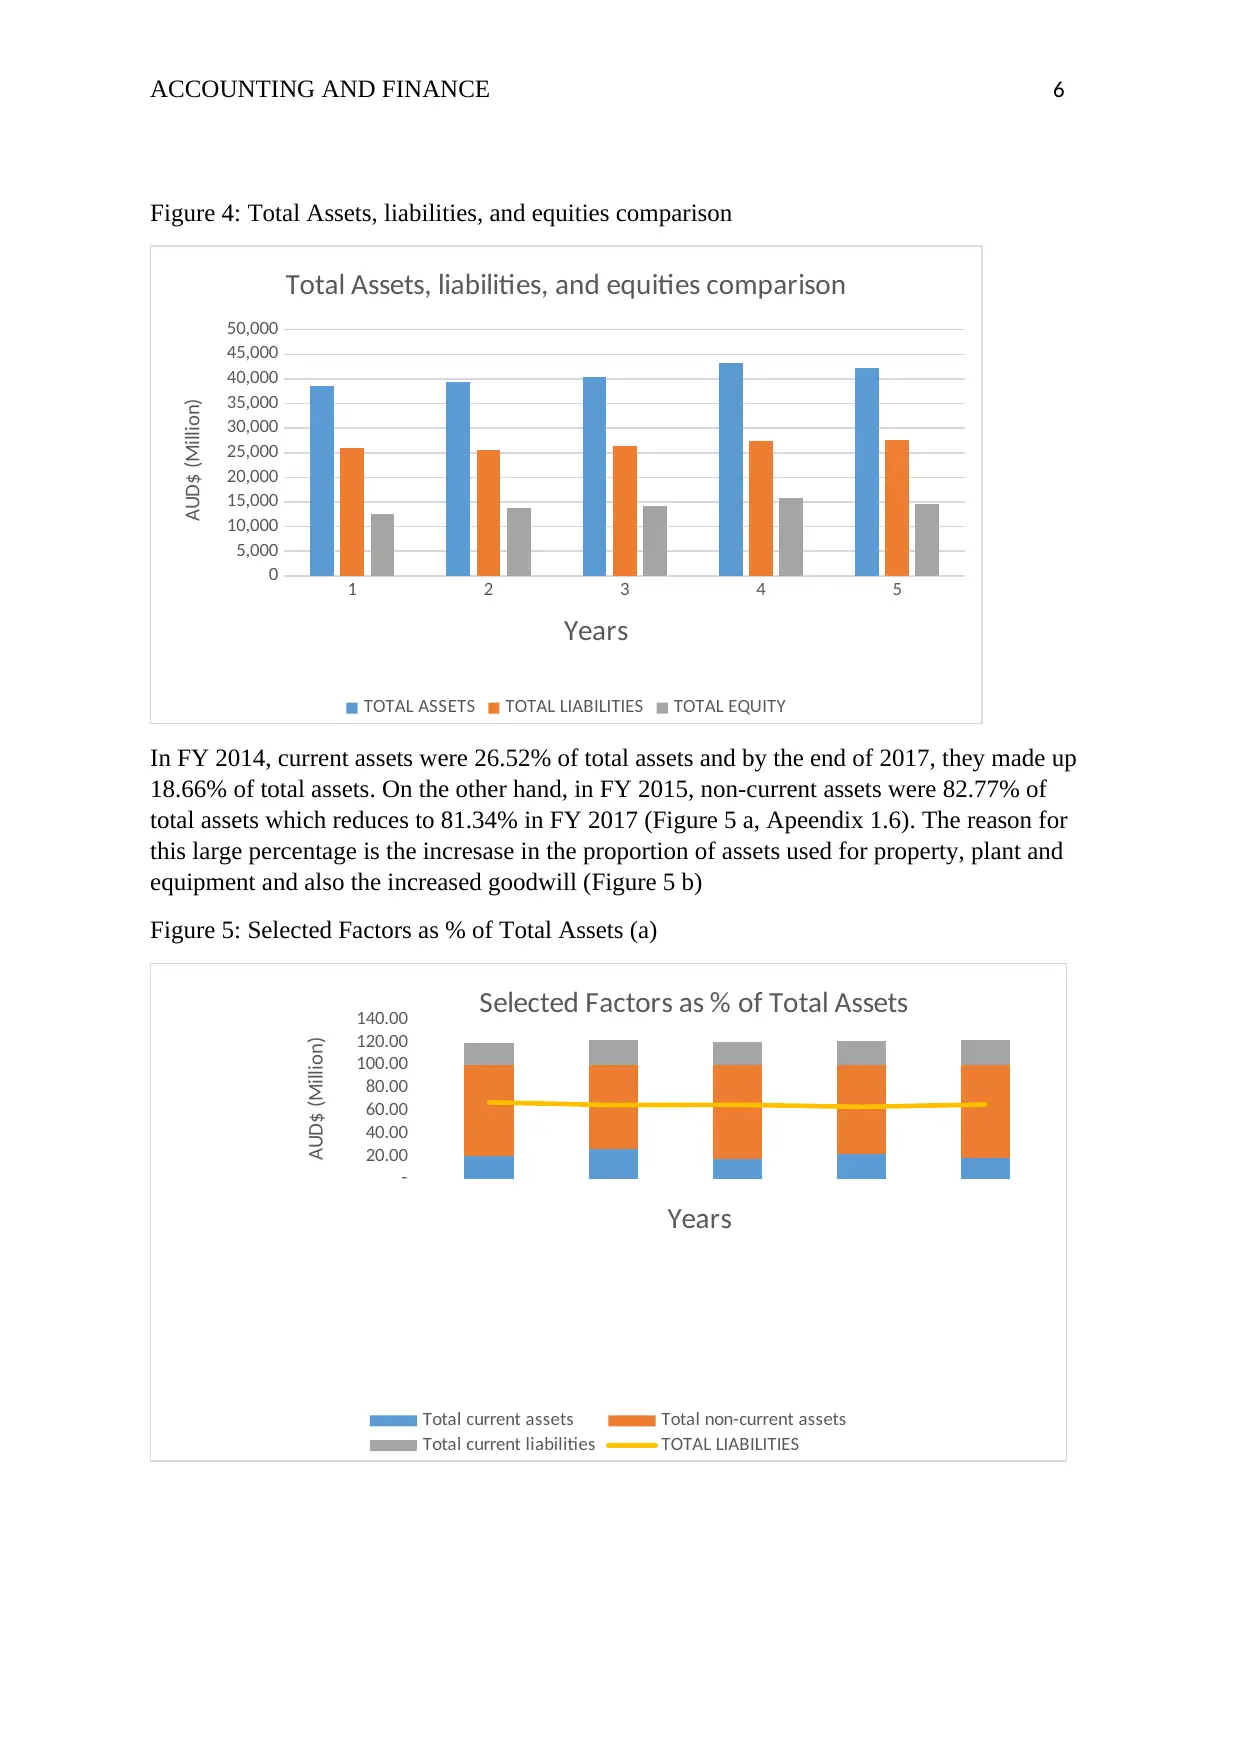
Analysing Telstra’s balance sheet for FY 2013-2017, it can be said that the total assets has
increased over the period but a decrease is also there in FY 2017 $42,133 as compare to the
previous four years. Total liabilities and total equities both have increased throughout the
period. Liabilities from $ 25,916 to $ 27,592 and equities from $12,611 to $14,541 (Figure 4,
Appendix 1.4)
profit has declined $18,975 in FY2015 as compare to that of $19.084 in 2013. The same trend
continues in the subsequent years and profit tends to declines.
The vertical analysis (Appendix 1.3), shows that the gross profit margin as a percentage of
sales was almost constant from the year 2013-2016. Later it decreases to 57.71% in 2017.
COGS keeps on increasing from 25.17% in 2013 to 42.29% in 2017. An increase in
administrartive cost as a percentage of sales revenue is reported during the period whereas
other operating expenese reduces during 2013-2017, with lowest of 7.07% in 2017.
A fluctuating trend has been noticed in the net income of the company. The income as a % of
sales increases to 18.11% in 2014 and then tends to decraese in following years. in 2017, net
icome was 14.95% of sales revenue.
Figure 3: selected factors as a percentage of sales
1 2 3 4 5
-
10.00
20.00
30.00
40.00
50.00
60.00
70.00
80.00
COGS Gross Profit Administrative cost
other operating expenses Net income/loss after taxes
Years
% of Sales Revenue
Balance sheet
The sheet of balances is also known as statement of financial position. It represents the
financial position of the company in the market for a given period of time. It shows all the
assets and liabilities owned by the organization (Woolf & Hindson, 2011).
Analysing Telstra’s balance sheet for FY 2013-2017, it can be said that the total assets has
increased over the period but a decrease is also there in FY 2017 $42,133 as compare to the
previous four years. Total liabilities and total equities both have increased throughout the
period. Liabilities from $ 25,916 to $ 27,592 and equities from $12,611 to $14,541 (Figure 4,
Appendix 1.4)
ACCOUNTING AND FINANCE 6
Figure 4: Total Assets, liabilities, and equities comparison
1 2 3 4 5
0
5,000
10,000
15,000
20,000
25,000
30,000
35,000
40,000
45,000
50,000
Total Assets, liabilities, and equities comparison
TOTAL ASSETS TOTAL LIABILITIES TOTAL EQUITY
Years
AUD$ (Million)
In FY 2014, current assets were 26.52% of total assets and by the end of 2017, they made up
18.66% of total assets. On the other hand, in FY 2015, non-current assets were 82.77% of
total assets which reduces to 81.34% in FY 2017 (Figure 5 a, Apeendix 1.6). The reason for
this large percentage is the incresase in the proportion of assets used for property, plant and
equipment and also the increased goodwill (Figure 5 b)
Figure 5: Selected Factors as % of Total Assets (a)
-
20.00
40.00
60.00
80.00
100.00
120.00
140.00 Selected Factors as % of Total Assets
Total current assets Total non-current assets
Total current liabilities TOTAL LIABILITIES
Years
AUD$ (Million)
⊘ This is a preview!⊘
Do you want full access?
Subscribe today to unlock all pages.
Trusted by 1+ million students worldwide
ACCOUNTING AND FINANCE 7
Figure 5: Selected Factors as % of Total Assets (b)
1 2 3 4 5
-
10.00
20.00
30.00
40.00
50.00
60.00
Selected Factors as % of Total Assets
Inventories Prepaid expenses
Property, Plant and equipment goodwill
Years
% of Total Assets
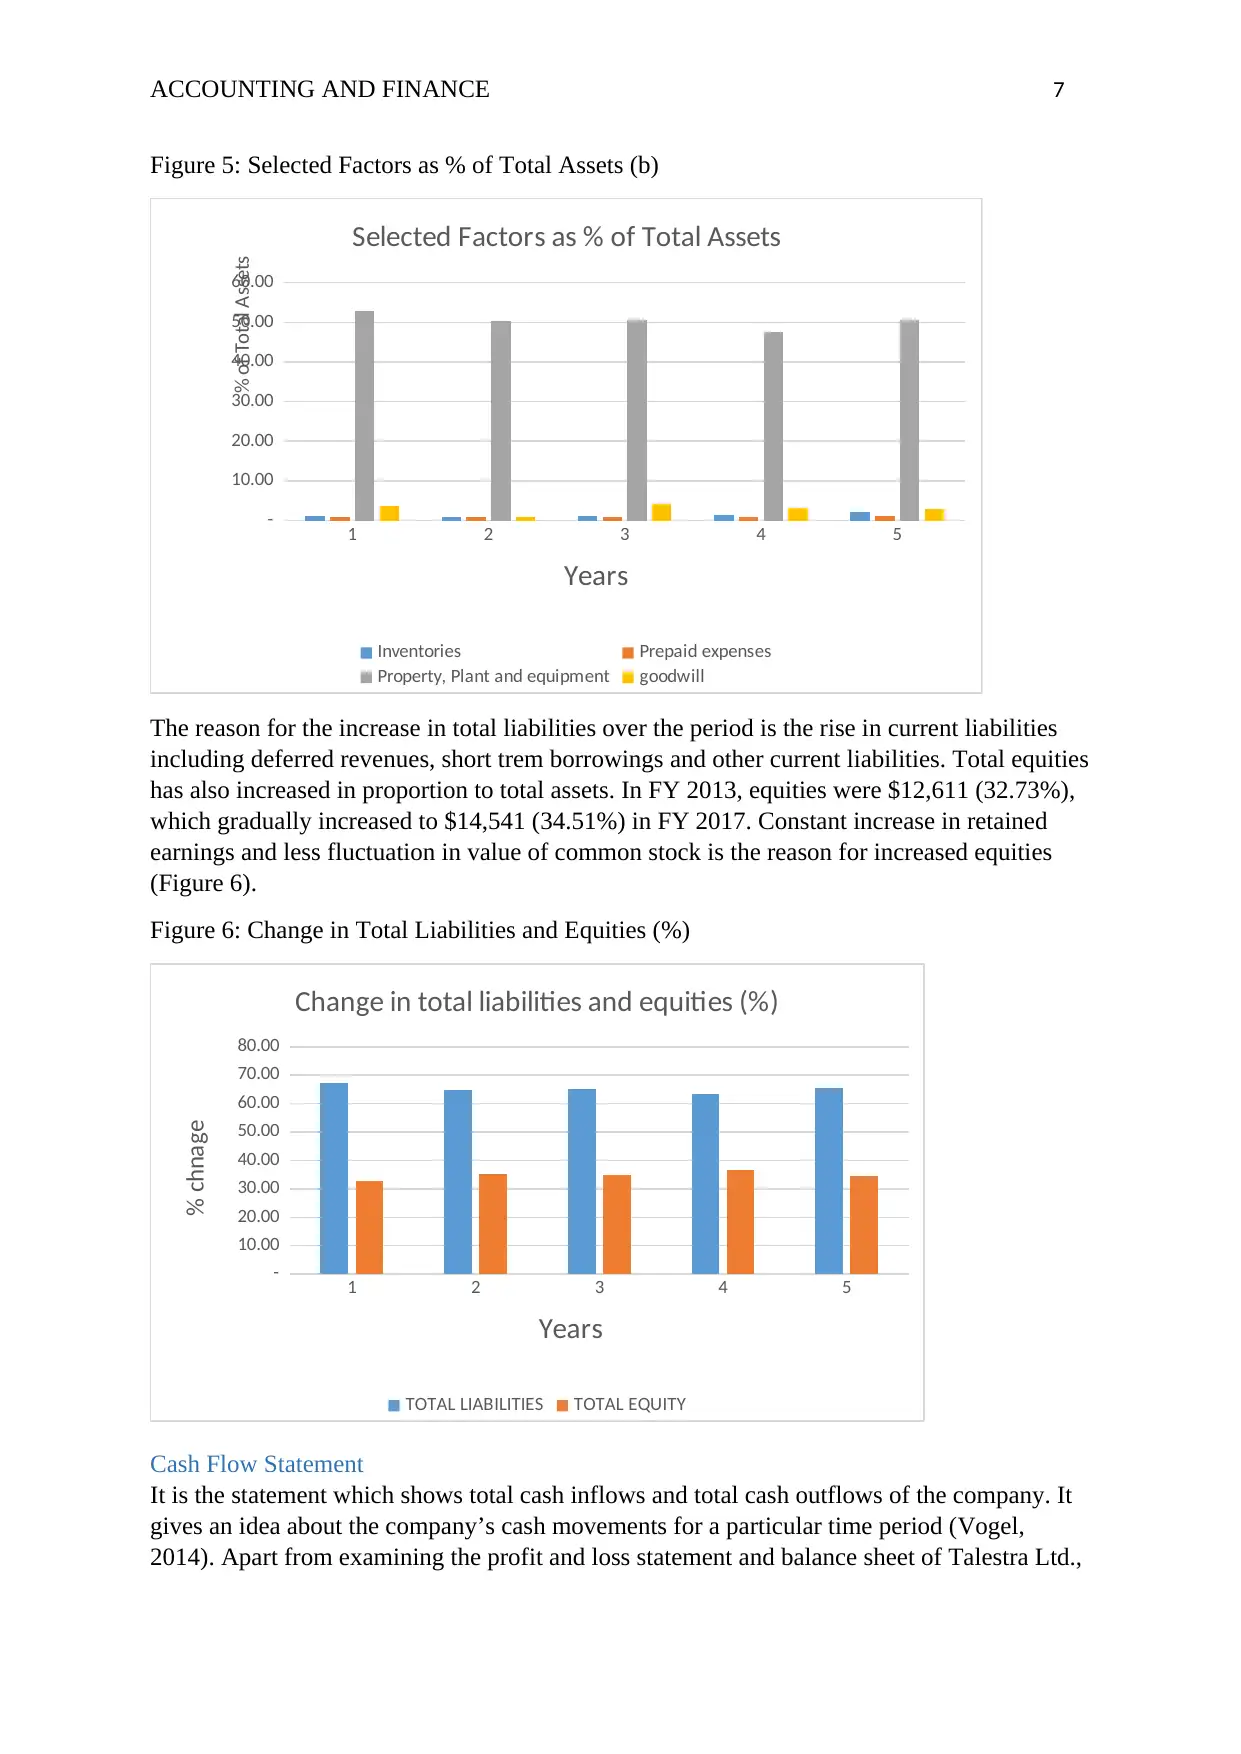
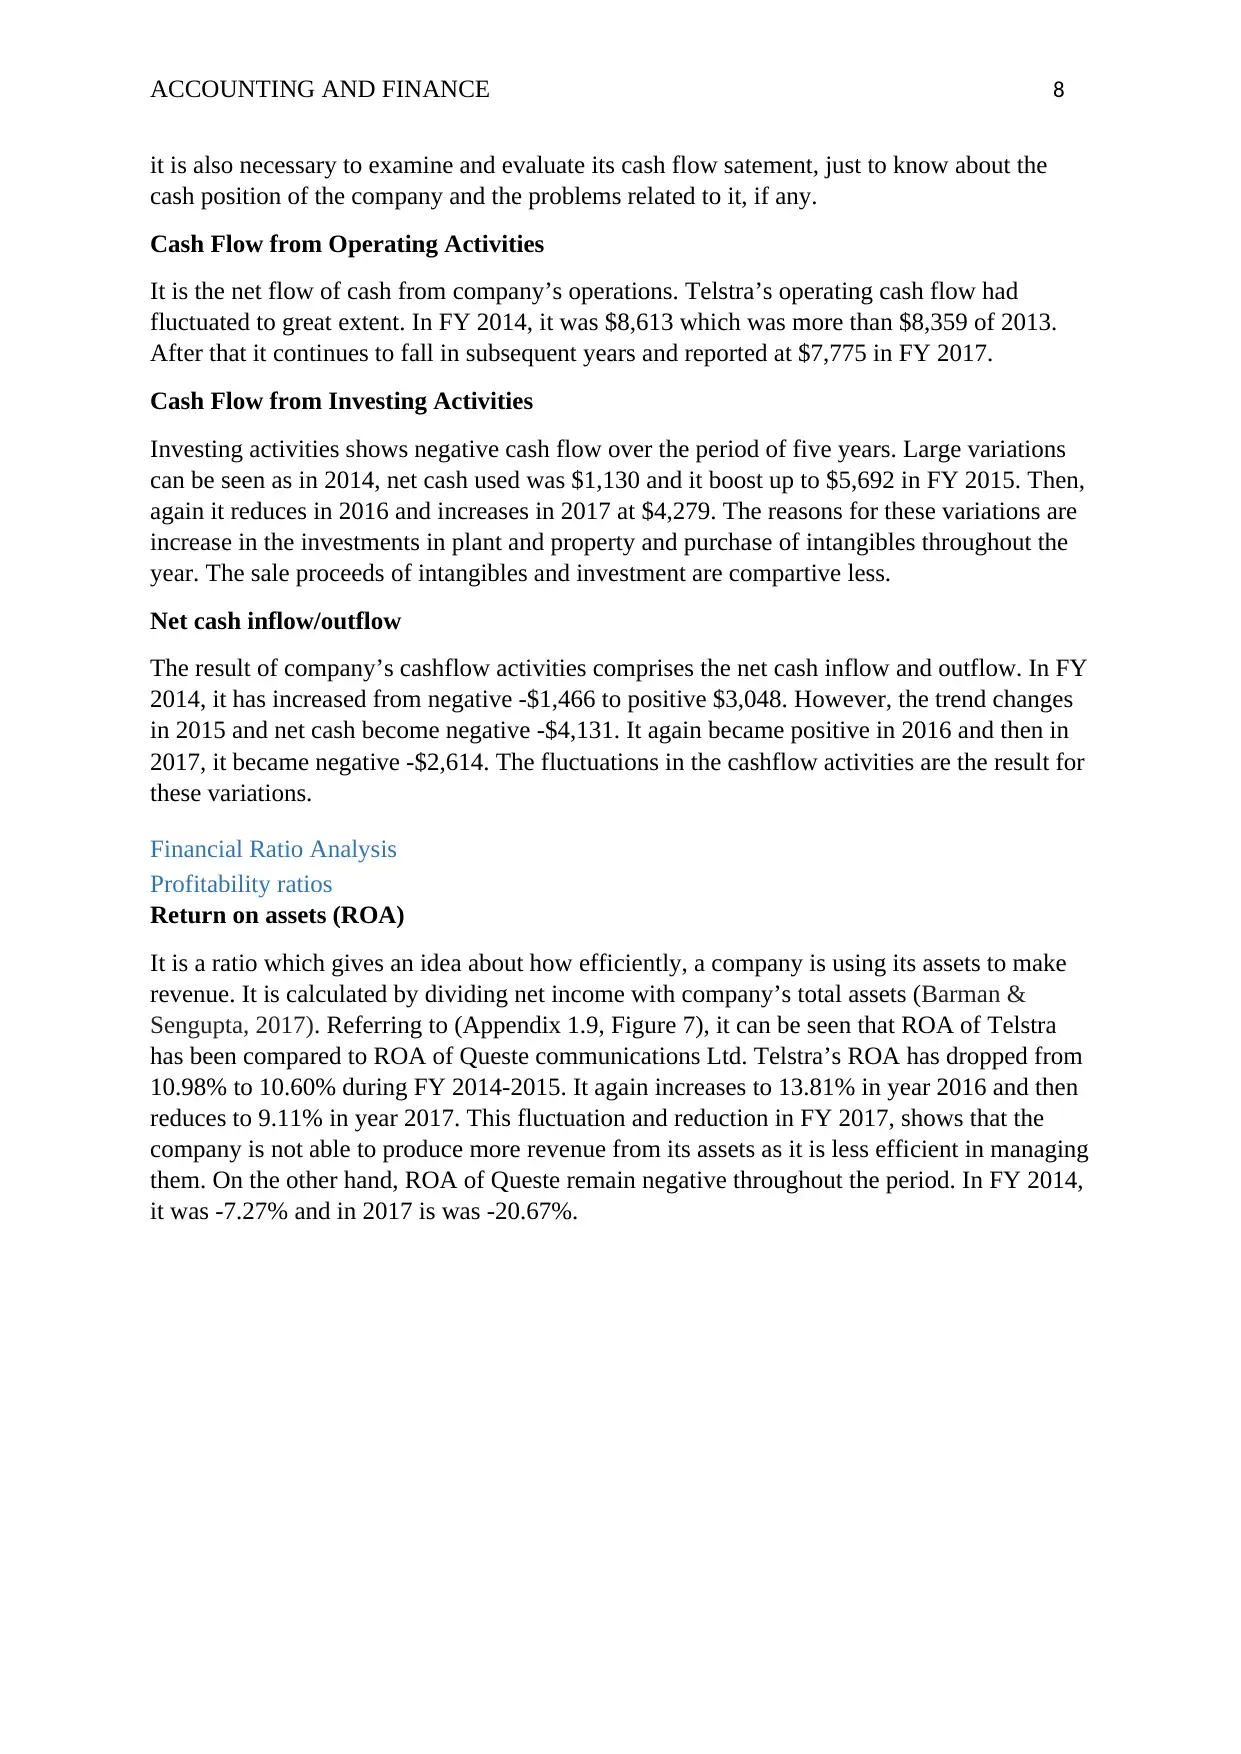
The reason for the increase in total liabilities over the period is the rise in current liabilities
including deferred revenues, short trem borrowings and other current liabilities. Total equities
has also increased in proportion to total assets. In FY 2013, equities were $12,611 (32.73%),
which gradually increased to $14,541 (34.51%) in FY 2017. Constant increase in retained
earnings and less fluctuation in value of common stock is the reason for increased equities
(Figure 6).
Figure 6: Change in Total Liabilities and Equities (%)
1 2 3 4 5
-
10.00
20.00
30.00
40.00
50.00
60.00
70.00
80.00
Change in total liabilities and equities (%)
TOTAL LIABILITIES TOTAL EQUITY
Years
% chnage
Cash Flow Statement
It is the statement which shows total cash inflows and total cash outflows of the company. It
gives an idea about the company’s cash movements for a particular time period (Vogel,
2014). Apart from examining the profit and loss statement and balance sheet of Talestra Ltd.,
Figure 5: Selected Factors as % of Total Assets (b)
1 2 3 4 5
-
10.00
20.00
30.00
40.00
50.00
60.00
Selected Factors as % of Total Assets
Inventories Prepaid expenses
Property, Plant and equipment goodwill
Years
% of Total Assets
The reason for the increase in total liabilities over the period is the rise in current liabilities
including deferred revenues, short trem borrowings and other current liabilities. Total equities
has also increased in proportion to total assets. In FY 2013, equities were $12,611 (32.73%),
which gradually increased to $14,541 (34.51%) in FY 2017. Constant increase in retained
earnings and less fluctuation in value of common stock is the reason for increased equities
(Figure 6).
Figure 6: Change in Total Liabilities and Equities (%)
1 2 3 4 5
-
10.00
20.00
30.00
40.00
50.00
60.00
70.00
80.00
Change in total liabilities and equities (%)
TOTAL LIABILITIES TOTAL EQUITY
Years
% chnage
Cash Flow Statement
It is the statement which shows total cash inflows and total cash outflows of the company. It
gives an idea about the company’s cash movements for a particular time period (Vogel,
2014). Apart from examining the profit and loss statement and balance sheet of Talestra Ltd.,
Paraphrase This Document
Need a fresh take? Get an instant paraphrase of this document with our AI Paraphraser
ACCOUNTING AND FINANCE 8
it is also necessary to examine and evaluate its cash flow satement, just to know about the
cash position of the company and the problems related to it, if any.
Cash Flow from Operating Activities
It is the net flow of cash from company’s operations. Telstra’s operating cash flow had
fluctuated to great extent. In FY 2014, it was $8,613 which was more than $8,359 of 2013.
After that it continues to fall in subsequent years and reported at $7,775 in FY 2017.
Cash Flow from Investing Activities
Investing activities shows negative cash flow over the period of five years. Large variations
can be seen as in 2014, net cash used was $1,130 and it boost up to $5,692 in FY 2015. Then,
again it reduces in 2016 and increases in 2017 at $4,279. The reasons for these variations are
increase in the investments in plant and property and purchase of intangibles throughout the
year. The sale proceeds of intangibles and investment are compartive less.
Net cash inflow/outflow
The result of company’s cashflow activities comprises the net cash inflow and outflow. In FY
2014, it has increased from negative -$1,466 to positive $3,048. However, the trend changes
in 2015 and net cash become negative -$4,131. It again became positive in 2016 and then in
2017, it became negative -$2,614. The fluctuations in the cashflow activities are the result for
these variations.
Financial Ratio Analysis
Profitability ratios
Return on assets (ROA)
It is a ratio which gives an idea about how efficiently, a company is using its assets to make
revenue. It is calculated by dividing net income with company’s total assets (Barman &
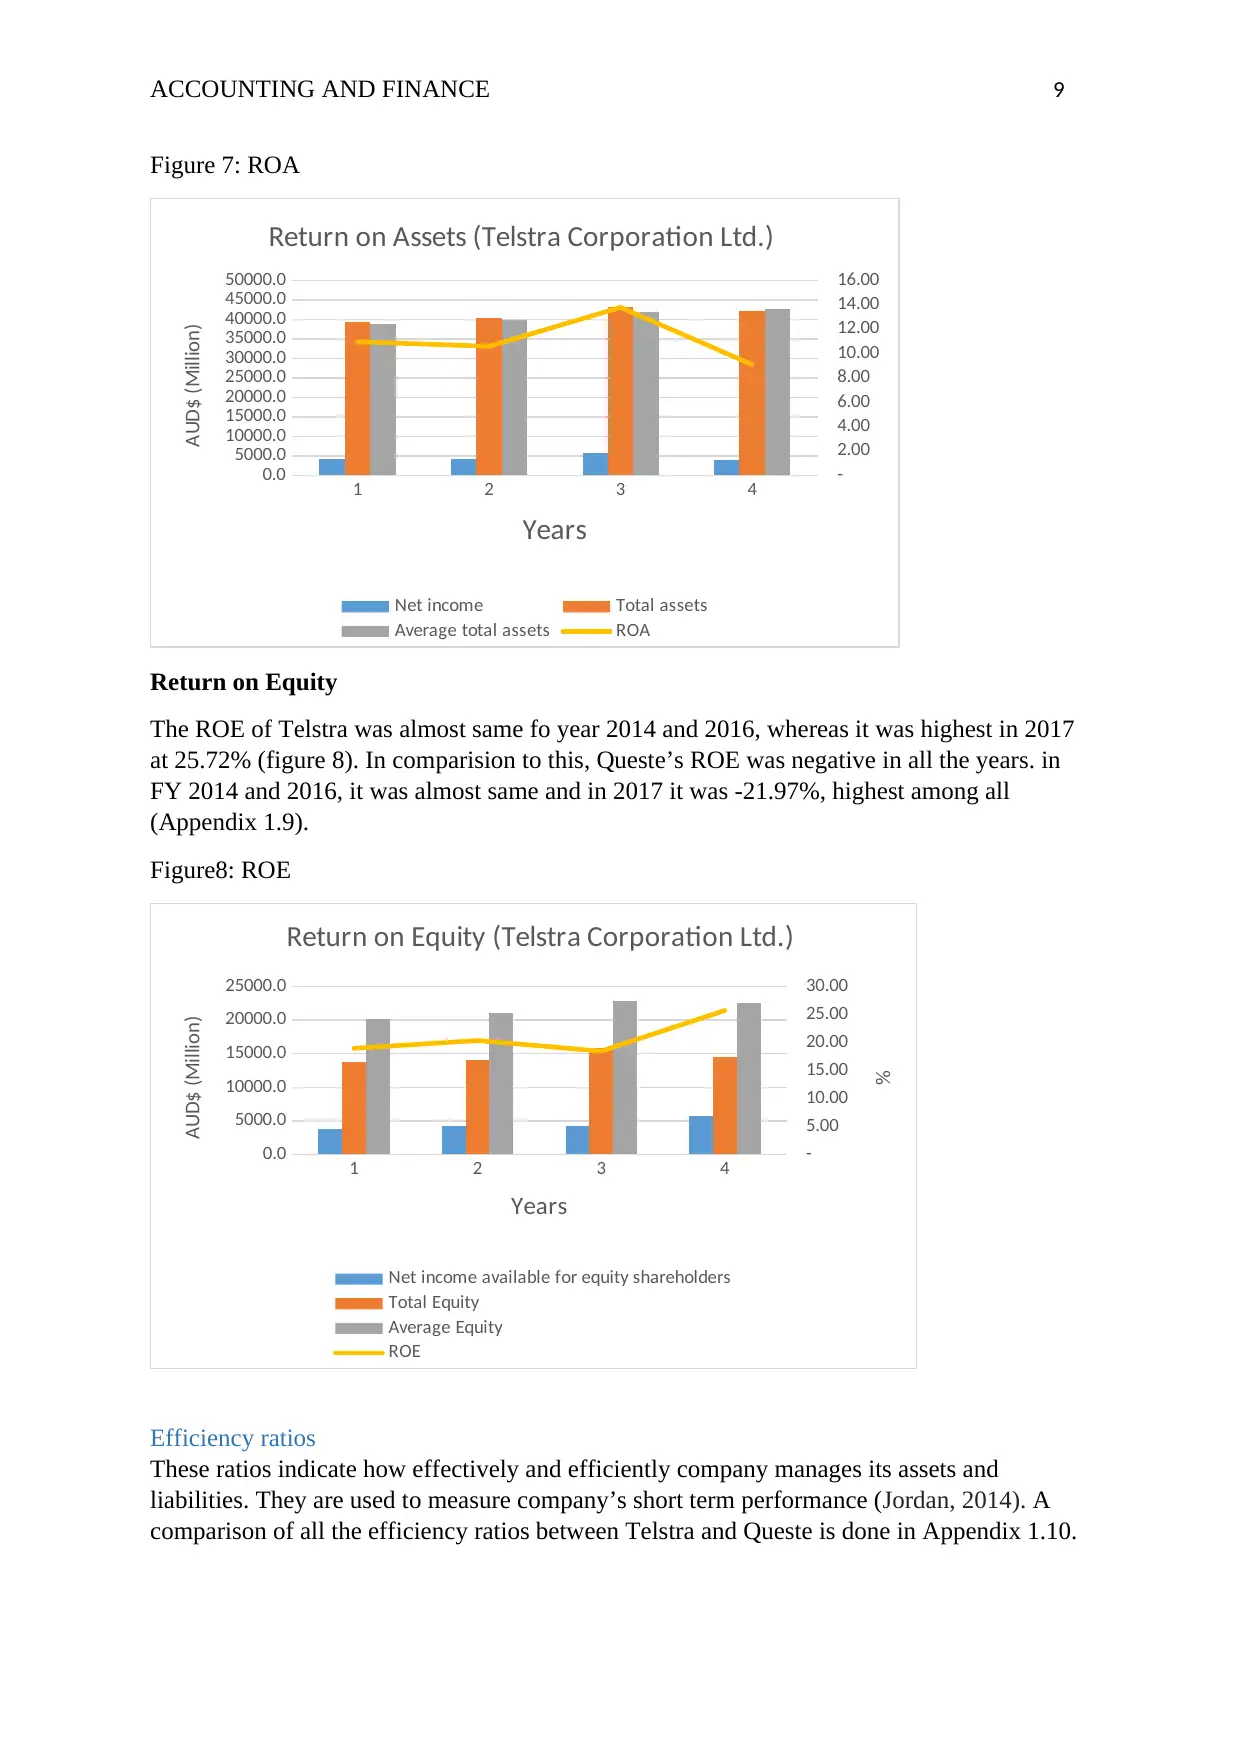
Sengupta, 2017). Referring to (Appendix 1.9, Figure 7), it can be seen that ROA of Telstra
has been compared to ROA of Queste communications Ltd. Telstra’s ROA has dropped from
10.98% to 10.60% during FY 2014-2015. It again increases to 13.81% in year 2016 and then
reduces to 9.11% in year 2017. This fluctuation and reduction in FY 2017, shows that the
company is not able to produce more revenue from its assets as it is less efficient in managing
them. On the other hand, ROA of Queste remain negative throughout the period. In FY 2014,
it was -7.27% and in 2017 is was -20.67%.
it is also necessary to examine and evaluate its cash flow satement, just to know about the
cash position of the company and the problems related to it, if any.
Cash Flow from Operating Activities
It is the net flow of cash from company’s operations. Telstra’s operating cash flow had
fluctuated to great extent. In FY 2014, it was $8,613 which was more than $8,359 of 2013.
After that it continues to fall in subsequent years and reported at $7,775 in FY 2017.
Cash Flow from Investing Activities
Investing activities shows negative cash flow over the period of five years. Large variations
can be seen as in 2014, net cash used was $1,130 and it boost up to $5,692 in FY 2015. Then,
again it reduces in 2016 and increases in 2017 at $4,279. The reasons for these variations are
increase in the investments in plant and property and purchase of intangibles throughout the
year. The sale proceeds of intangibles and investment are compartive less.
Net cash inflow/outflow
The result of company’s cashflow activities comprises the net cash inflow and outflow. In FY
2014, it has increased from negative -$1,466 to positive $3,048. However, the trend changes
in 2015 and net cash become negative -$4,131. It again became positive in 2016 and then in
2017, it became negative -$2,614. The fluctuations in the cashflow activities are the result for
these variations.
Financial Ratio Analysis
Profitability ratios
Return on assets (ROA)
It is a ratio which gives an idea about how efficiently, a company is using its assets to make
revenue. It is calculated by dividing net income with company’s total assets (Barman &
Sengupta, 2017). Referring to (Appendix 1.9, Figure 7), it can be seen that ROA of Telstra
has been compared to ROA of Queste communications Ltd. Telstra’s ROA has dropped from
10.98% to 10.60% during FY 2014-2015. It again increases to 13.81% in year 2016 and then
reduces to 9.11% in year 2017. This fluctuation and reduction in FY 2017, shows that the
company is not able to produce more revenue from its assets as it is less efficient in managing
them. On the other hand, ROA of Queste remain negative throughout the period. In FY 2014,
it was -7.27% and in 2017 is was -20.67%.
ACCOUNTING AND FINANCE 9
Figure 7: ROA
1 2 3 4
0.0
5000.0
10000.0
15000.0
20000.0
25000.0
30000.0
35000.0
40000.0
45000.0
50000.0
-
2.00
4.00
6.00
8.00
10.00
12.00
14.00
16.00
Return on Assets (Telstra Corporation Ltd.)
Net income Total assets
Average total assets ROA
Years
AUD$ (Million)
Return on Equity
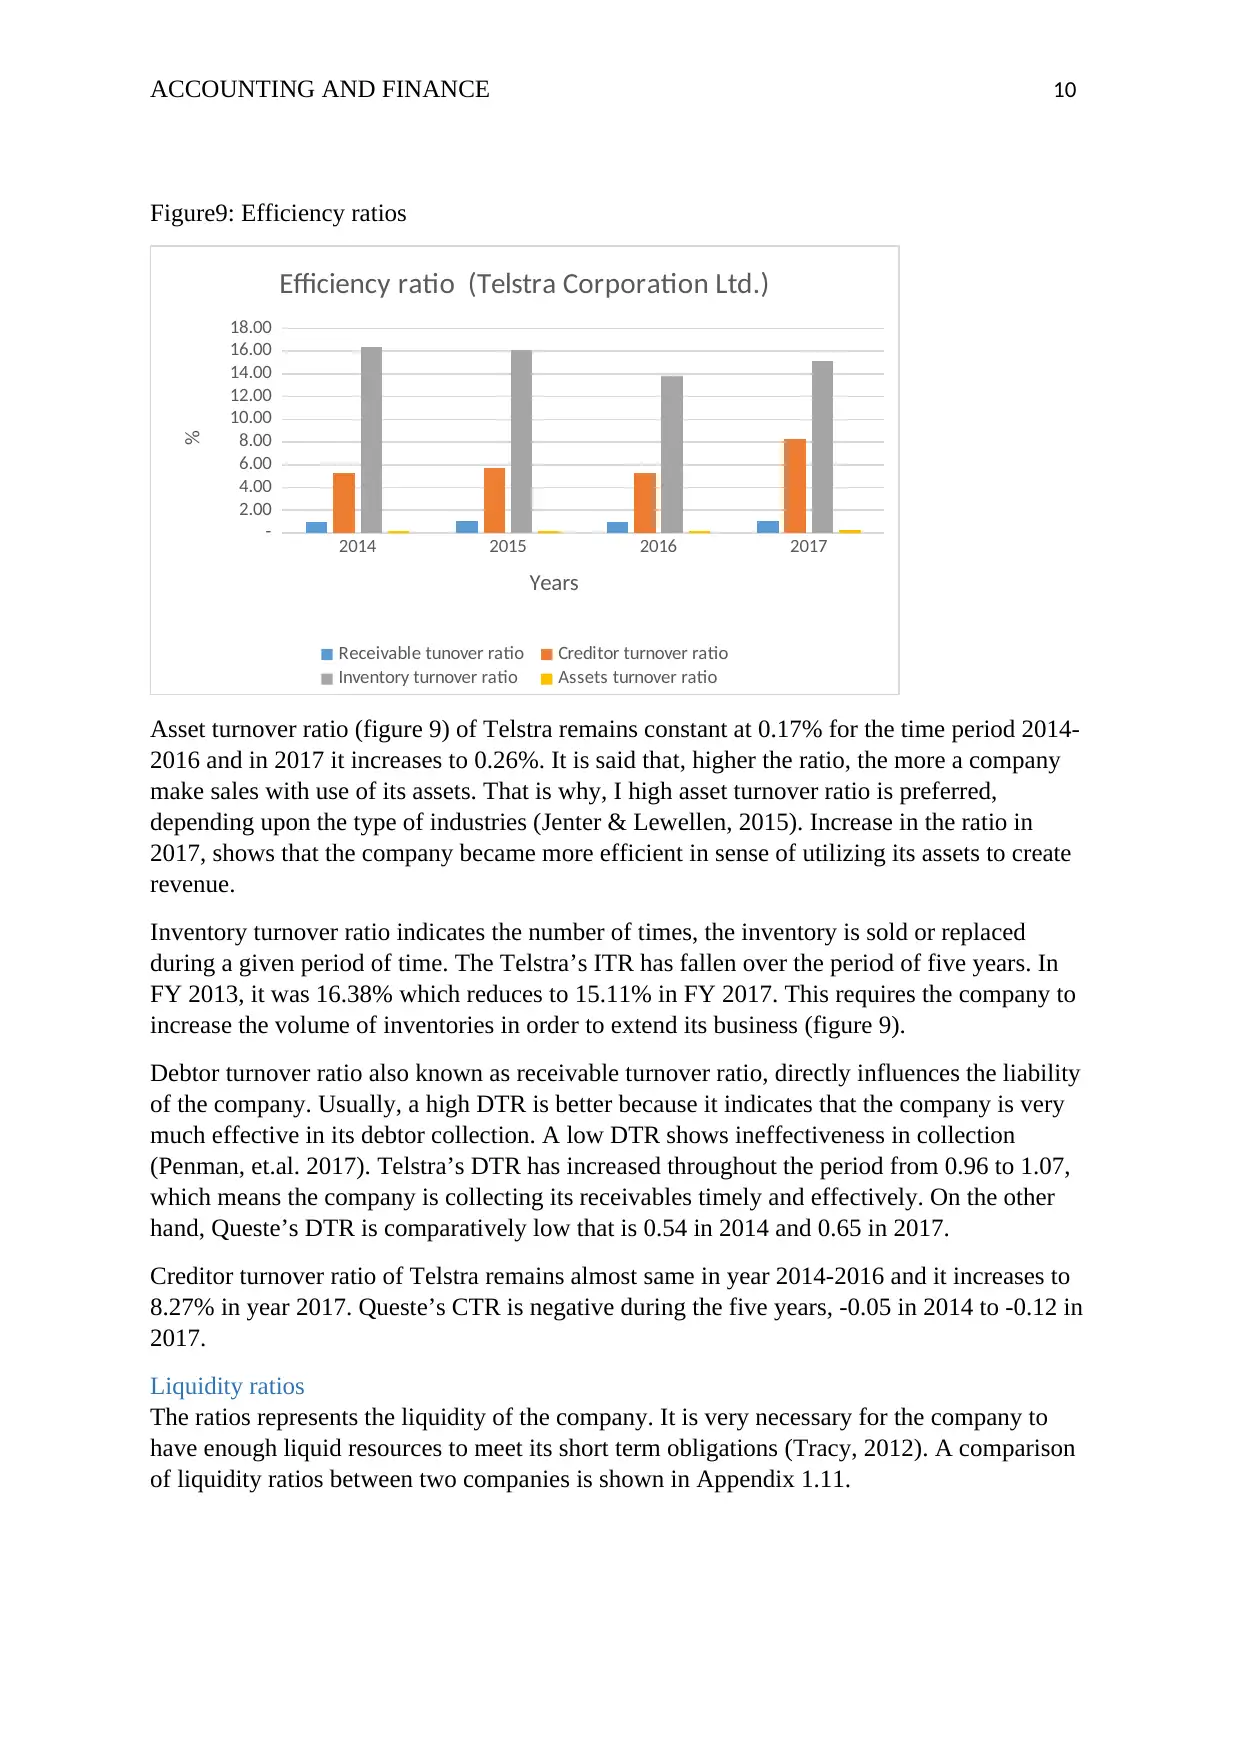
The ROE of Telstra was almost same fo year 2014 and 2016, whereas it was highest in 2017
at 25.72% (figure 8). In comparision to this, Queste’s ROE was negative in all the years. in
FY 2014 and 2016, it was almost same and in 2017 it was -21.97%, highest among all
(Appendix 1.9).
Figure8: ROE
1 2 3 4
0.0
5000.0
10000.0
15000.0
20000.0
25000.0
-
5.00
10.00
15.00
20.00
25.00
30.00
Return on Equity (Telstra Corporation Ltd.)
Net income available for equity shareholders
Total Equity
Average Equity
ROE
Years
AUD$ (Million)
%
Efficiency ratios
These ratios indicate how effectively and efficiently company manages its assets and
liabilities. They are used to measure company’s short term performance (Jordan, 2014). A
comparison of all the efficiency ratios between Telstra and Queste is done in Appendix 1.10.
Figure 7: ROA
1 2 3 4
0.0
5000.0
10000.0
15000.0
20000.0
25000.0
30000.0
35000.0
40000.0
45000.0
50000.0
-
2.00
4.00
6.00
8.00
10.00
12.00
14.00
16.00
Return on Assets (Telstra Corporation Ltd.)
Net income Total assets
Average total assets ROA
Years
AUD$ (Million)
Return on Equity
The ROE of Telstra was almost same fo year 2014 and 2016, whereas it was highest in 2017
at 25.72% (figure 8). In comparision to this, Queste’s ROE was negative in all the years. in
FY 2014 and 2016, it was almost same and in 2017 it was -21.97%, highest among all
(Appendix 1.9).
Figure8: ROE
1 2 3 4
0.0
5000.0
10000.0
15000.0
20000.0
25000.0
-
5.00
10.00
15.00
20.00
25.00
30.00
Return on Equity (Telstra Corporation Ltd.)
Net income available for equity shareholders
Total Equity
Average Equity
ROE
Years
AUD$ (Million)
%
Efficiency ratios
These ratios indicate how effectively and efficiently company manages its assets and
liabilities. They are used to measure company’s short term performance (Jordan, 2014). A
comparison of all the efficiency ratios between Telstra and Queste is done in Appendix 1.10.
⊘ This is a preview!⊘
Do you want full access?
Subscribe today to unlock all pages.
Trusted by 1+ million students worldwide
ACCOUNTING AND FINANCE 10
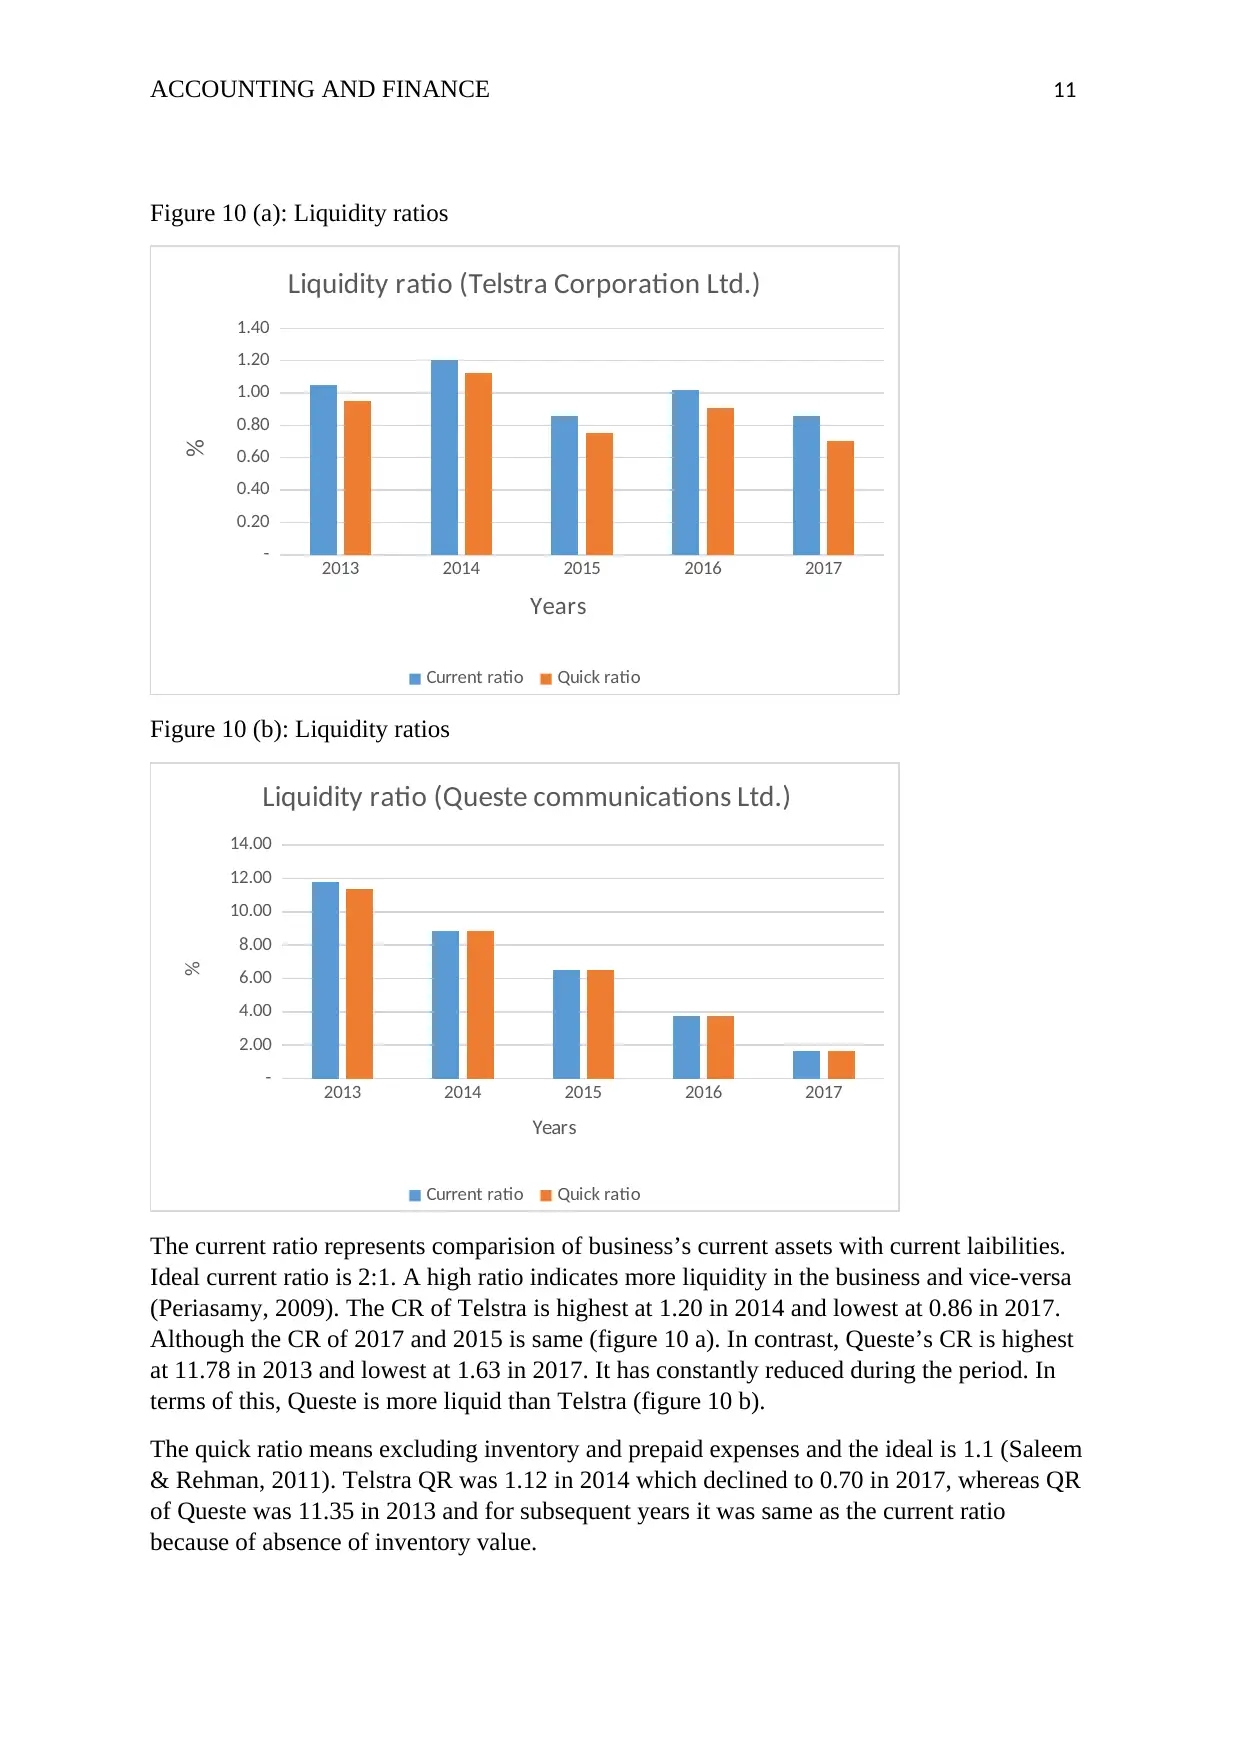
Figure9: Efficiency ratios
2014 2015 2016 2017
-
2.00
4.00
6.00
8.00
10.00
12.00
14.00
16.00
18.00
Efficiency ratio (Telstra Corporation Ltd.)
Receivable tunover ratio Creditor turnover ratio
Inventory turnover ratio Assets turnover ratio
Years
%
Asset turnover ratio (figure 9) of Telstra remains constant at 0.17% for the time period 2014-
2016 and in 2017 it increases to 0.26%. It is said that, higher the ratio, the more a company
make sales with use of its assets. That is why, I high asset turnover ratio is preferred,
depending upon the type of industries (Jenter & Lewellen, 2015). Increase in the ratio in
2017, shows that the company became more efficient in sense of utilizing its assets to create
revenue.
Inventory turnover ratio indicates the number of times, the inventory is sold or replaced
during a given period of time. The Telstra’s ITR has fallen over the period of five years. In
FY 2013, it was 16.38% which reduces to 15.11% in FY 2017. This requires the company to
increase the volume of inventories in order to extend its business (figure 9).
Debtor turnover ratio also known as receivable turnover ratio, directly influences the liability
of the company. Usually, a high DTR is better because it indicates that the company is very
much effective in its debtor collection. A low DTR shows ineffectiveness in collection
(Penman, et.al. 2017). Telstra’s DTR has increased throughout the period from 0.96 to 1.07,
which means the company is collecting its receivables timely and effectively. On the other
hand, Queste’s DTR is comparatively low that is 0.54 in 2014 and 0.65 in 2017.
Creditor turnover ratio of Telstra remains almost same in year 2014-2016 and it increases to
8.27% in year 2017. Queste’s CTR is negative during the five years, -0.05 in 2014 to -0.12 in
2017.
Liquidity ratios
The ratios represents the liquidity of the company. It is very necessary for the company to
have enough liquid resources to meet its short term obligations (Tracy, 2012). A comparison
of liquidity ratios between two companies is shown in Appendix 1.11.
Paraphrase This Document
Need a fresh take? Get an instant paraphrase of this document with our AI Paraphraser
ACCOUNTING AND FINANCE 11
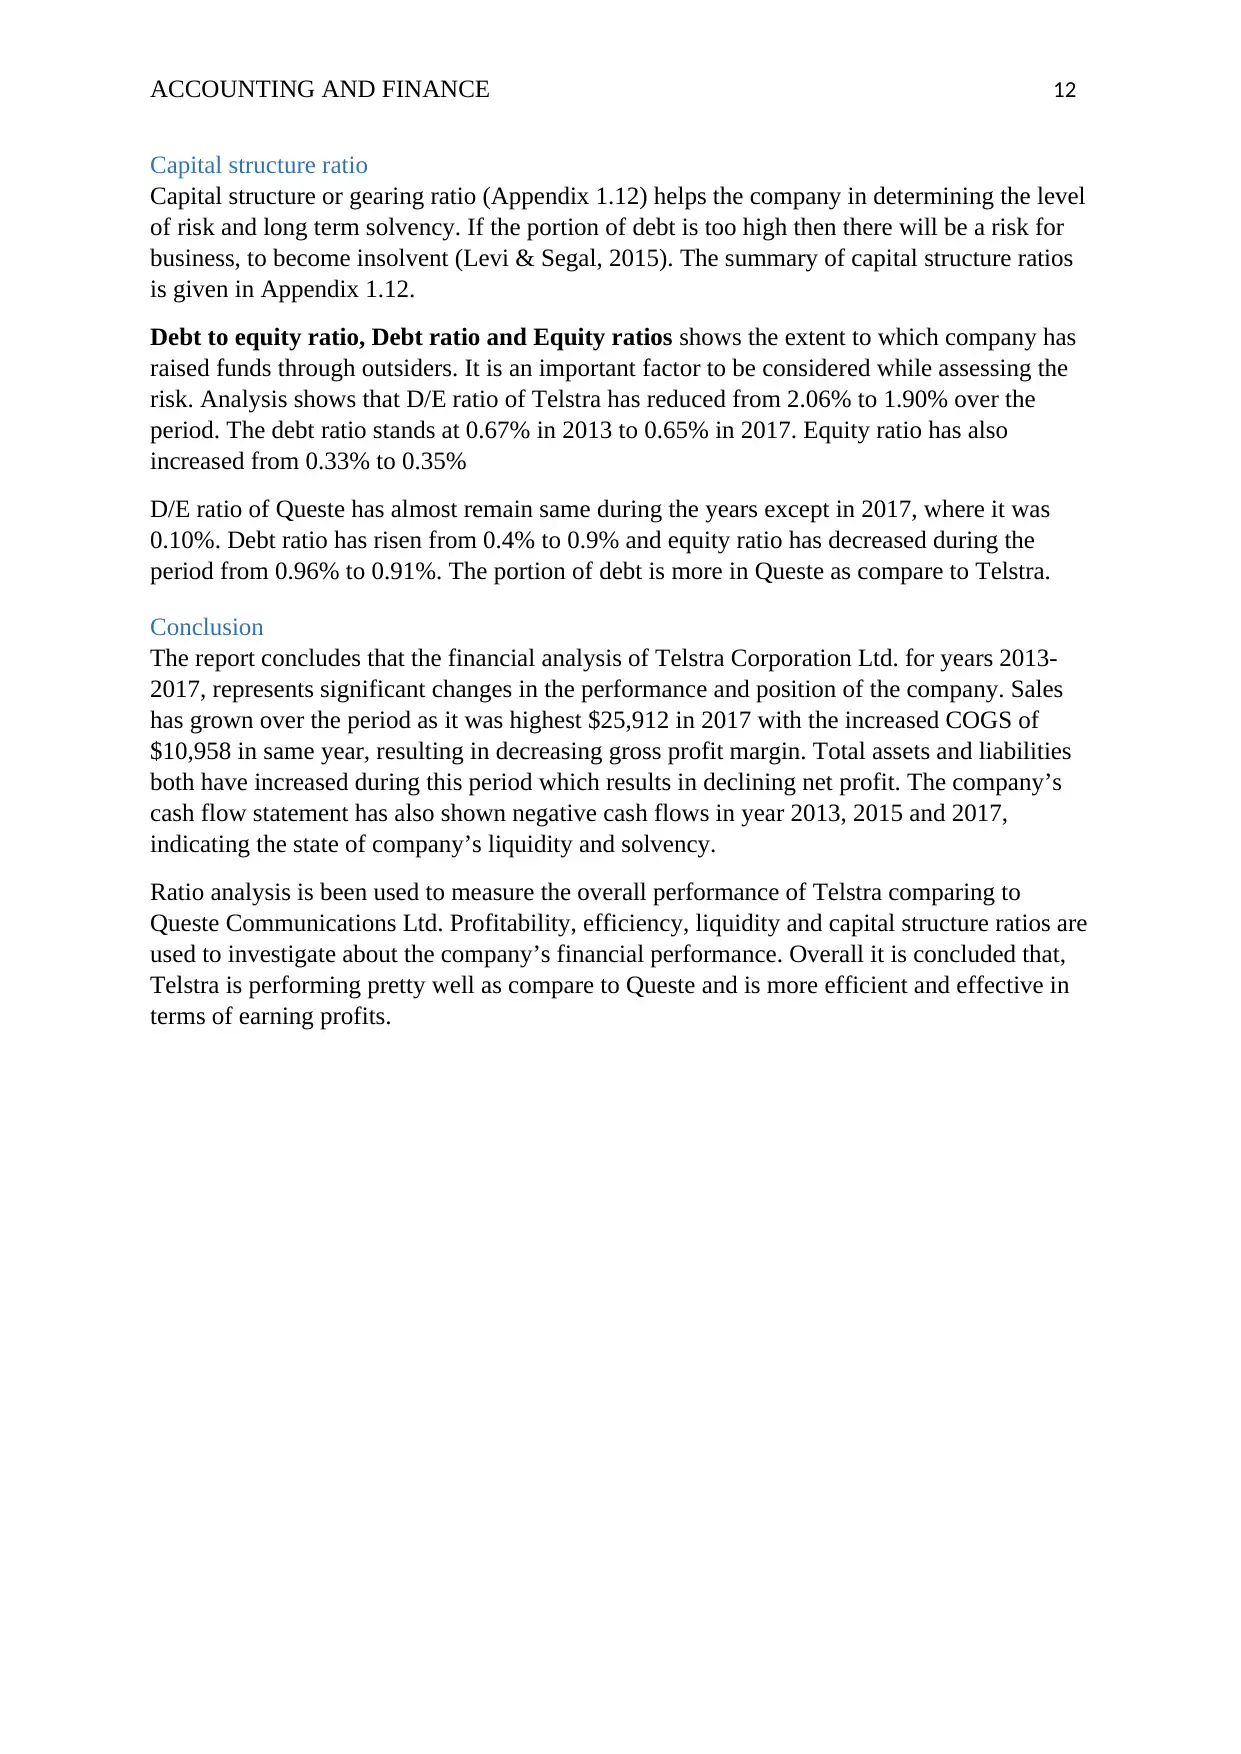
Figure 10 (a): Liquidity ratios
2013 2014 2015 2016 2017
-
0.20
0.40
0.60
0.80
1.00
1.20
1.40
Liquidity ratio (Telstra Corporation Ltd.)
Current ratio Quick ratio
Years
%
Figure 10 (b): Liquidity ratios
2013 2014 2015 2016 2017
-
2.00
4.00
6.00
8.00
10.00
12.00
14.00
Liquidity ratio (Queste communications Ltd.)
Current ratio Quick ratio
Years
%
The current ratio represents comparision of business’s current assets with current laibilities.
Ideal current ratio is 2:1. A high ratio indicates more liquidity in the business and vice-versa
(Periasamy, 2009). The CR of Telstra is highest at 1.20 in 2014 and lowest at 0.86 in 2017.
Although the CR of 2017 and 2015 is same (figure 10 a). In contrast, Queste’s CR is highest
at 11.78 in 2013 and lowest at 1.63 in 2017. It has constantly reduced during the period. In
terms of this, Queste is more liquid than Telstra (figure 10 b).
The quick ratio means excluding inventory and prepaid expenses and the ideal is 1.1 (Saleem
& Rehman, 2011). Telstra QR was 1.12 in 2014 which declined to 0.70 in 2017, whereas QR
of Queste was 11.35 in 2013 and for subsequent years it was same as the current ratio
because of absence of inventory value.
ACCOUNTING AND FINANCE 12
Capital structure ratio
Capital structure or gearing ratio (Appendix 1.12) helps the company in determining the level
of risk and long term solvency. If the portion of debt is too high then there will be a risk for
business, to become insolvent (Levi & Segal, 2015). The summary of capital structure ratios
is given in Appendix 1.12.
Debt to equity ratio, Debt ratio and Equity ratios shows the extent to which company has
raised funds through outsiders. It is an important factor to be considered while assessing the
risk. Analysis shows that D/E ratio of Telstra has reduced from 2.06% to 1.90% over the
period. The debt ratio stands at 0.67% in 2013 to 0.65% in 2017. Equity ratio has also
increased from 0.33% to 0.35%
D/E ratio of Queste has almost remain same during the years except in 2017, where it was
0.10%. Debt ratio has risen from 0.4% to 0.9% and equity ratio has decreased during the
period from 0.96% to 0.91%. The portion of debt is more in Queste as compare to Telstra.
Conclusion
The report concludes that the financial analysis of Telstra Corporation Ltd. for years 2013-
2017, represents significant changes in the performance and position of the company. Sales
has grown over the period as it was highest $25,912 in 2017 with the increased COGS of
$10,958 in same year, resulting in decreasing gross profit margin. Total assets and liabilities
both have increased during this period which results in declining net profit. The company’s
cash flow statement has also shown negative cash flows in year 2013, 2015 and 2017,
indicating the state of company’s liquidity and solvency.
Ratio analysis is been used to measure the overall performance of Telstra comparing to
Queste Communications Ltd. Profitability, efficiency, liquidity and capital structure ratios are
used to investigate about the company’s financial performance. Overall it is concluded that,
Telstra is performing pretty well as compare to Queste and is more efficient and effective in
terms of earning profits.
⊘ This is a preview!⊘
Do you want full access?
Subscribe today to unlock all pages.
Trusted by 1+ million students worldwide
1 out of 23
Related Documents


Your All-in-One AI-Powered Toolkit for Academic Success.
+13062052269
info@desklib.com
Available 24*7 on WhatsApp / Email
![[object Object]](/_next/static/media/star-bottom.7253800d.svg)
Unlock your academic potential
Copyright © 2020–2026 A2Z Services. All Rights Reserved. Developed and managed by ZUCOL.