ECFS866 Corporate Finance Assignment 1: TELYS4 Valuation Report
VerifiedAdded on 2022/08/12
|13
|2713
|16
Report
AI Summary
This report provides a detailed analysis of the valuation of TELYS4, focusing on the acquisition of Seven Group Holdings. It begins with an executive summary and recommendation, followed by an examination of enterprise value components and governance. The report delves into the use of debt and equity financing by TELYS4, its valuation methods (including Dividend Discount Model and Free Cash Flow), and the application of ROIC, EV, and residual income. It then calculates the cost of capital, including implied beta, and performs equity valuation using the dividend discount model. The report also includes a divisional analysis to determine the intrinsic share price and concludes with a recommendation for investors regarding the acquisition offer. The report is based on the ECFS866 Corporate Finance assignment brief, providing a comprehensive financial assessment of the company.
Running head: CORPORATE FINANCE
Corporate Finance
Name of the Student:
Name of the University:
Author’s Note:
Corporate Finance
Name of the Student:
Name of the University:
Author’s Note:
Paraphrase This Document
Need a fresh take? Get an instant paraphrase of this document with our AI Paraphraser
1CORPORATE FINANCE
Table of Contents
Executive Summary & Recommendation.......................................................................................2
Enterprise Value and Governance...................................................................................................3
Components of Enterprise Value.................................................................................................3
TELYS4 as Debt or Equity Fund.................................................................................................3
Valuation of TELYS4..................................................................................................................4
ROIC, EV and Residual Income..................................................................................................5
Cost of Capital and Security Valuation...........................................................................................6
Implied Beta and Cost of Capital.................................................................................................6
Benchmarking to Cost of Debt....................................................................................................7
Equity Valuation..........................................................................................................................8
Equity Valuation..............................................................................................................................8
Divisional Analysis......................................................................................................................8
Bibliography..................................................................................................................................10
2CORPORATE FINANCE
Executive Summary & Recommendation
The assignment has been done for the purpose of valuing and evaluating the acquisition of Seven
Group Holdings by TELYS4 Company. The valuation of the company has been specifically done
by well analyzing the cost of capital for the company, the cash flows that would be flowing to
the enterprise and the various components of TELYS4 Company Enterprise Value. The various
components of the Enterprise Value has been broadly classified by the company into two major
portion such as debt and equity financing which the company has used for financing the
operations. The various methods and application of important valuation and analysis terms like
ROIC, EV and Residual Income has well been considered for analysis purpose. The cost of
capital has been determined by taking the cost of equity and cost of debt for the company with
the help of the data that has been given to us for the purpose of analysis. The equity valuation of
the company has been well done with the help of dividend discount model whereby the share
price determined was around $114. The same has been well applied and used in valuing the
company based on the given terminal value. Finally the intrinsic share price of the company has
been calculated with the help of divisional analysis whereby all the important divisions that
operates in the company were analyzed and multiplied with the multiples values that has been
taken from the competitor company. On a combined value the intrinsic share price was
determined to be around $76.41 however the share price offered for the conversion is around
$92.00 thus it is recommended that the investors should well accept the offer.
⊘ This is a preview!⊘
Do you want full access?
Subscribe today to unlock all pages.
Trusted by 1+ million students worldwide
3CORPORATE FINANCE
Enterprise Value and Governance
Components of Enterprise Value
The key component of the SVW’s Enterprise Value has been well analysed with the help
of the value of the company by including the various sources of finance such as short-term long-
term debt and cash & cash equivalents that has been used by the company. The key formula
which has been applied for the purpose of computing the Enterprise Value is as follows:
Enterprise Value: Market value of Debt + Market Value of Equity
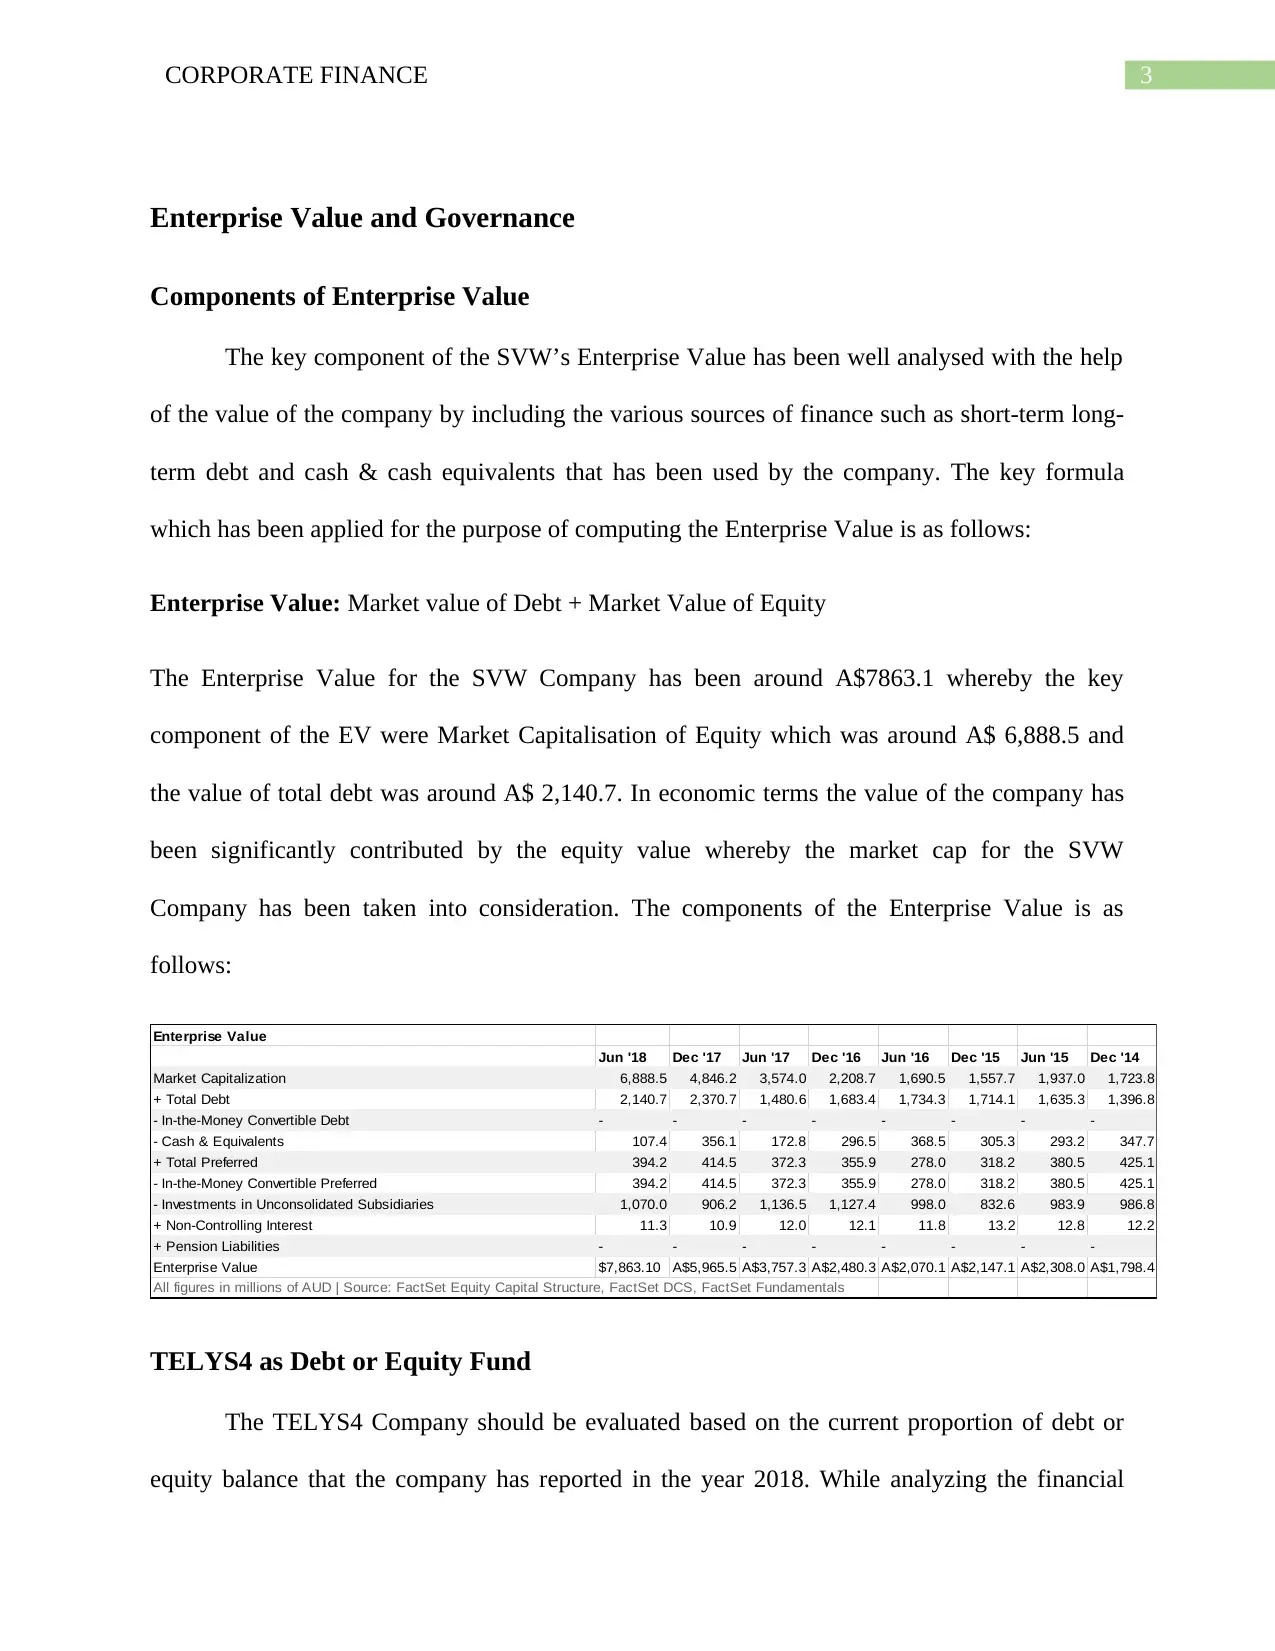
The Enterprise Value for the SVW Company has been around A$7863.1 whereby the key
component of the EV were Market Capitalisation of Equity which was around A$ 6,888.5 and
the value of total debt was around A$ 2,140.7. In economic terms the value of the company has
been significantly contributed by the equity value whereby the market cap for the SVW
Company has been taken into consideration. The components of the Enterprise Value is as
follows:
Enterprise Value
Jun '18 Dec '17 Jun '17 Dec '16 Jun '16 Dec '15 Jun '15 Dec '14
Market Capitalization 6,888.5 4,846.2 3,574.0 2,208.7 1,690.5 1,557.7 1,937.0 1,723.8
+ Total Debt 2,140.7 2,370.7 1,480.6 1,683.4 1,734.3 1,714.1 1,635.3 1,396.8
- In-the-Money Convertible Debt - - - - - - - -
- Cash & Equivalents 107.4 356.1 172.8 296.5 368.5 305.3 293.2 347.7
+ Total Preferred 394.2 414.5 372.3 355.9 278.0 318.2 380.5 425.1
- In-the-Money Convertible Preferred 394.2 414.5 372.3 355.9 278.0 318.2 380.5 425.1
- Investments in Unconsolidated Subsidiaries 1,070.0 906.2 1,136.5 1,127.4 998.0 832.6 983.9 986.8
+ Non-Controlling Interest 11.3 10.9 12.0 12.1 11.8 13.2 12.8 12.2
+ Pension Liabilities - - - - - - - -
Enterprise Value $7,863.10 A$5,965.5 A$3,757.3 A$2,480.3 A$2,070.1 A$2,147.1 A$2,308.0 A$1,798.4
All figures in millions of AUD | Source: FactSet Equity Capital Structure, FactSet DCS, FactSet Fundamentals
TELYS4 as Debt or Equity Fund
The TELYS4 Company should be evaluated based on the current proportion of debt or
equity balance that the company has reported in the year 2018. While analyzing the financial
Enterprise Value and Governance
Components of Enterprise Value
The key component of the SVW’s Enterprise Value has been well analysed with the help
of the value of the company by including the various sources of finance such as short-term long-
term debt and cash & cash equivalents that has been used by the company. The key formula
which has been applied for the purpose of computing the Enterprise Value is as follows:
Enterprise Value: Market value of Debt + Market Value of Equity
The Enterprise Value for the SVW Company has been around A$7863.1 whereby the key
component of the EV were Market Capitalisation of Equity which was around A$ 6,888.5 and
the value of total debt was around A$ 2,140.7. In economic terms the value of the company has
been significantly contributed by the equity value whereby the market cap for the SVW
Company has been taken into consideration. The components of the Enterprise Value is as
follows:
Enterprise Value
Jun '18 Dec '17 Jun '17 Dec '16 Jun '16 Dec '15 Jun '15 Dec '14
Market Capitalization 6,888.5 4,846.2 3,574.0 2,208.7 1,690.5 1,557.7 1,937.0 1,723.8
+ Total Debt 2,140.7 2,370.7 1,480.6 1,683.4 1,734.3 1,714.1 1,635.3 1,396.8
- In-the-Money Convertible Debt - - - - - - - -
- Cash & Equivalents 107.4 356.1 172.8 296.5 368.5 305.3 293.2 347.7
+ Total Preferred 394.2 414.5 372.3 355.9 278.0 318.2 380.5 425.1
- In-the-Money Convertible Preferred 394.2 414.5 372.3 355.9 278.0 318.2 380.5 425.1
- Investments in Unconsolidated Subsidiaries 1,070.0 906.2 1,136.5 1,127.4 998.0 832.6 983.9 986.8
+ Non-Controlling Interest 11.3 10.9 12.0 12.1 11.8 13.2 12.8 12.2
+ Pension Liabilities - - - - - - - -
Enterprise Value $7,863.10 A$5,965.5 A$3,757.3 A$2,480.3 A$2,070.1 A$2,147.1 A$2,308.0 A$1,798.4
All figures in millions of AUD | Source: FactSet Equity Capital Structure, FactSet DCS, FactSet Fundamentals
TELYS4 as Debt or Equity Fund
The TELYS4 Company should be evaluated based on the current proportion of debt or
equity balance that the company has reported in the year 2018. While analyzing the financial
Paraphrase This Document
Need a fresh take? Get an instant paraphrase of this document with our AI Paraphraser
4CORPORATE FINANCE
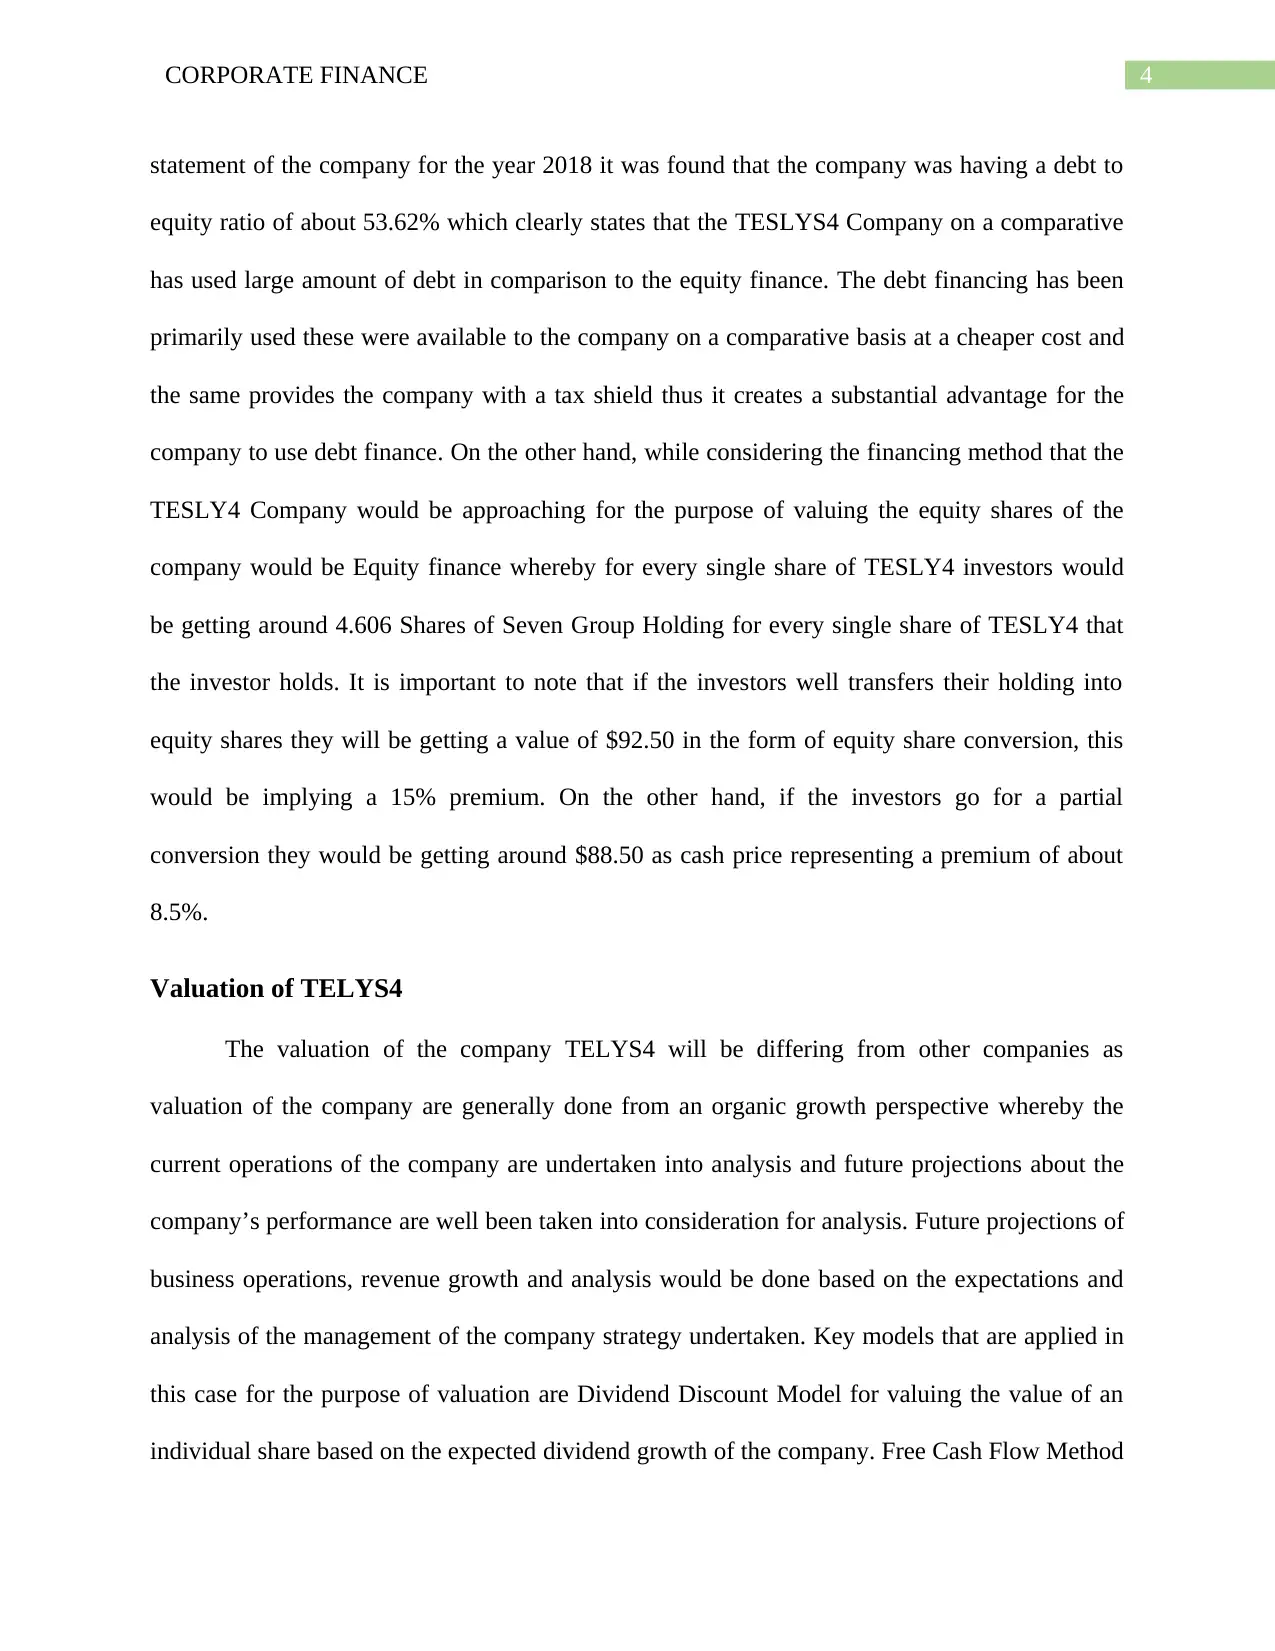
statement of the company for the year 2018 it was found that the company was having a debt to
equity ratio of about 53.62% which clearly states that the TESLYS4 Company on a comparative
has used large amount of debt in comparison to the equity finance. The debt financing has been
primarily used these were available to the company on a comparative basis at a cheaper cost and
the same provides the company with a tax shield thus it creates a substantial advantage for the
company to use debt finance. On the other hand, while considering the financing method that the
TESLY4 Company would be approaching for the purpose of valuing the equity shares of the
company would be Equity finance whereby for every single share of TESLY4 investors would
be getting around 4.606 Shares of Seven Group Holding for every single share of TESLY4 that
the investor holds. It is important to note that if the investors well transfers their holding into
equity shares they will be getting a value of $92.50 in the form of equity share conversion, this
would be implying a 15% premium. On the other hand, if the investors go for a partial
conversion they would be getting around $88.50 as cash price representing a premium of about
8.5%.
Valuation of TELYS4
The valuation of the company TELYS4 will be differing from other companies as
valuation of the company are generally done from an organic growth perspective whereby the
current operations of the company are undertaken into analysis and future projections about the
company’s performance are well been taken into consideration for analysis. Future projections of
business operations, revenue growth and analysis would be done based on the expectations and
analysis of the management of the company strategy undertaken. Key models that are applied in
this case for the purpose of valuation are Dividend Discount Model for valuing the value of an
individual share based on the expected dividend growth of the company. Free Cash Flow Method
5CORPORATE FINANCE
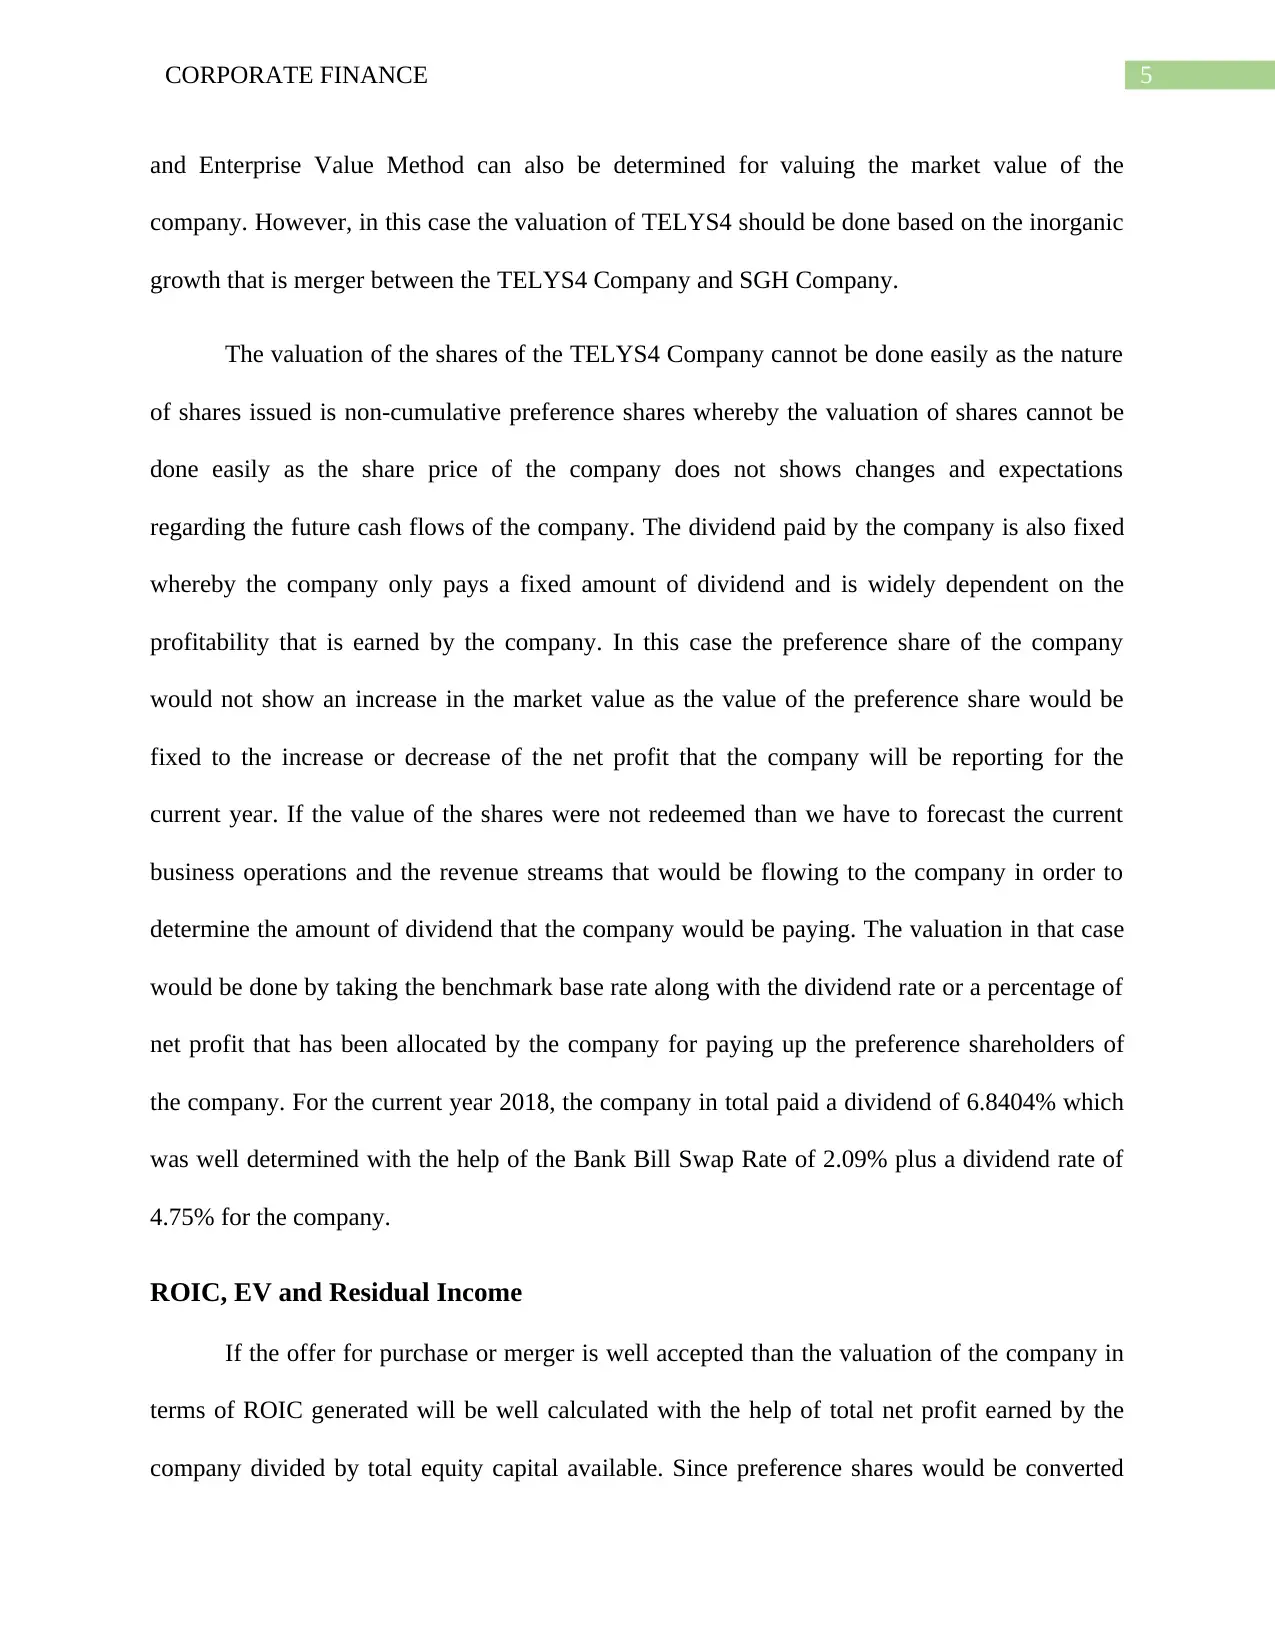
and Enterprise Value Method can also be determined for valuing the market value of the
company. However, in this case the valuation of TELYS4 should be done based on the inorganic
growth that is merger between the TELYS4 Company and SGH Company.
The valuation of the shares of the TELYS4 Company cannot be done easily as the nature
of shares issued is non-cumulative preference shares whereby the valuation of shares cannot be
done easily as the share price of the company does not shows changes and expectations
regarding the future cash flows of the company. The dividend paid by the company is also fixed
whereby the company only pays a fixed amount of dividend and is widely dependent on the
profitability that is earned by the company. In this case the preference share of the company
would not show an increase in the market value as the value of the preference share would be
fixed to the increase or decrease of the net profit that the company will be reporting for the
current year. If the value of the shares were not redeemed than we have to forecast the current
business operations and the revenue streams that would be flowing to the company in order to
determine the amount of dividend that the company would be paying. The valuation in that case
would be done by taking the benchmark base rate along with the dividend rate or a percentage of
net profit that has been allocated by the company for paying up the preference shareholders of
the company. For the current year 2018, the company in total paid a dividend of 6.8404% which
was well determined with the help of the Bank Bill Swap Rate of 2.09% plus a dividend rate of
4.75% for the company.
ROIC, EV and Residual Income
If the offer for purchase or merger is well accepted than the valuation of the company in
terms of ROIC generated will be well calculated with the help of total net profit earned by the
company divided by total equity capital available. Since preference shares would be converted
⊘ This is a preview!⊘
Do you want full access?
Subscribe today to unlock all pages.
Trusted by 1+ million students worldwide
6CORPORATE FINANCE
into equity shares the company would not be liable to pay any amount to the equity shareholders
of the company and the whole of the amount that is the net profit value will be attributed to
equity shareholders. However, it is important that the Enterprise Value will be well calculated
with the help of following formula:
EV: Market Value of Equity + Debt + Minority shares + preferred equity – Cash and Cash
Equivalents.
Residual Income on the other hand will be calculated for the TELYS4 Company with the
help of the total free cash flows available for the capital holders less value of preference shares,
less value of debt and equity shares for the firm. The value that would be finally remaining with
the firm after paying of all the capital holders their share of income would be residual income
and the same case or approach would be applied for the purpose of valuing the TELYS4
Company shares.
Cost of Capital and Security Valuation
Implied Beta and Cost of Capital
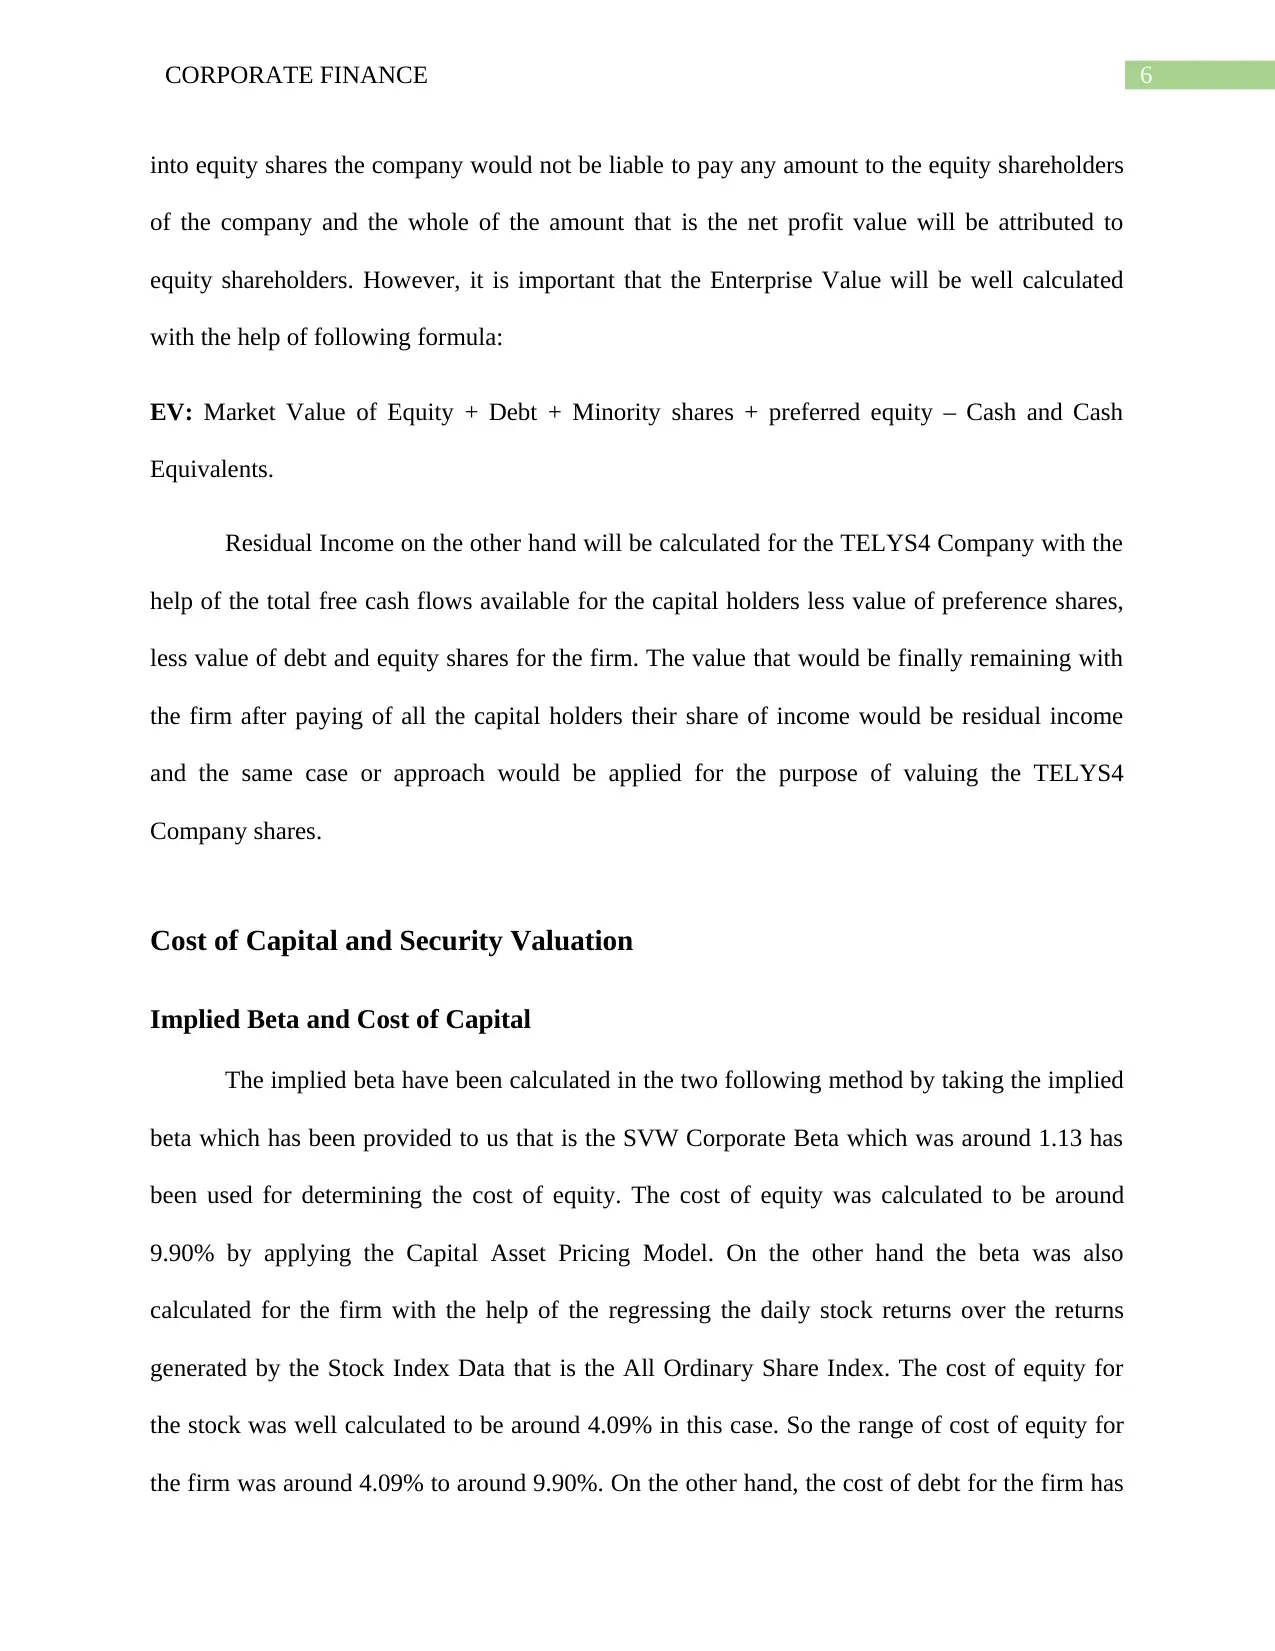
The implied beta have been calculated in the two following method by taking the implied
beta which has been provided to us that is the SVW Corporate Beta which was around 1.13 has
been used for determining the cost of equity. The cost of equity was calculated to be around
9.90% by applying the Capital Asset Pricing Model. On the other hand the beta was also
calculated for the firm with the help of the regressing the daily stock returns over the returns
generated by the Stock Index Data that is the All Ordinary Share Index. The cost of equity for
the stock was well calculated to be around 4.09% in this case. So the range of cost of equity for
the firm was around 4.09% to around 9.90%. On the other hand, the cost of debt for the firm has
into equity shares the company would not be liable to pay any amount to the equity shareholders
of the company and the whole of the amount that is the net profit value will be attributed to
equity shareholders. However, it is important that the Enterprise Value will be well calculated
with the help of following formula:
EV: Market Value of Equity + Debt + Minority shares + preferred equity – Cash and Cash
Equivalents.
Residual Income on the other hand will be calculated for the TELYS4 Company with the
help of the total free cash flows available for the capital holders less value of preference shares,
less value of debt and equity shares for the firm. The value that would be finally remaining with
the firm after paying of all the capital holders their share of income would be residual income
and the same case or approach would be applied for the purpose of valuing the TELYS4
Company shares.
Cost of Capital and Security Valuation
Implied Beta and Cost of Capital
The implied beta have been calculated in the two following method by taking the implied
beta which has been provided to us that is the SVW Corporate Beta which was around 1.13 has
been used for determining the cost of equity. The cost of equity was calculated to be around
9.90% by applying the Capital Asset Pricing Model. On the other hand the beta was also
calculated for the firm with the help of the regressing the daily stock returns over the returns
generated by the Stock Index Data that is the All Ordinary Share Index. The cost of equity for
the stock was well calculated to be around 4.09% in this case. So the range of cost of equity for
the firm was around 4.09% to around 9.90%. On the other hand, the cost of debt for the firm has
Paraphrase This Document
Need a fresh take? Get an instant paraphrase of this document with our AI Paraphraser
7CORPORATE FINANCE
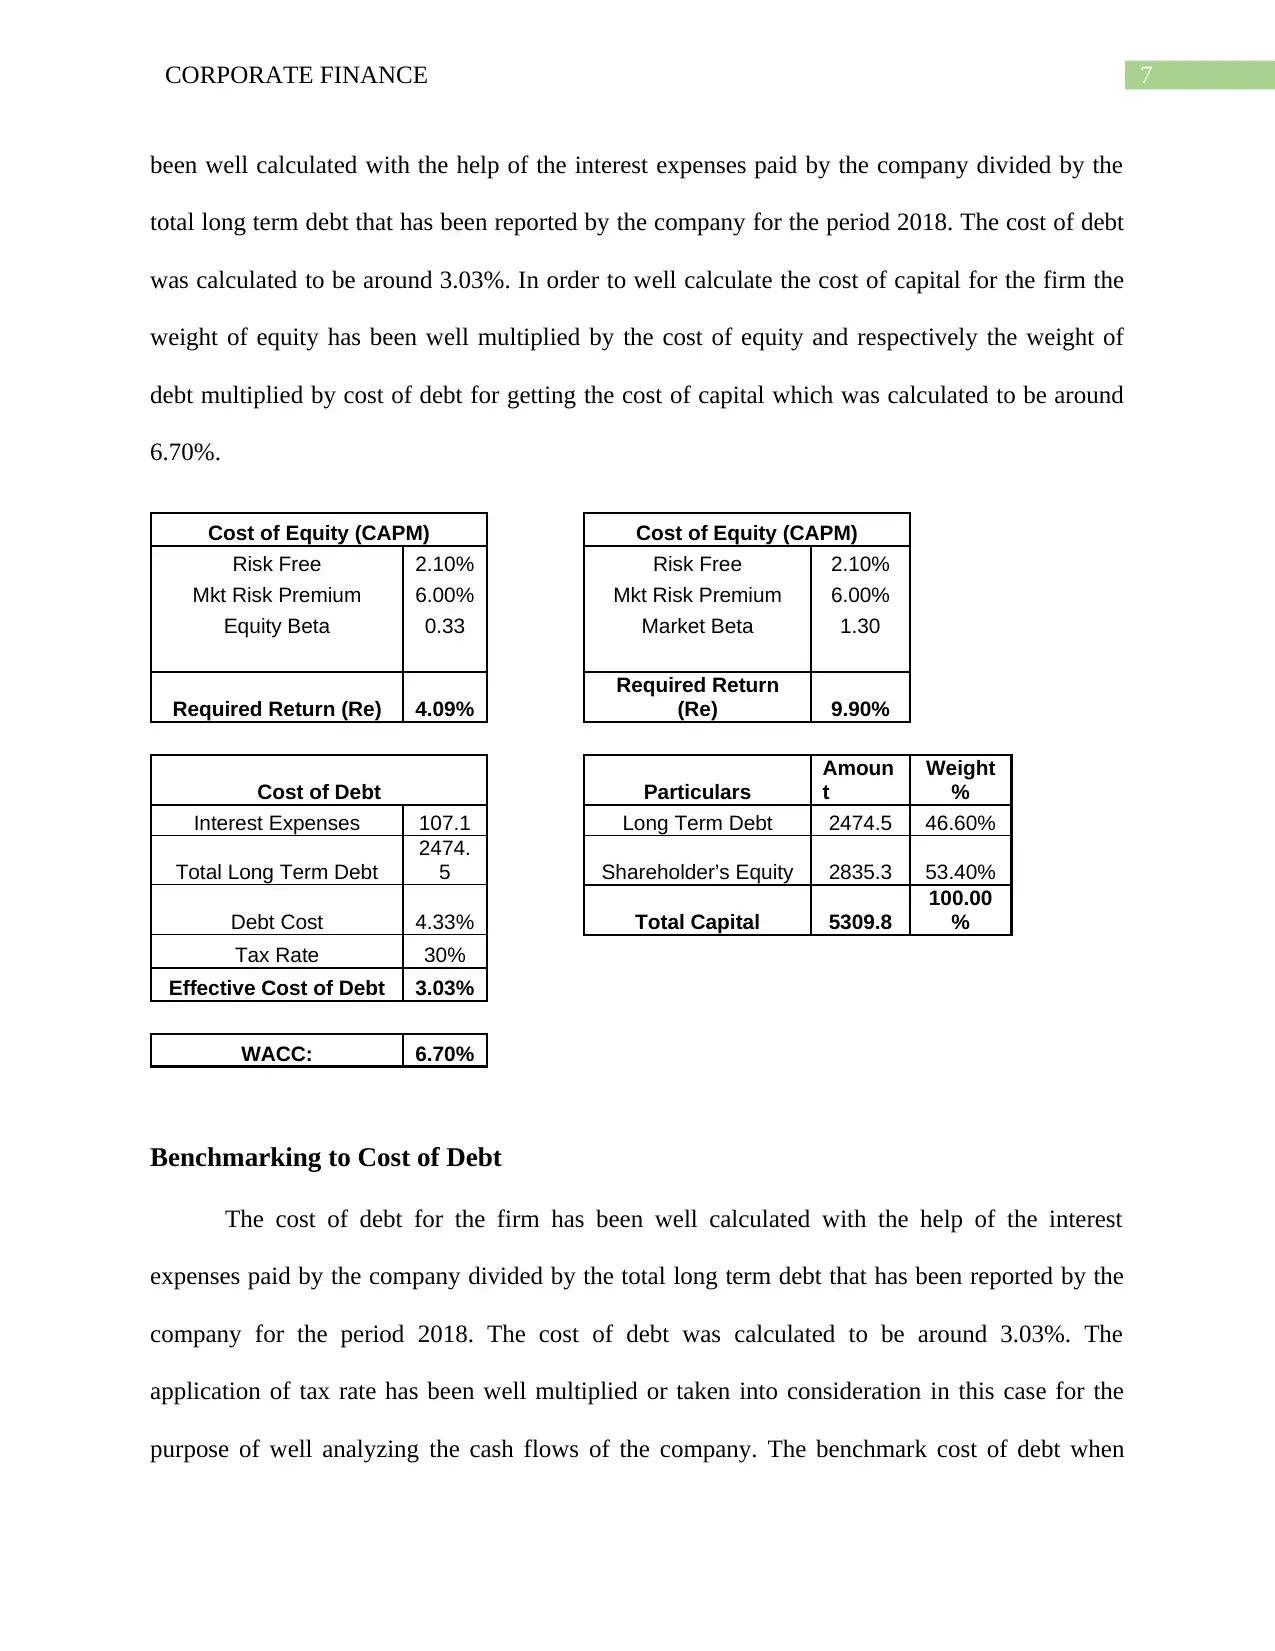
been well calculated with the help of the interest expenses paid by the company divided by the
total long term debt that has been reported by the company for the period 2018. The cost of debt
was calculated to be around 3.03%. In order to well calculate the cost of capital for the firm the
weight of equity has been well multiplied by the cost of equity and respectively the weight of
debt multiplied by cost of debt for getting the cost of capital which was calculated to be around
6.70%.
Cost of Equity (CAPM) Cost of Equity (CAPM)
Risk Free 2.10% Risk Free 2.10%
Mkt Risk Premium 6.00% Mkt Risk Premium 6.00%
Equity Beta 0.33 Market Beta 1.30
Required Return (Re) 4.09%
Required Return
(Re) 9.90%
Cost of Debt Particulars
Amoun
t
Weight
%
Interest Expenses 107.1 Long Term Debt 2474.5 46.60%
Total Long Term Debt
2474.
5 Shareholder’s Equity 2835.3 53.40%
Debt Cost 4.33% Total Capital 5309.8
100.00
%
Tax Rate 30%
Effective Cost of Debt 3.03%
WACC: 6.70%
Benchmarking to Cost of Debt
The cost of debt for the firm has been well calculated with the help of the interest
expenses paid by the company divided by the total long term debt that has been reported by the
company for the period 2018. The cost of debt was calculated to be around 3.03%. The
application of tax rate has been well multiplied or taken into consideration in this case for the
purpose of well analyzing the cash flows of the company. The benchmark cost of debt when
8CORPORATE FINANCE
compared to the given data set for Corporate Spreads is comparatively low stating the company
might not be incurring high amount of expenses for debt capital taken or considered.
Equity Valuation
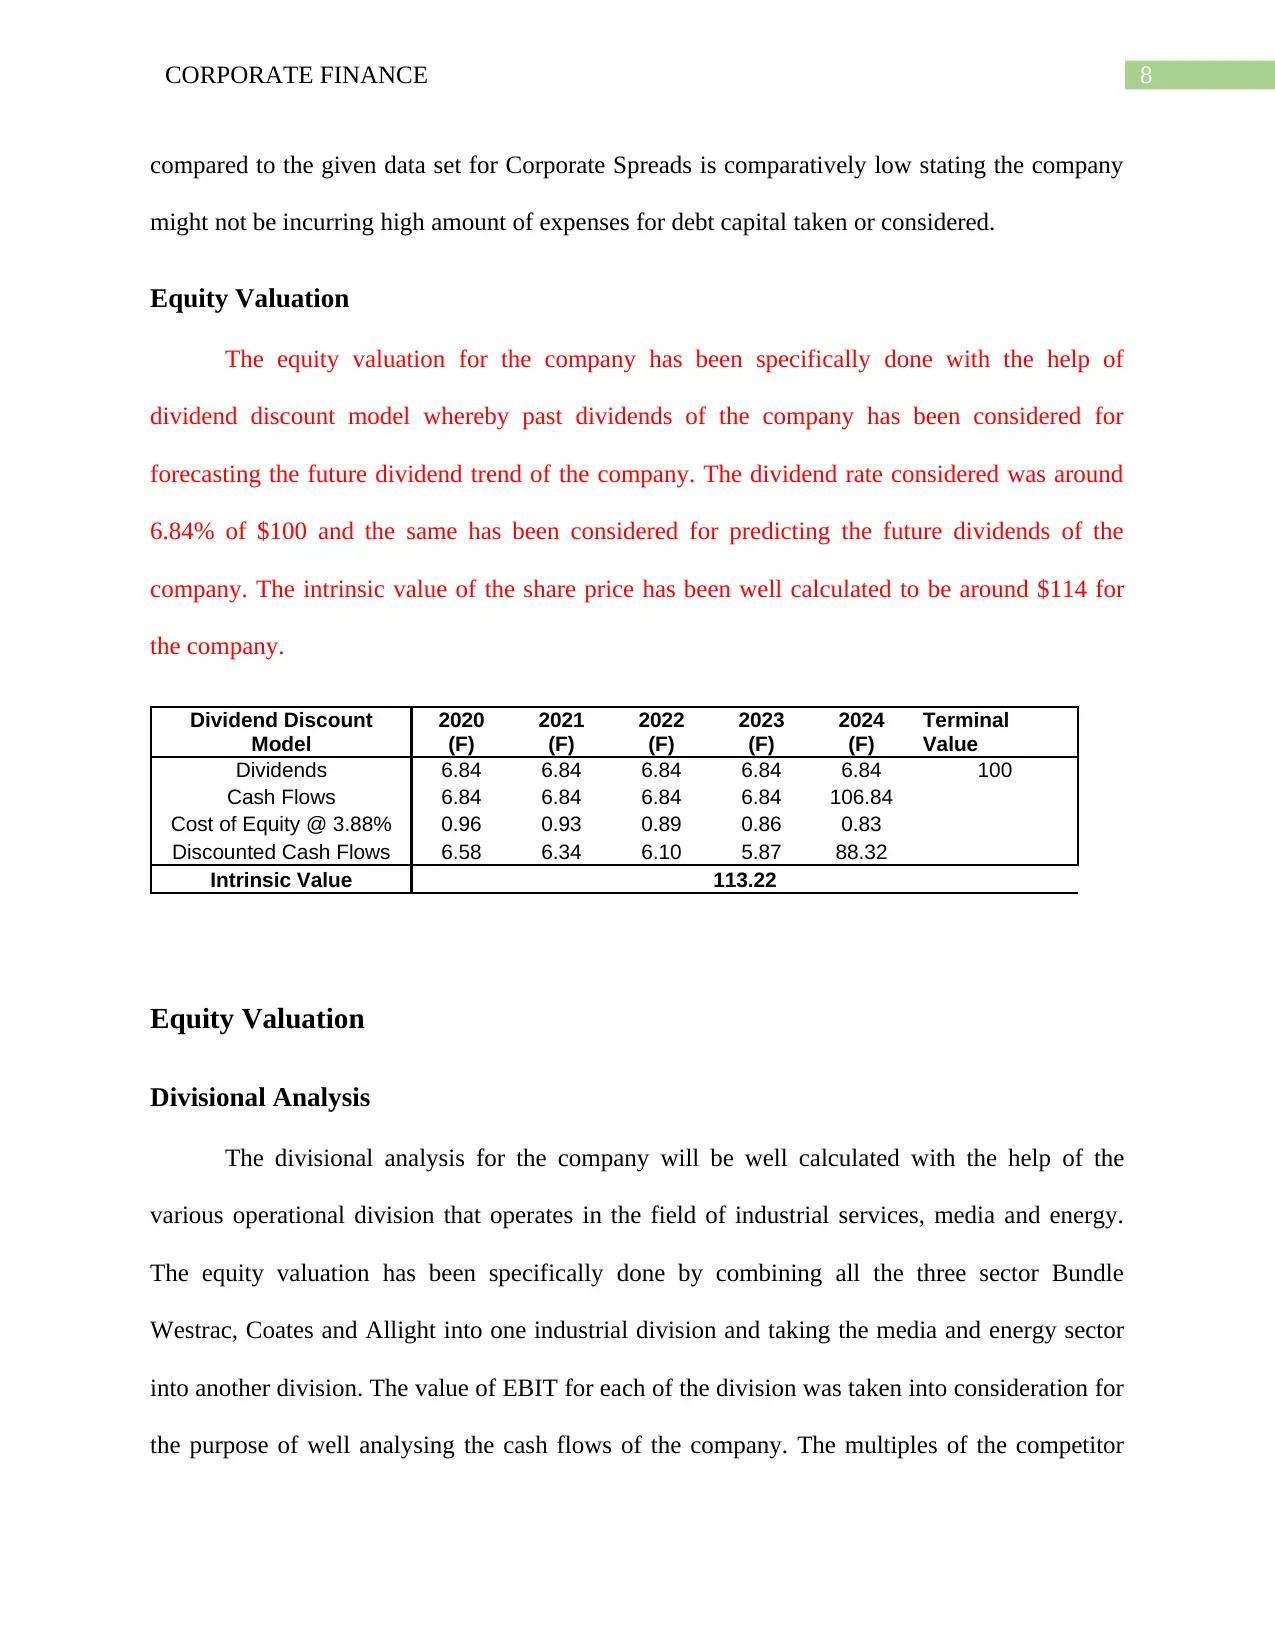
The equity valuation for the company has been specifically done with the help of
dividend discount model whereby past dividends of the company has been considered for
forecasting the future dividend trend of the company. The dividend rate considered was around
6.84% of $100 and the same has been considered for predicting the future dividends of the
company. The intrinsic value of the share price has been well calculated to be around $114 for
the company.
Dividend Discount
Model
2020
(F)
2021
(F)
2022
(F)
2023
(F)
2024
(F)
Terminal
Value
Dividends 6.84 6.84 6.84 6.84 6.84 100
Cash Flows 6.84 6.84 6.84 6.84 106.84
Cost of Equity @ 3.88% 0.96 0.93 0.89 0.86 0.83
Discounted Cash Flows 6.58 6.34 6.10 5.87 88.32
Intrinsic Value 113.22
Equity Valuation
Divisional Analysis
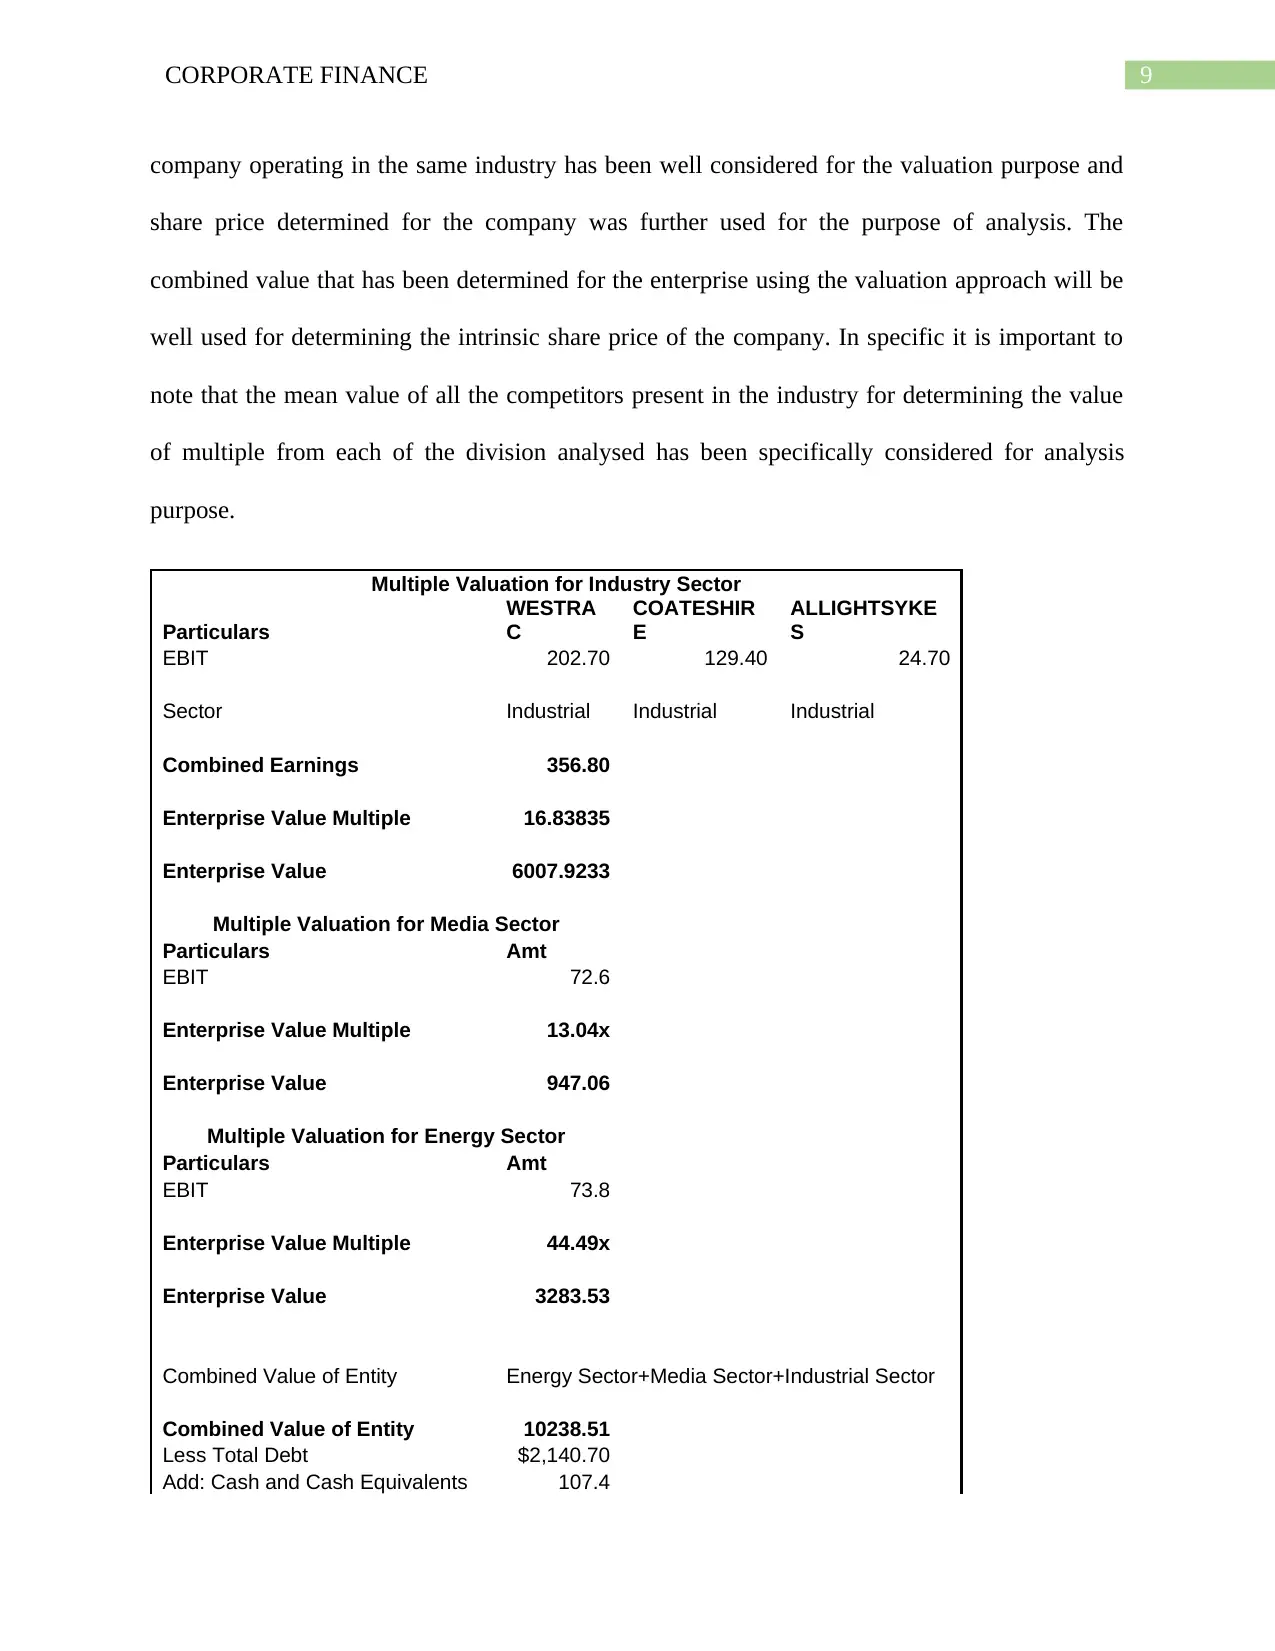
The divisional analysis for the company will be well calculated with the help of the
various operational division that operates in the field of industrial services, media and energy.
The equity valuation has been specifically done by combining all the three sector Bundle
Westrac, Coates and Allight into one industrial division and taking the media and energy sector
into another division. The value of EBIT for each of the division was taken into consideration for
the purpose of well analysing the cash flows of the company. The multiples of the competitor
compared to the given data set for Corporate Spreads is comparatively low stating the company
might not be incurring high amount of expenses for debt capital taken or considered.
Equity Valuation
The equity valuation for the company has been specifically done with the help of
dividend discount model whereby past dividends of the company has been considered for
forecasting the future dividend trend of the company. The dividend rate considered was around
6.84% of $100 and the same has been considered for predicting the future dividends of the
company. The intrinsic value of the share price has been well calculated to be around $114 for
the company.
Dividend Discount
Model
2020
(F)
2021
(F)
2022
(F)
2023
(F)
2024
(F)
Terminal
Value
Dividends 6.84 6.84 6.84 6.84 6.84 100
Cash Flows 6.84 6.84 6.84 6.84 106.84
Cost of Equity @ 3.88% 0.96 0.93 0.89 0.86 0.83
Discounted Cash Flows 6.58 6.34 6.10 5.87 88.32
Intrinsic Value 113.22
Equity Valuation
Divisional Analysis
The divisional analysis for the company will be well calculated with the help of the
various operational division that operates in the field of industrial services, media and energy.
The equity valuation has been specifically done by combining all the three sector Bundle
Westrac, Coates and Allight into one industrial division and taking the media and energy sector
into another division. The value of EBIT for each of the division was taken into consideration for
the purpose of well analysing the cash flows of the company. The multiples of the competitor
⊘ This is a preview!⊘
Do you want full access?
Subscribe today to unlock all pages.
Trusted by 1+ million students worldwide
9CORPORATE FINANCE
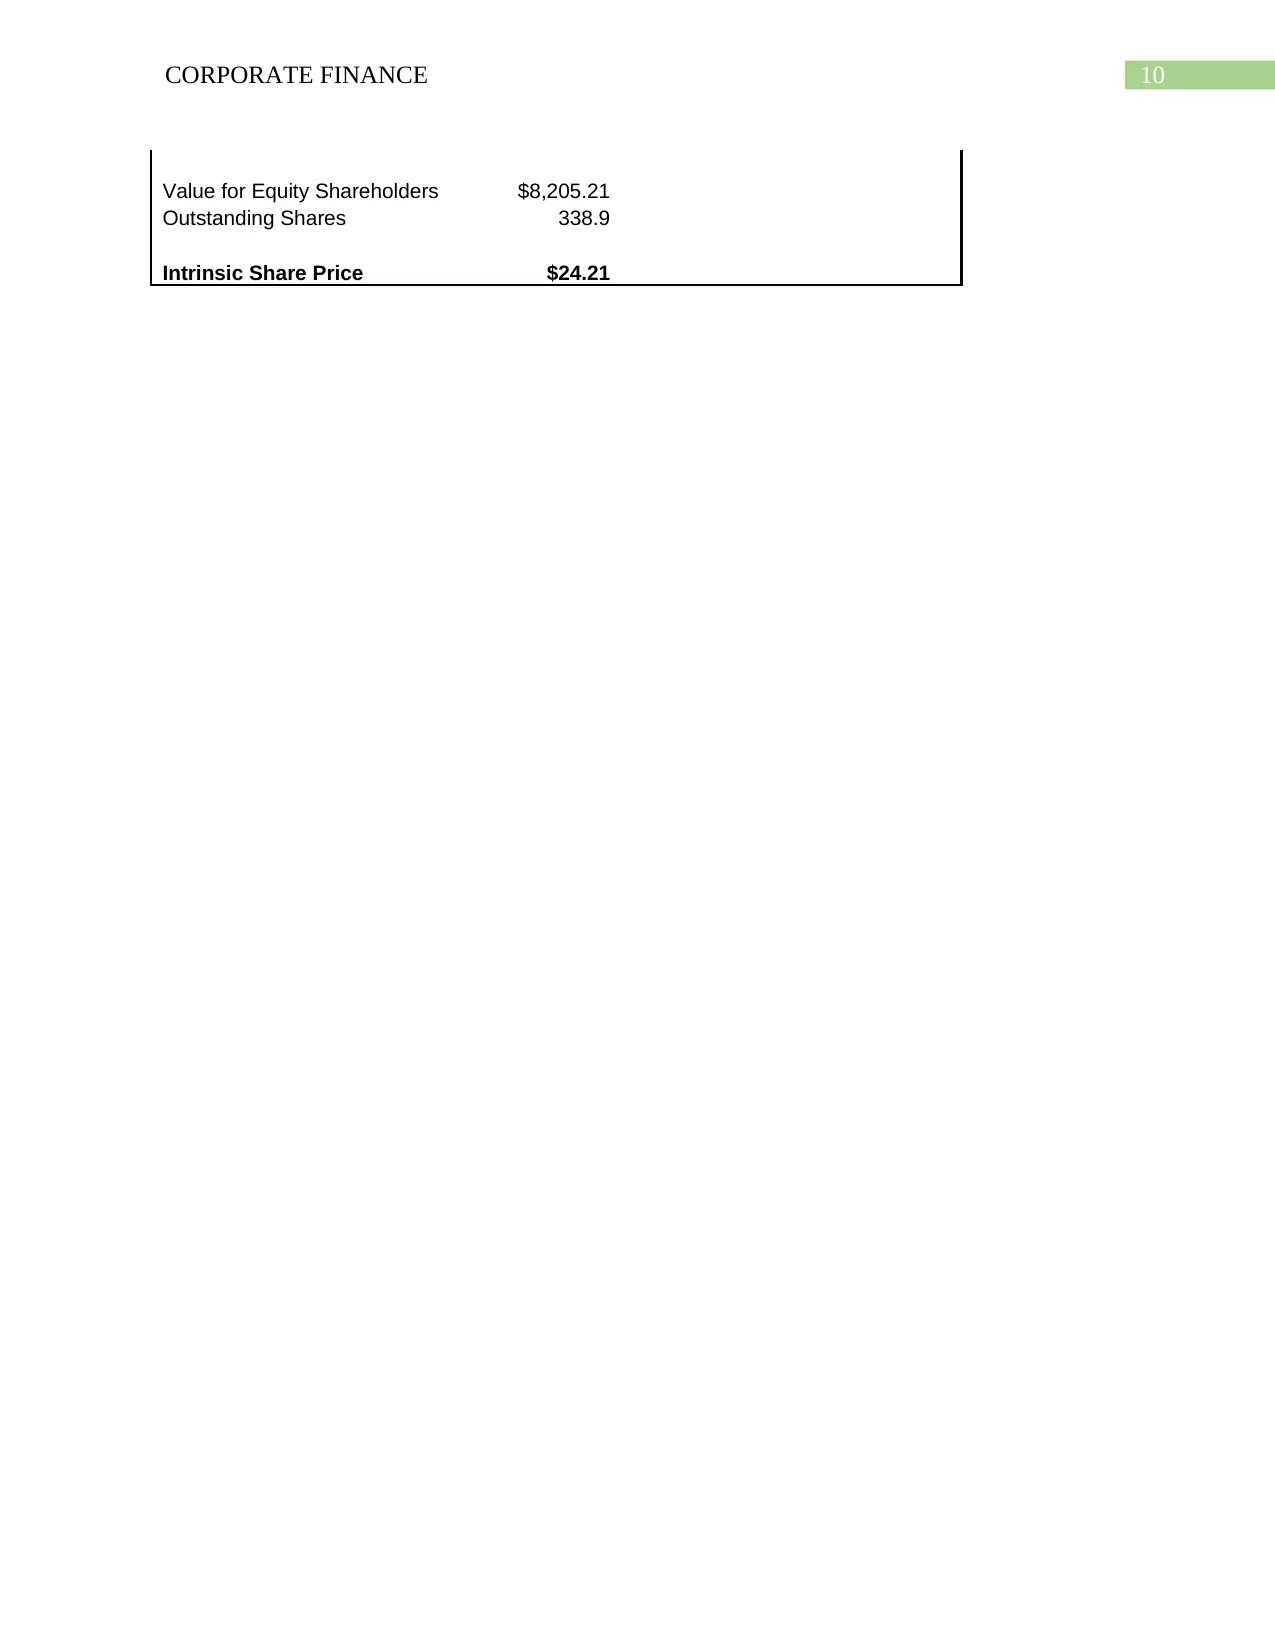
company operating in the same industry has been well considered for the valuation purpose and
share price determined for the company was further used for the purpose of analysis. The
combined value that has been determined for the enterprise using the valuation approach will be
well used for determining the intrinsic share price of the company. In specific it is important to
note that the mean value of all the competitors present in the industry for determining the value
of multiple from each of the division analysed has been specifically considered for analysis
purpose.
Multiple Valuation for Industry Sector
Particulars
WESTRA
C
COATESHIR
E
ALLIGHTSYKE
S
EBIT 202.70 129.40 24.70
Sector Industrial Industrial Industrial
Combined Earnings 356.80
Enterprise Value Multiple 16.83835
Enterprise Value 6007.9233
Multiple Valuation for Media Sector
Particulars Amt
EBIT 72.6
Enterprise Value Multiple 13.04x
Enterprise Value 947.06
Multiple Valuation for Energy Sector
Particulars Amt
EBIT 73.8
Enterprise Value Multiple 44.49x
Enterprise Value 3283.53
Combined Value of Entity Energy Sector+Media Sector+Industrial Sector
Combined Value of Entity 10238.51
Less Total Debt $2,140.70
Add: Cash and Cash Equivalents 107.4
Paraphrase This Document
Need a fresh take? Get an instant paraphrase of this document with our AI Paraphraser
10CORPORATE FINANCE
Value for Equity Shareholders $8,205.21
Outstanding Shares 338.9
Intrinsic Share Price $24.21
Value for Equity Shareholders $8,205.21
Outstanding Shares 338.9
Intrinsic Share Price $24.21
11CORPORATE FINANCE
Bibliography
Drobetz, W., El Ghoul, S., Guedhami, O. and Janzen, M., 2018. Policy uncertainty, investment,
and the cost of capital. Journal of Financial Stability, 39, pp.28-45.
Dutta, S. and Nezlobin, A., 2017. Information disclosure, firm growth, and the cost of
capital. Journal of Financial Economics, 123(2), pp.415-431.
El Ghoul, S., Guedhami, O., Kim, H. and Park, K., 2018. Corporate environmental responsibility
and the cost of capital: International evidence. Journal of Business Ethics, 149(2), pp.335-361.
Explanatory Memorandum 2020 Clients3.weblink.com.au. Available at:
https://clients3.weblink.com.au/pdf/SVW/02011938.pdf (Accessed: 20 February 2020).
Explanatory Memorandum 2020. Clients3.weblink.com.au. Available at:
https://clients3.weblink.com.au/pdf/SVW/02013765.pdf (Accessed: 20 February 2020).
Frank, M.Z. and Shen, T., 2016. Investment and the weighted average cost of capital. Journal of
Financial Economics, 119(2), pp.300-315.
Non-Cumulative Preference Shares (Stock) | Top Examples & Advantages (2019). Available at:
https://www.wallstreetmojo.com/non-cumulative-preference-shares/ (Accessed: 20 February
2020).
SEVEN GROUP HOLDINGS LIMITED (ASX:SVW) - News: SVW Seven Group Holdings Says
Transferable Extendable Listed Yield Shares Will Be Placed In..., 35791202, page-1 -
HotCopper | ASX Share Prices, Stock Market & Share Trading Forum (2020). Available at:
https://hotcopper.co.nz/threads/news-svw-seven-group-holdings-says-transferable-extendable-
⊘ This is a preview!⊘
Do you want full access?
Subscribe today to unlock all pages.
Trusted by 1+ million students worldwide
1 out of 13
Related Documents


Your All-in-One AI-Powered Toolkit for Academic Success.
+13062052269
info@desklib.com
Available 24*7 on WhatsApp / Email
![[object Object]](/_next/static/media/star-bottom.7253800d.svg)
Unlock your academic potential
Copyright © 2020–2026 A2Z Services. All Rights Reserved. Developed and managed by ZUCOL.