Data Analysis and Linear Forecasting: London Temperature Statistics
VerifiedAdded on 2023/06/09
|9
|1463
|70
Homework Assignment
AI Summary
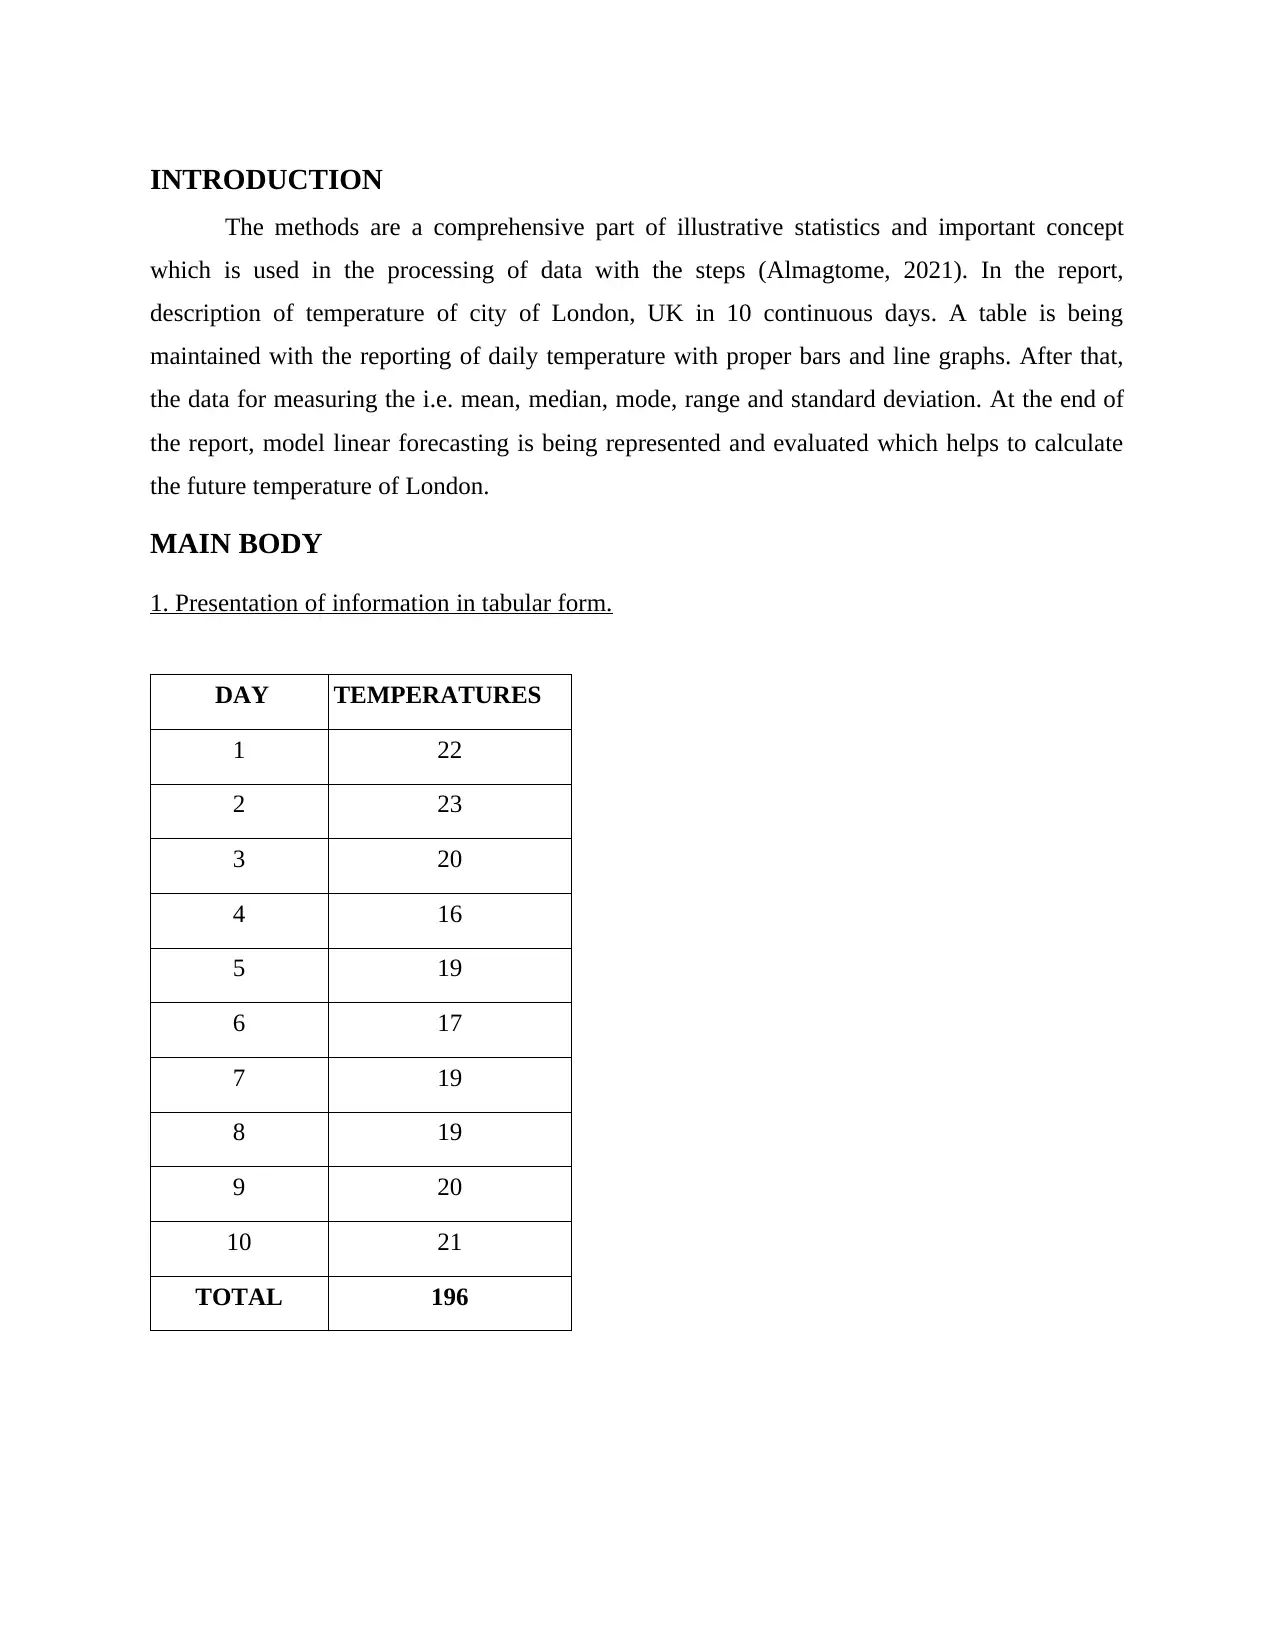
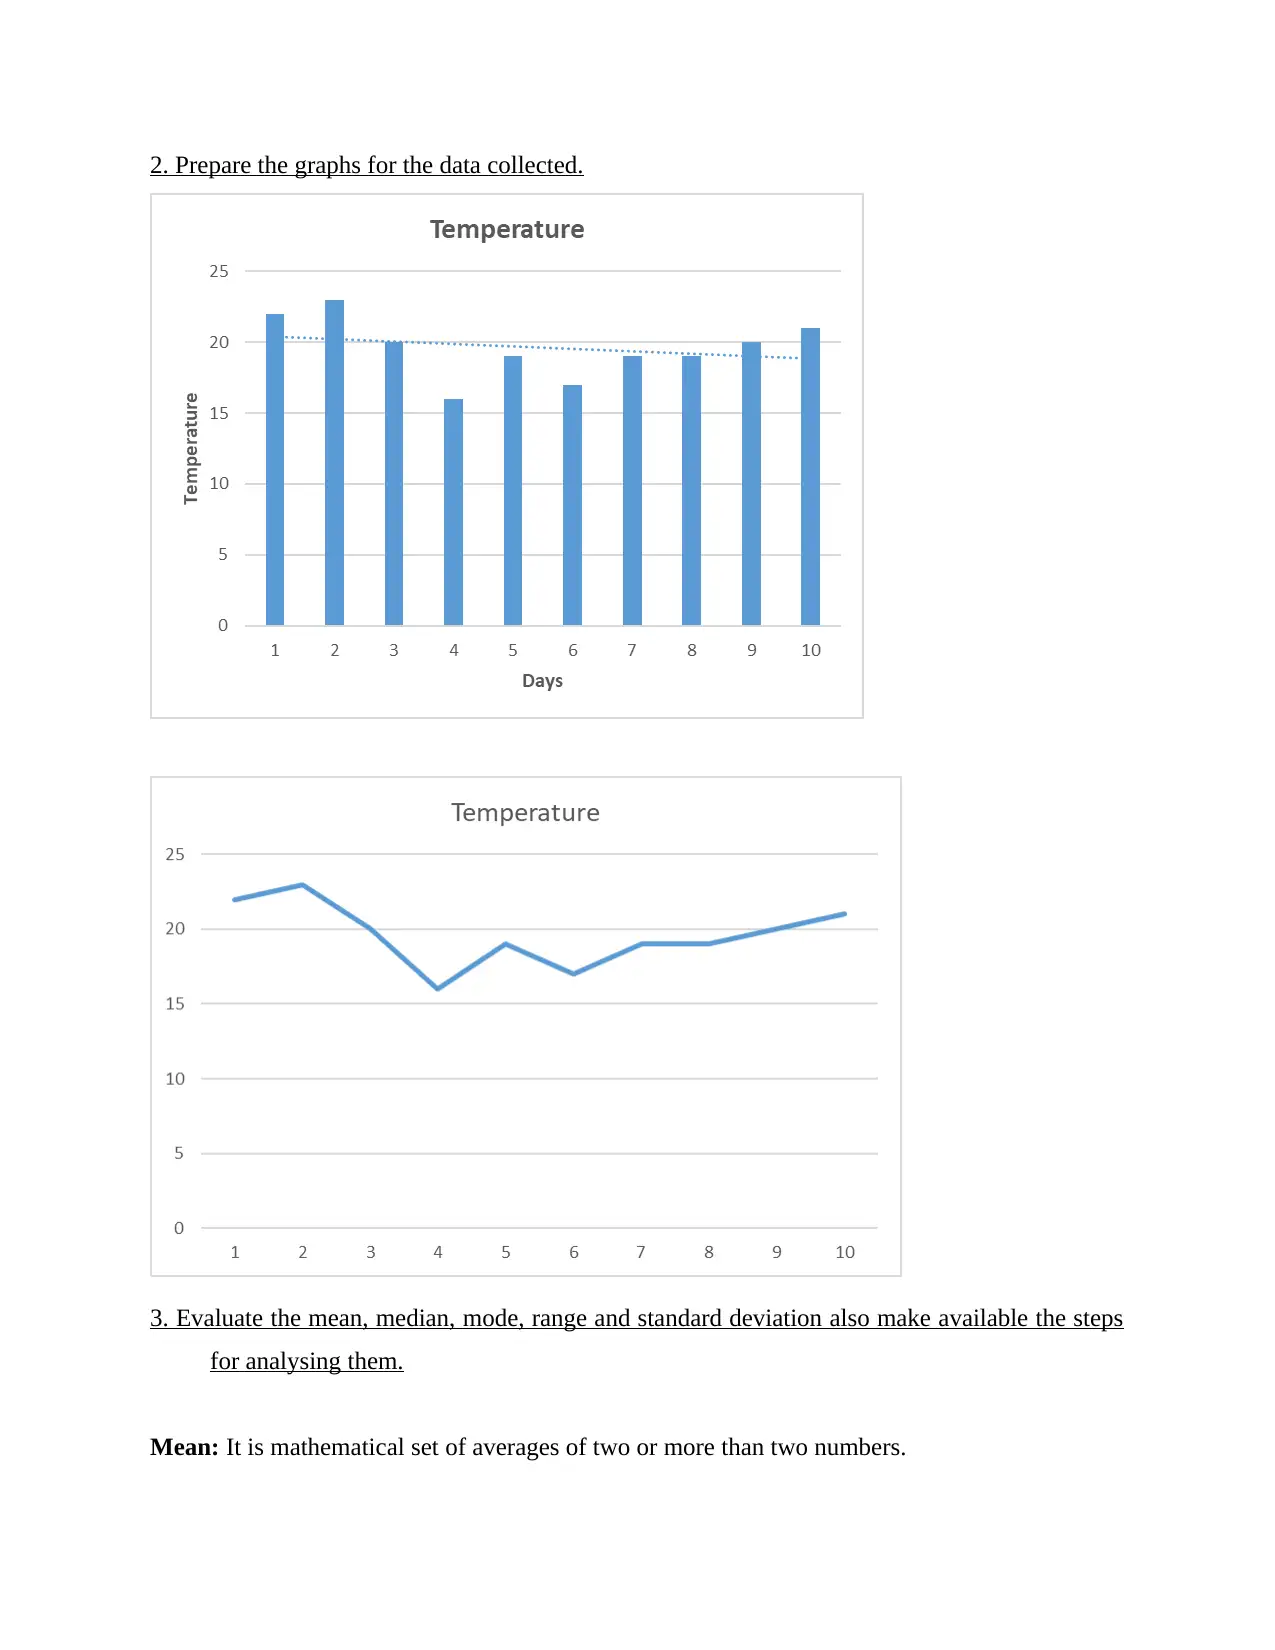
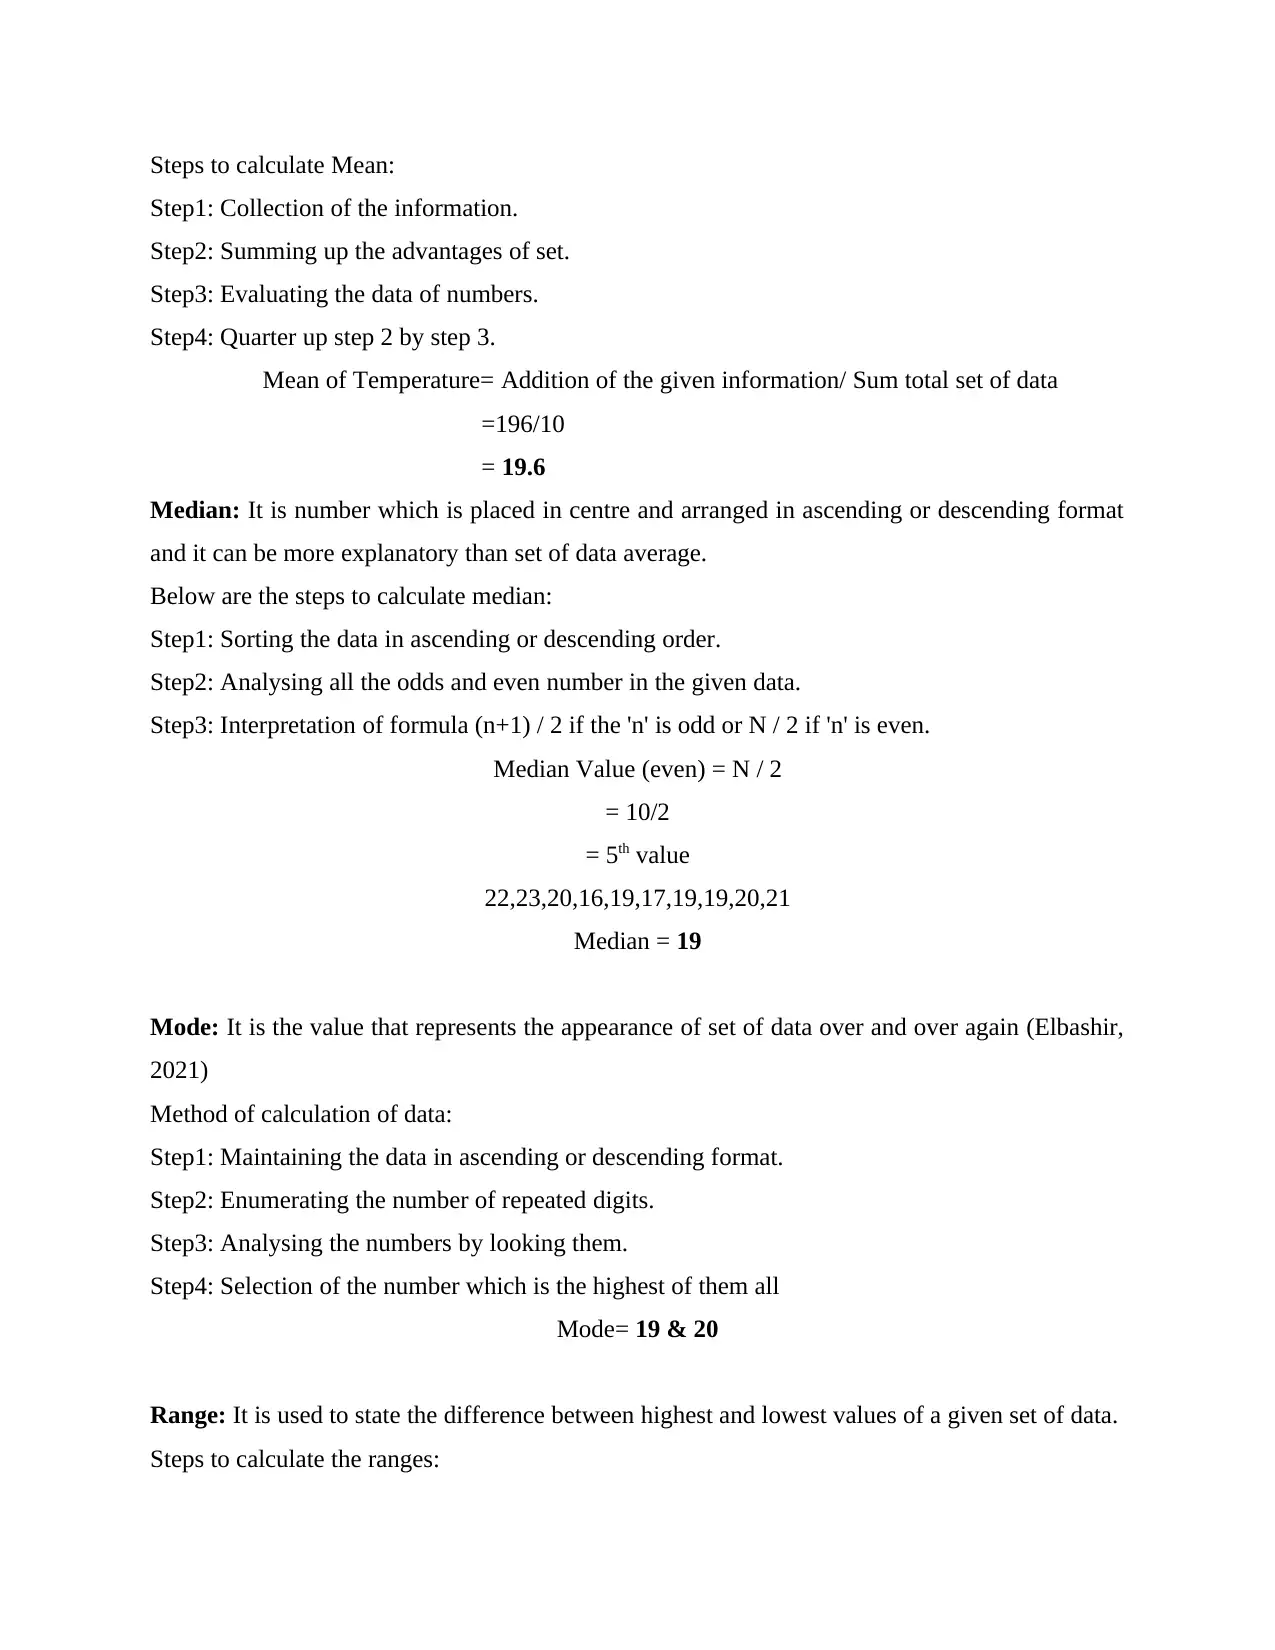
This assignment focuses on the statistical analysis of temperature data collected over ten days in London, UK. The solution begins with a presentation of the data in a tabular format, followed by the creation of relevant graphs to visualize the temperature trends. The core of the assignment involves calculating and interpreting various statistical measures including the mean, median, mode, range, and standard deviation. The steps for each calculation are clearly outlined. Furthermore, the assignment incorporates a linear forecasting model to predict future temperatures, specifically calculating the temperature for day 11 and day 14 based on the provided data and the derived values of 'm' and 'c' from the linear regression. The conclusion summarizes the findings and highlights the application of statistical tools in analyzing and forecasting temperature patterns.

Numeracy and Data
Analysis
Analysis
Paraphrase This Document
Need a fresh take? Get an instant paraphrase of this document with our AI Paraphraser

Table of Contents
INTRODUCTION...........................................................................................................................3
MAIN BODY...................................................................................................................................3
1. Presentation of information in tabular form.......................................................................3
2. Prepare the graphs for the data collected............................................................................4
3. Evaluate the mean, median, mode, range and standard deviation also make available the
steps for analysing them.........................................................................................................4
4. Analyse the value of 'm' and 'c' and represent the steps to be followed. By the Use of 'm'
and 'c' values, calculate the temperature for day 11 and day 14.............................................6
CONCLUSION................................................................................................................................8
REFERENCES................................................................................................................................9

INTRODUCTION
The methods are a comprehensive part of illustrative statistics and important concept
which is used in the processing of data with the steps (Almagtome, 2021). In the report,
description of temperature of city of London, UK in 10 continuous days. A table is being
maintained with the reporting of daily temperature with proper bars and line graphs. After that,
the data for measuring the i.e. mean, median, mode, range and standard deviation. At the end of
the report, model linear forecasting is being represented and evaluated which helps to calculate
the future temperature of London.
MAIN BODY
1. Presentation of information in tabular form.
DAY TEMPERATURES
1 22
2 23
3 20
4 16
5 19
6 17
7 19
8 19
9 20
10 21
TOTAL 196
⊘ This is a preview!⊘
Do you want full access?
Subscribe today to unlock all pages.

Trusted by 1+ million students worldwide

2. Prepare the graphs for the data collected.
3. Evaluate the mean, median, mode, range and standard deviation also make available the steps
for analysing them.
Mean: It is mathematical set of averages of two or more than two numbers.
3. Evaluate the mean, median, mode, range and standard deviation also make available the steps
for analysing them.
Mean: It is mathematical set of averages of two or more than two numbers.
Paraphrase This Document
Need a fresh take? Get an instant paraphrase of this document with our AI Paraphraser

Steps to calculate Mean:
Step1: Collection of the information.
Step2: Summing up the advantages of set.
Step3: Evaluating the data of numbers.
Step4: Quarter up step 2 by step 3.
Mean of Temperature= Addition of the given information/ Sum total set of data
=196/10
= 19.6
Median: It is number which is placed in centre and arranged in ascending or descending format
and it can be more explanatory than set of data average.
Below are the steps to calculate median:
Step1: Sorting the data in ascending or descending order.
Step2: Analysing all the odds and even number in the given data.
Step3: Interpretation of formula (n+1) / 2 if the 'n' is odd or N / 2 if 'n' is even.
Median Value (even) = N / 2
= 10/2
= 5th value
22,23,20,16,19,17,19,19,20,21
Median = 19
Mode: It is the value that represents the appearance of set of data over and over again (Elbashir,
2021)
Method of calculation of data:
Step1: Maintaining the data in ascending or descending format.
Step2: Enumerating the number of repeated digits.
Step3: Analysing the numbers by looking them.
Step4: Selection of the number which is the highest of them all
Mode= 19 & 20
Range: It is used to state the difference between highest and lowest values of a given set of data.
Steps to calculate the ranges:

Step1: Analyse the given data.
Step2: Selection of the highest or lowest value.
Step3: Deduct them.
Evaluating the Range of temperature:
Range= Highest – Lowest value
= 23-16
= 7
Standard Deviation: It is statistical data which is used to measure the diversion of the set of
data which is interrelated to mean and can be evaluated by the square root of the variation
(Topor, 2021).
Steps to calculate the standard deviations:
Step1: Start with the value of mean.
Step2: Find divergence from the mean.
Step3: Squaring of all deviations and finding the total sum.
Step4: Diverging the square from the total number of data.
Step5: Make square root of the outcome for the result.
Evaluation of standard deviation of temperature:
Standard deviation= √∑ (xi – μ) ^ 2 / N
4. Analyse the value of 'm' and 'c' and represent the steps to be followed. By the Use of 'm' and 'c'
values, calculate the temperature for day 11 and day 14.
Linear Forecasting Model: It is a statistical tool which is used to estimating future values on the
basis of past values (Weigand, Blums and Kruijff, 2018).
Steps to analyses the model are:
Step1: Evaluate the problem.
Step2: Collection of data should be done on the basis of survey.
Step3: Select the model which is most acceptable form.
Step4: Evaluation of the problem should be done carefully.
Y =mx + C
⊘ This is a preview!⊘
Do you want full access?
Subscribe today to unlock all pages.

Trusted by 1+ million students worldwide

where,'y' is the Dependent Factor,
'mx' is the Independent factor and
'c' is a constant factor.
Steps to calculate 'm':
Step1: Multiplication of total number of data with the variables of 'x' and 'y'.
Step2: Calculation of the sum of 'x' and 'y' and individually multiply them.
Step3: Evaluating the square of x with the total number of the data.
Step4: Calculating the sum of 'x' and squaring it up.
Step5: Deducting the step 2 from step 1.
Step6: After that, subtracting step 4 and step 3.
Step 7: In the end, Divergence of the value of Step 5 with Step 6.
= [(10* 1064) – (55 * 196)] / (10 * 385) – (55)2
= [10640 – 10780]/3850-110
= -140/3740
= -0.037
Method of calculating 'c’:-
Step1: Adding the values of 'y' variable.
Step2: Multiplying the value 'm' with the addition of the values of the 'x' variable.
Step4: Evaluating the difference between Step2 and Step1.
Step5: Evaluating the number of values (Youssef and Mahama, 2021).
Step6: Then dividing the outcome of step3 by step5.
=196*0.037(55)/10
C= 39.886
Temperature of Day 11:
Paraphrase This Document
Need a fresh take? Get an instant paraphrase of this document with our AI Paraphraser

m= 0.037, x=11, C =39.886
y = mx + C
0.037*11+39.886
y= 40.293
Temperature of Day 14:
m= 0.037, x=11, C= 40.293
y = mx + C
=0.037*14+40.293
y = 40.811
CONCLUSION
The table is being prepared for showing the temperature of 10 days with the help of
proper maintenance of bar graph, line graph which shows the data. The above calculation shows
the analysing of statistics of mean, median, mode, range and standard deviation of the city
London which provides the information in accordance to the averaging value of temperature and
represents where the data is located. In addition to find the temperature of day 11 and day 14, the
model of linear forecasting is being used for calculating the future temperatures of the city.
y = mx + C
0.037*11+39.886
y= 40.293
Temperature of Day 14:
m= 0.037, x=11, C= 40.293
y = mx + C
=0.037*14+40.293
y = 40.811
CONCLUSION
The table is being prepared for showing the temperature of 10 days with the help of
proper maintenance of bar graph, line graph which shows the data. The above calculation shows
the analysing of statistics of mean, median, mode, range and standard deviation of the city
London which provides the information in accordance to the averaging value of temperature and
represents where the data is located. In addition to find the temperature of day 11 and day 14, the
model of linear forecasting is being used for calculating the future temperatures of the city.

REFERENCES
Books and Journals
Almagtome, A.H., 2021. Artificial Intelligence Applications in Accounting and Financial
Reporting Systems: An International Perspective. In Handbook of Research on Applied
AI for International Business and Marketing Applications (pp. 540-558). IGI Global.
Elbashir, M.Z., and et.al., 2021. Unravelling the integrated information systems and management
control paradox: enhancing dynamic capability through business
intelligence. Accounting & Finance, 61. pp.1775-1814.
Kwilinski, A., 2019. Implementation of blockchain technology in accounting sphere. Academy
of Accounting and Financial Studies Journal, 23. pp.1-6.
Topor, D.I., and et.al.,2021. E-Accounting: Future Challenges and Perspectives. CSR and
Management Accounting Challenges in a Time of Global Crises. pp.35-52.
Weigand, H., Blums, I. and Kruijff, J.D., 2018, June. Shared ledger accounting-implementing the
economic exchange pattern in DL technology. In International Conference on Advanced
Information Systems Engineering (pp. 342-356). Springer, Cham.
Youssef, M.A.E.A. and Mahama, H., 2021. Does business intelligence mediate the relationship
between ERP and management accounting practices?. Journal of Accounting &
Organizational Change.
⊘ This is a preview!⊘
Do you want full access?
Subscribe today to unlock all pages.

Trusted by 1+ million students worldwide
1 out of 9
Related Documents

Your All-in-One AI-Powered Toolkit for Academic Success.
+13062052269
info@desklib.com
Available 24*7 on WhatsApp / Email
Unlock your academic potential
Copyright © 2020–2025 A2Z Services. All Rights Reserved. Developed and managed by ZUCOL.