Temperature Forecasting Report: Data Analysis using Linear Model

Verified

Added on  2023/06/14

|10
|1346
|411
Report
AI Summary
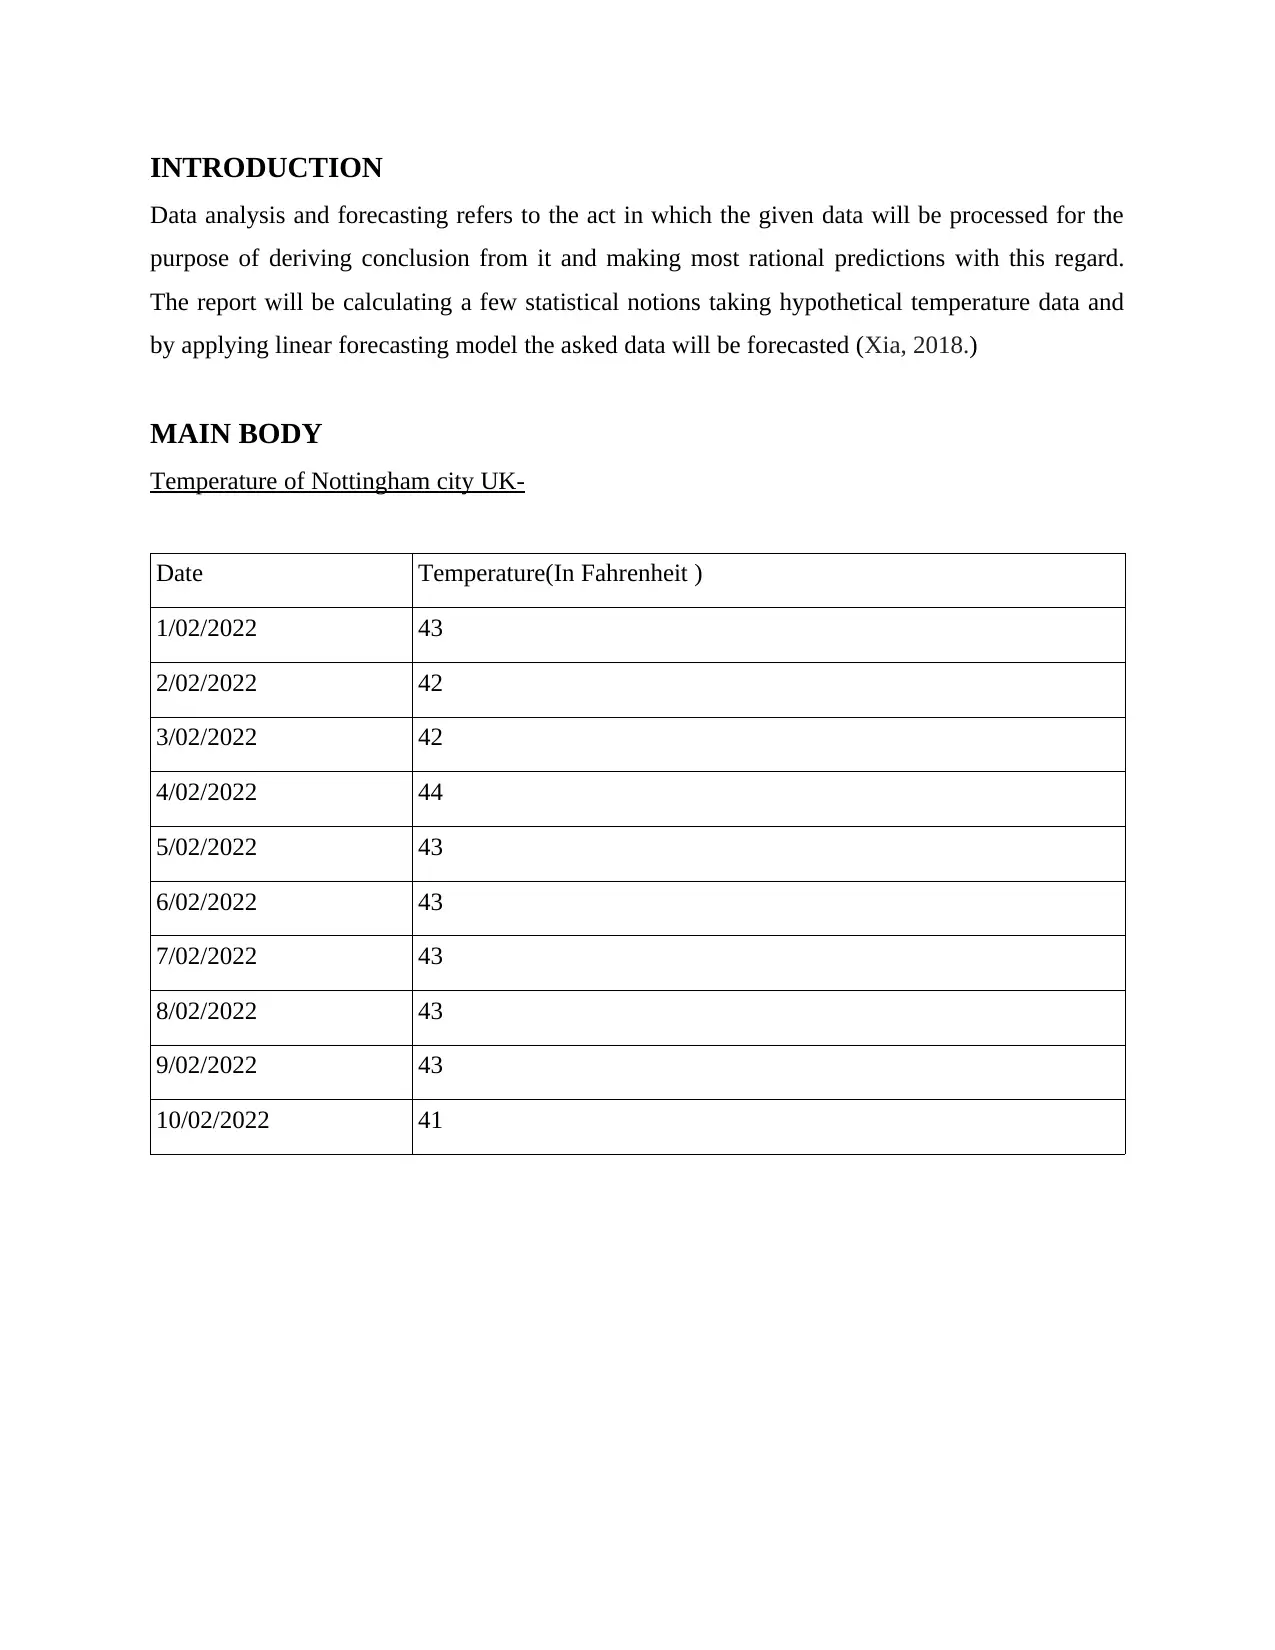
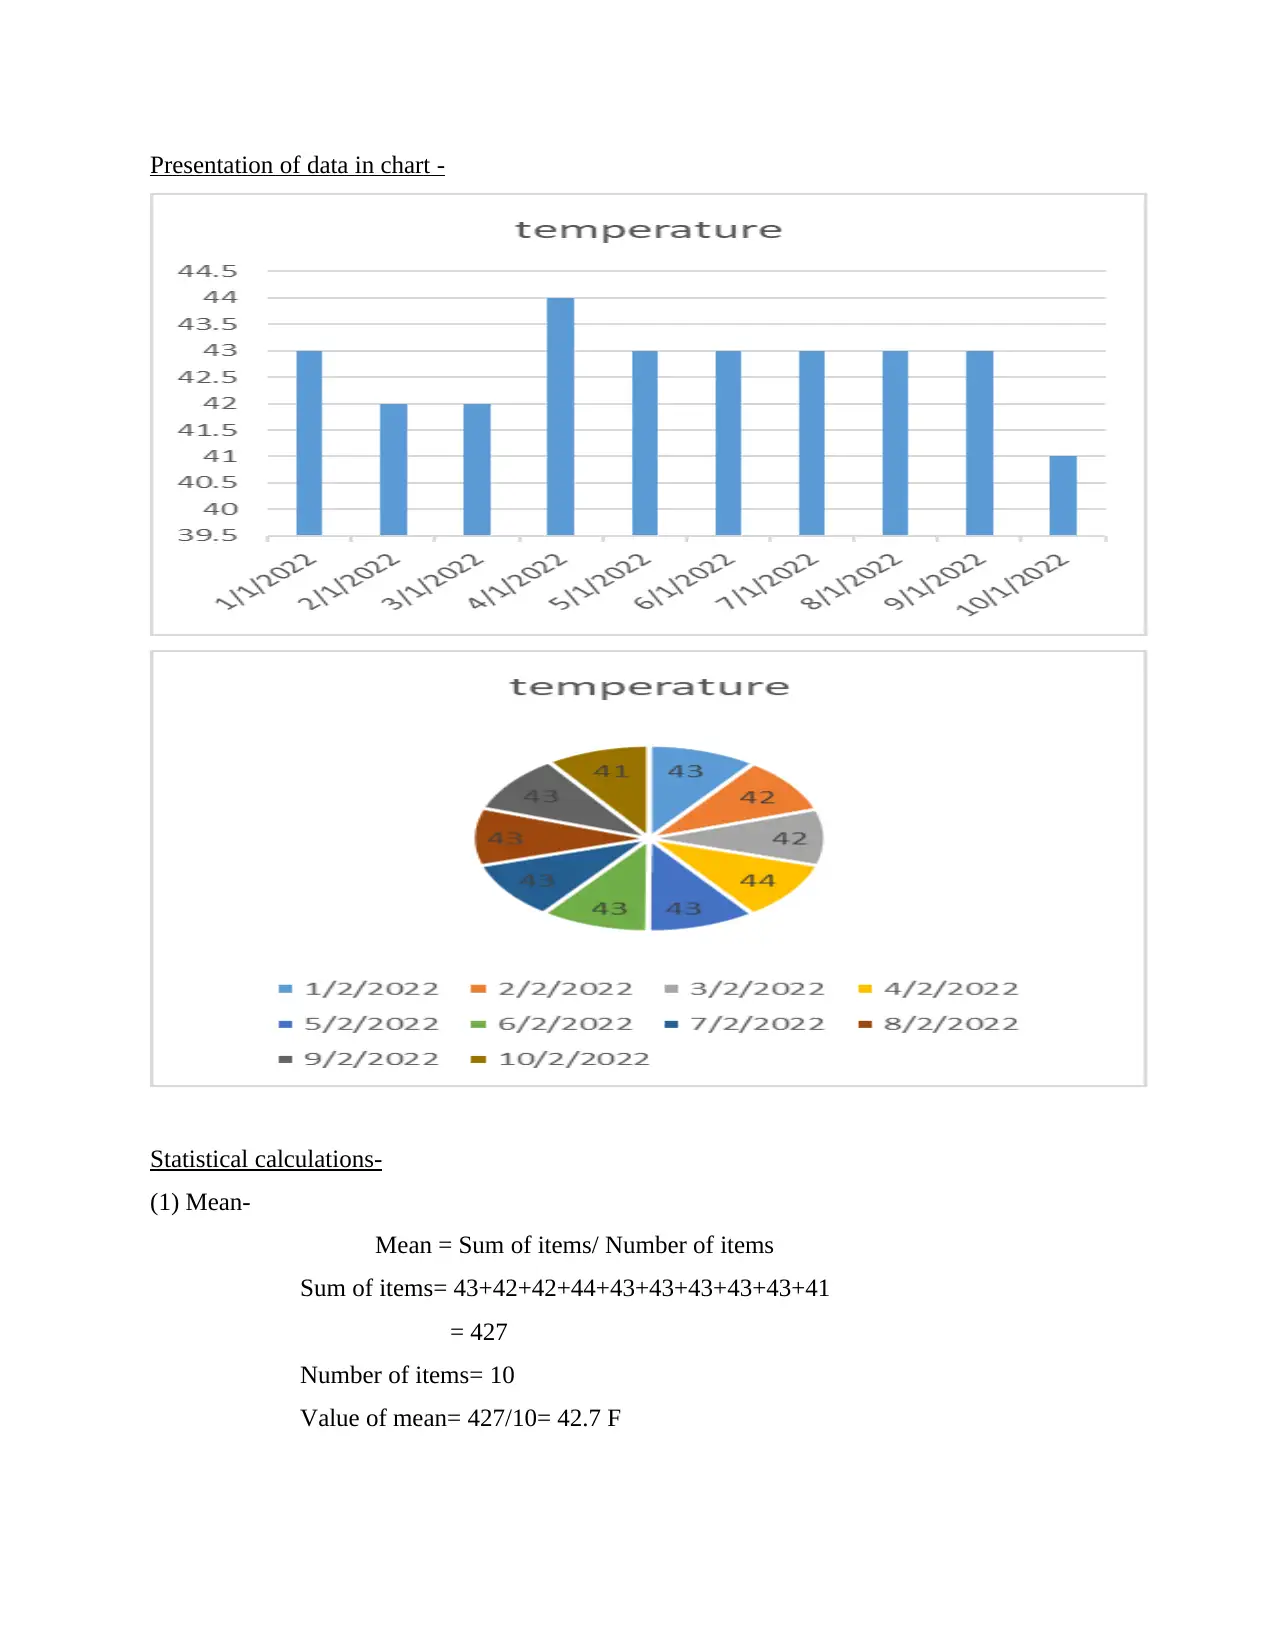
This report focuses on data analysis and forecasting, utilizing temperature data from Nottingham, UK. It involves statistical calculations such as mean, median, mode, range, and standard deviation to analyze the temperature patterns. A linear forecasting model is applied to predict temperatures for specific days, with a detailed explanation of the model's components and calculations. The report presents the data in a chart for better understanding and concludes with the forecasted temperature values.
Document Page
DATA ANALYSIS AND
FORECASTING
tabler-icon-diamond-filled.svg

Paraphrase This Document

Need a fresh take? Get an instant paraphrase of this document with our AI Paraphraser
Document Page
Table of Contents
INTRODUCTION...........................................................................................................................3
MAIN BODY...................................................................................................................................3
Temperature of Nottingham city UK-..........................................................................................3
Presentation of data in chart -......................................................................................................4
Statistical calculations-................................................................................................................4
Linear forecasting Model-............................................................................................................6
Forecasting of the temperature of 12th and 14th day-.................................................................8
CONCLUSION................................................................................................................................8
REFERENCES................................................................................................................................1
Document Page
INTRODUCTION
Data analysis and forecasting refers to the act in which the given data will be processed for the
purpose of deriving conclusion from it and making most rational predictions with this regard.
The report will be calculating a few statistical notions taking hypothetical temperature data and
by applying linear forecasting model the asked data will be forecasted (Xia, 2018.)
MAIN BODY
Temperature of Nottingham city UK-
Date Temperature(In Fahrenheit )
1/02/2022 43
2/02/2022 42
3/02/2022 42
4/02/2022 44
5/02/2022 43
6/02/2022 43
7/02/2022 43
8/02/2022 43
9/02/2022 43
10/02/2022 41
Document Page
Presentation of data in chart -
Statistical calculations-
(1) Mean-
Mean = Sum of items/ Number of items
Sum of items= 43+42+42+44+43+43+43+43+43+41
= 427
Number of items= 10
Value of mean= 427/10= 42.7 F
tabler-icon-diamond-filled.svg

Paraphrase This Document

Need a fresh take? Get an instant paraphrase of this document with our AI Paraphraser
Document Page
For figuring out the mean of the given temperature the data is firstly summed up and then
divided by the Number of items, in this case which is ten. The average or Mean of the
temperature is 42.7, which cites that the average temperature of the city in ten days has been
42.7.
(2) Median-
data are arranged in ascending order= 41,42,42,43,43,43,43,43,43,44
Median formula = (N+1)/2th item
N = Number of observations
= 10
= (10+1)/2th item
=5.5th item
= 43+43/2
Median= 43
The median of the given temperature is 43, which cites that the mid value of the temperature is
43 means the half temperature data would be above it and at the same time half would be below.
Since it is the prime duty of median to divide the series in two equal parts where one half will be
above and one half will be below the median value (Kihlblom Landtblom, 2018.)
(3) Mode= It is the individual series so we will be using observation method for calculating
Mode.
Mode= In the given observations the number with highest frequency will be the
mode.
Mode= 43
Since by normal observation it is figured out that the number 43 is being repeated for six times.
That's why it is considered Mode of the series. Mode express the understanding that in
Nottingham the highest frequency of the temperature is 43 in the last ten days.
(4) Range=
Range= Maximum value- Minimum value
44- 41
Range= 3
Document Page
Range signifies the value which express the range or diaspora of the given series. Which tells the
difference between maximum and minimum value. It also shown that what is the maximum
variability of the series. Here the range is 3, which explains that the temperature of Nottingham
in last ten days was not too much varying rather it was floating in the range 3 (Huang, 2021.)
(5) Standard deviation=
x Mean (x-mean) (x-mean)^2
43 42.7 0.3 0.09
42 42.7 -0.7 0.49
42 42.7 -0.7 0.49
44 42.7 1.3 1.69
43 42.7 0.3 0.09
43 42.7 0.3 0.09
43 42.7 0.3 0.09
43 42.7 0.3 0.09
43 42.7 0.3 0.09
41 42.7 -0.7 2.89
N=10 6.1
Standard deviation= total of (x- mean) ^2 /(N)
= 6.1/10
= 0.61
= under rood of 0.61
Standard deviation= 0.78102
standard deviation is the tool which measures that how dispersed the data is in relation to the
mean of the series. If it is close to zero that refers that the data is pointed close to the mean of the
series (Harrisson, 2018.)
Document Page
Linear forecasting Model-
y= mx + c
X Date Y XY x^2
1 1/02/2022 43 43 1
2 2/02/2022 42 84 4
3 3/02/2022 42 126 9
4 4/02/2022 44 176 16
5 5/02/2022 43 215 25
6 6/02/2022 43 258 36
7 7/02/2022 43 301 49
8 8/02/2022 43 344 64
9 9/02/2022 43 387 81
10 10/02/2022 41 410 100
55 427 2344 385
Calculation of m-
m =
m= (10*2344) - (55*427)/ (10*385) - (55) ^2
= (23440) - (23485)/3850-3025=
= -45/825
m= -0.0545
m is the slope of the line or it can also be defined as the gradient which defines the slope of the
line. For forecasting it is quite significant notion. Here in this case the value of m is figured out
by applying the given formula. The value of m is -0.0545 which explains that the slope is
negative then the relationship between factor X and Y would be adverse in nature. If X will be
increased, then the value of Y will be falling down due to adversity in relationship.
tabler-icon-diamond-filled.svg

Paraphrase This Document

Need a fresh take? Get an instant paraphrase of this document with our AI Paraphraser
Document Page
Calculation of C=
C=
= 427-(-0.0545*55)/10
= 427-(-2.99)/10
C= 43
here the value of C is calculated by applying the given formula. In linear forecasting model C is
a constraint value which can also be defined as intercept of Y. while calculating the value of
variable Y, the intercept c will be considered a constraint and will be summed up directly in the
calculated value. Since c is a constraint here which is defining the straight line of the linear
forecasting diagram (Ciulla and D'Amico, 2019.)
Forecasting of the temperature of 12th and 14th day-
Here the formula of linear forecasting method will be applied and the temperature of the asked
days will be calculated.
12th day-
y=mx + c
= -0.0545*12+43
= 42.346
the temperature of the day 12 would be 42.346F. The formula where Y is the dependent factor
and X is independent factor, m is representing slope of line which is negative in this case and c
which is constraint or intercept of y. The value of Y which is derived by these factors.
14th day-
y= mx + c
= -0.0545*14+43
= 42.237
the temperature of the day 14 would be 42.237. Which is lower than the temperature of 12th day.
Since as it is mentioned earlier the factor m is negative, which cites that if we will hike the value
of variable x then the y would get lower.
Document Page
CONCLUSION
In the report temperature data are taken for last ten days of Nottingham and then couple of
statistical formulas are applied in order to analyse it. Further-more the linear forecasting model is
applied for the purpose of forecasting the temperature of asked days. The report has presented
the taken data in a chart form for making it more receptive.
Document Page
REFERENCES
Xia, X., 2018. DAMBE7: New and improved tools for data analysis in molecular biology and
evolution. Molecular biology and evolution. 35(6). pp.1550-1552.
Kihlblom Landtblom, K., 2018. Prospective Teachers’ Conceptions of the Concepts Mean,
Median and Mode: Selected Papers from the 22nd MAVI Conference.
Huang, 2021. A Double-PLLs-Based Impedance Reshaping Method for Extending Stability
Range of Grid-Following Inverter Under Weak Grid. IEEE Transactions on Power
Electronics. 37(4). pp.4091-4104.
Harrisson, S., 2018. The downside of dispersity: why the standard deviation is a better measure
of dispersion in precision polymerization. Polymer Chemistry. 9(12). pp.1366-1370.
Ciulla, G. and D'Amico, A., 2019. Building energy performance forecasting: A multiple linear
regression approach. Applied Energy. 253. p.113500.
chevron_up_icon
1 out of 10
circle_padding
hide_on_mobile
zoom_out_icon
[object Object]