Data Analysis Report: Liverpool Temperature Forecasting and Analysis
VerifiedAdded on 2023/06/09
|9
|1424
|404
Report
AI Summary
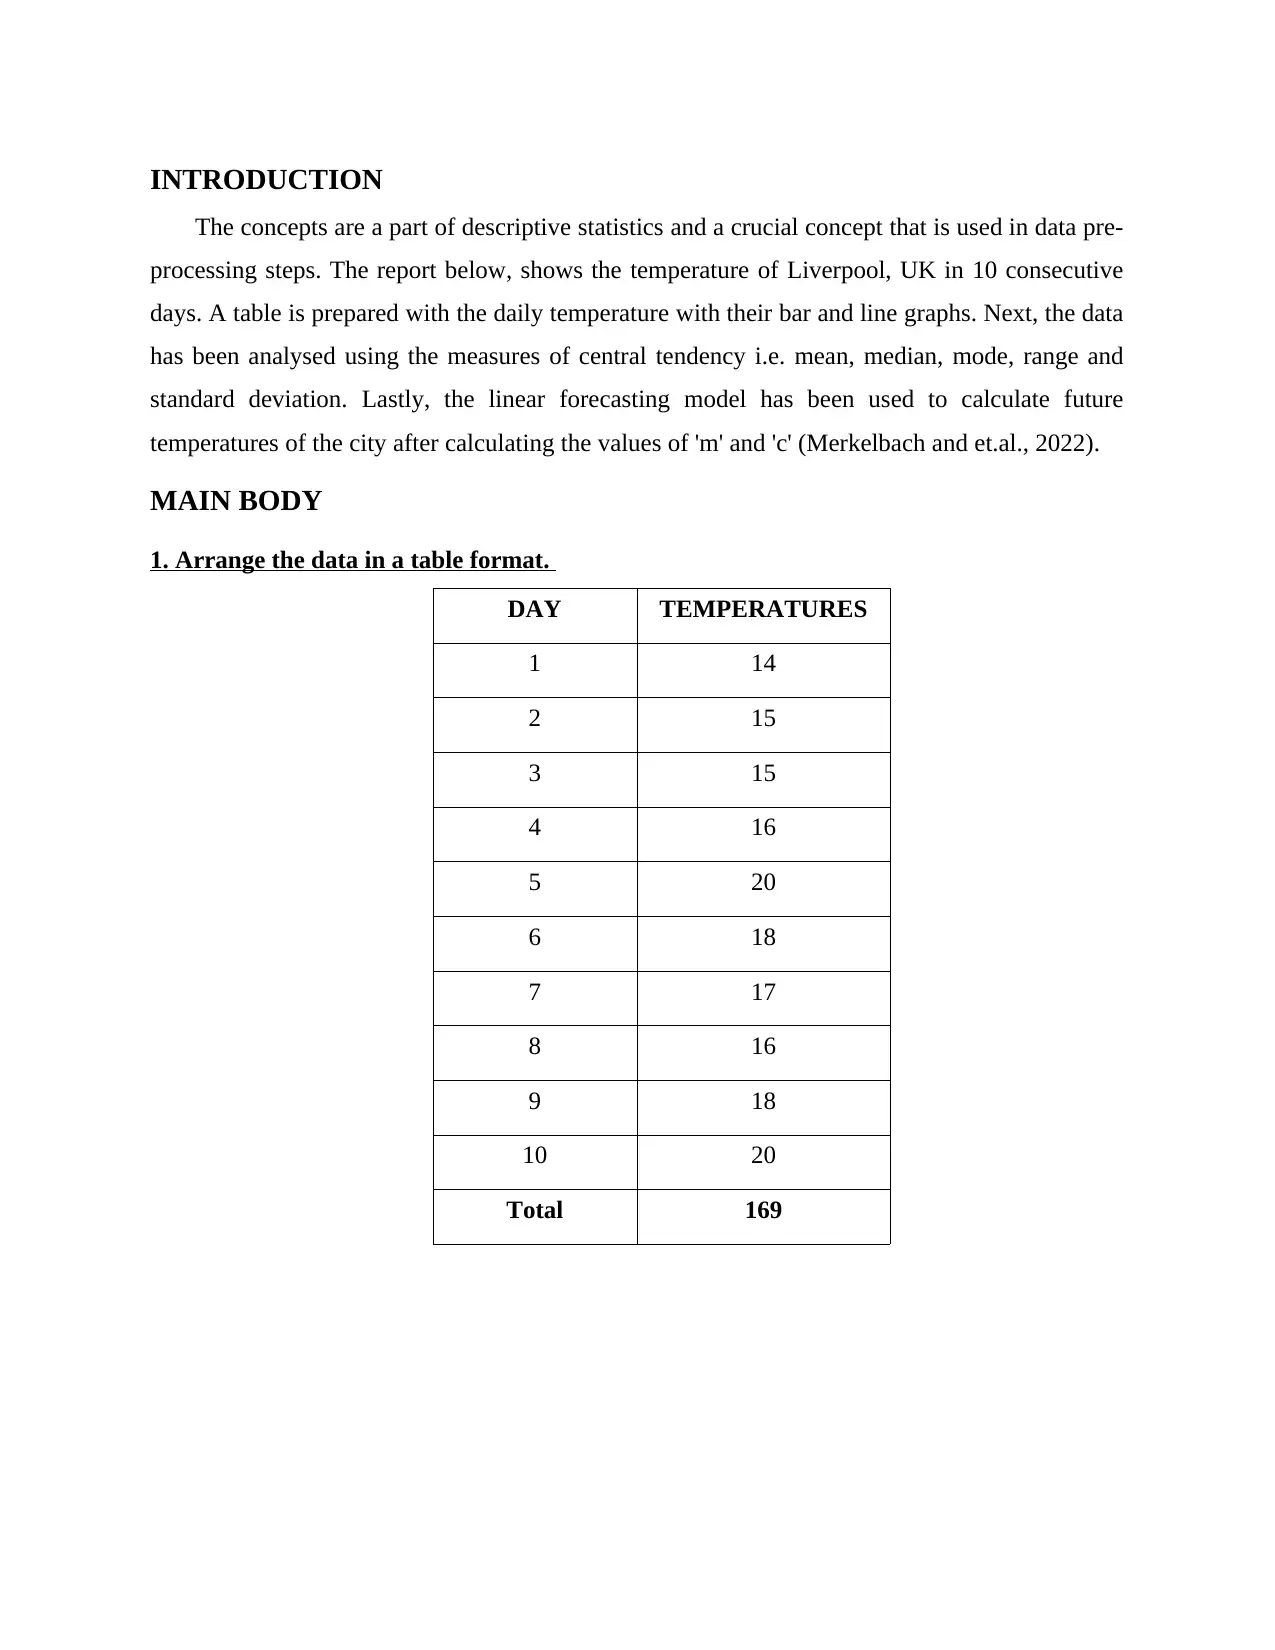
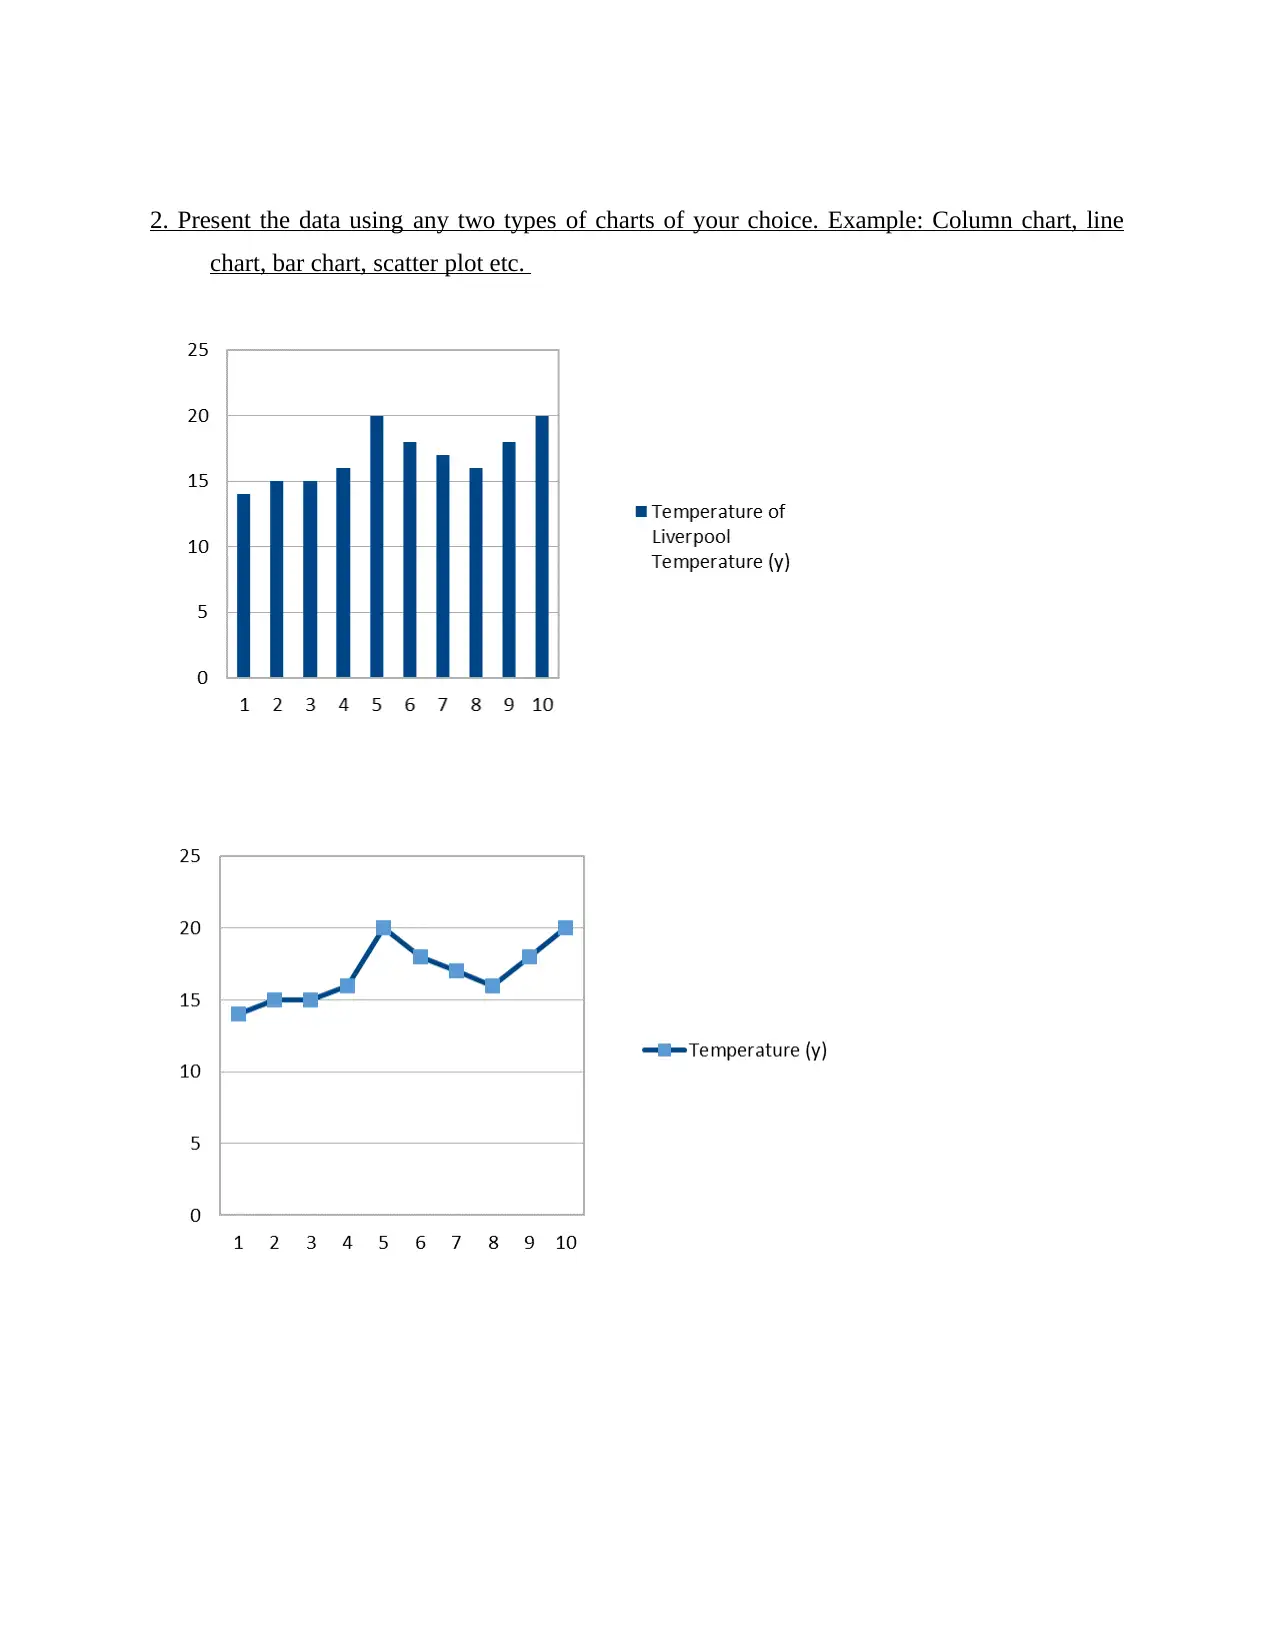
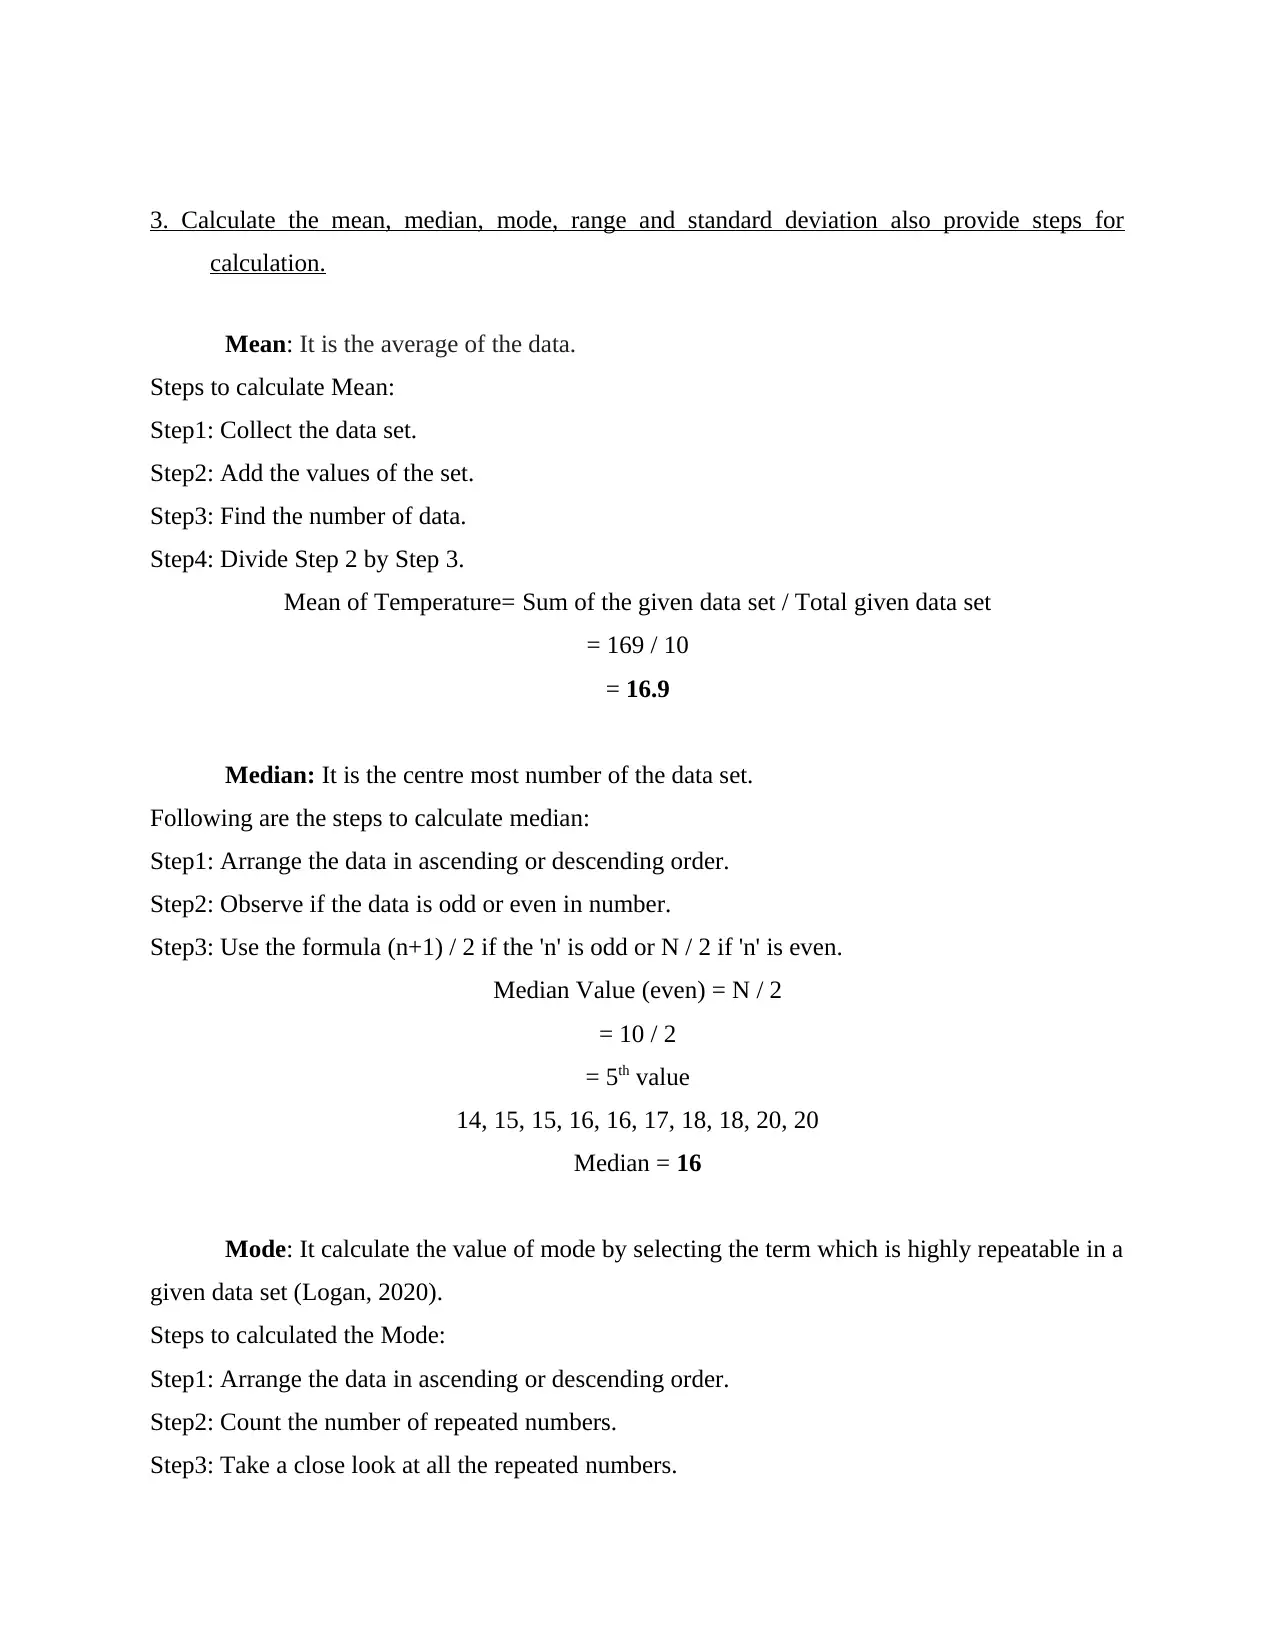
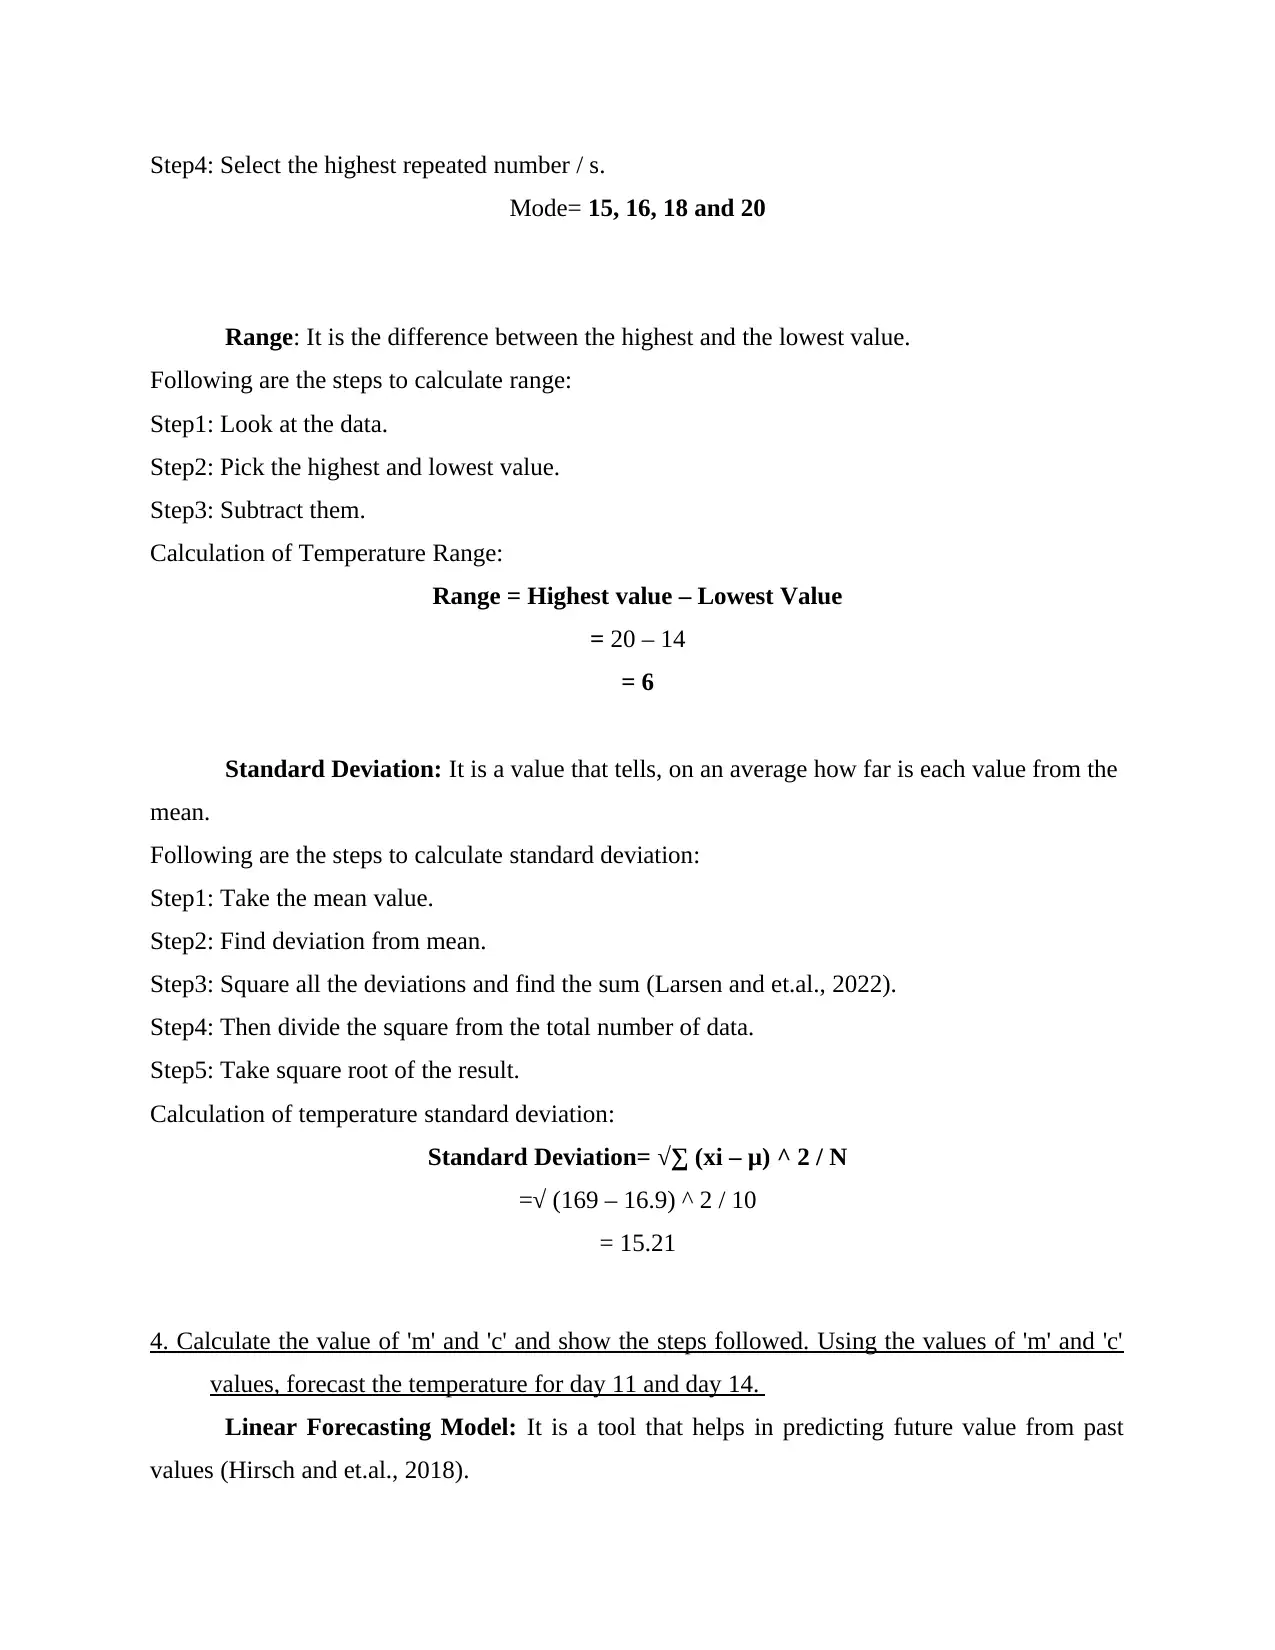
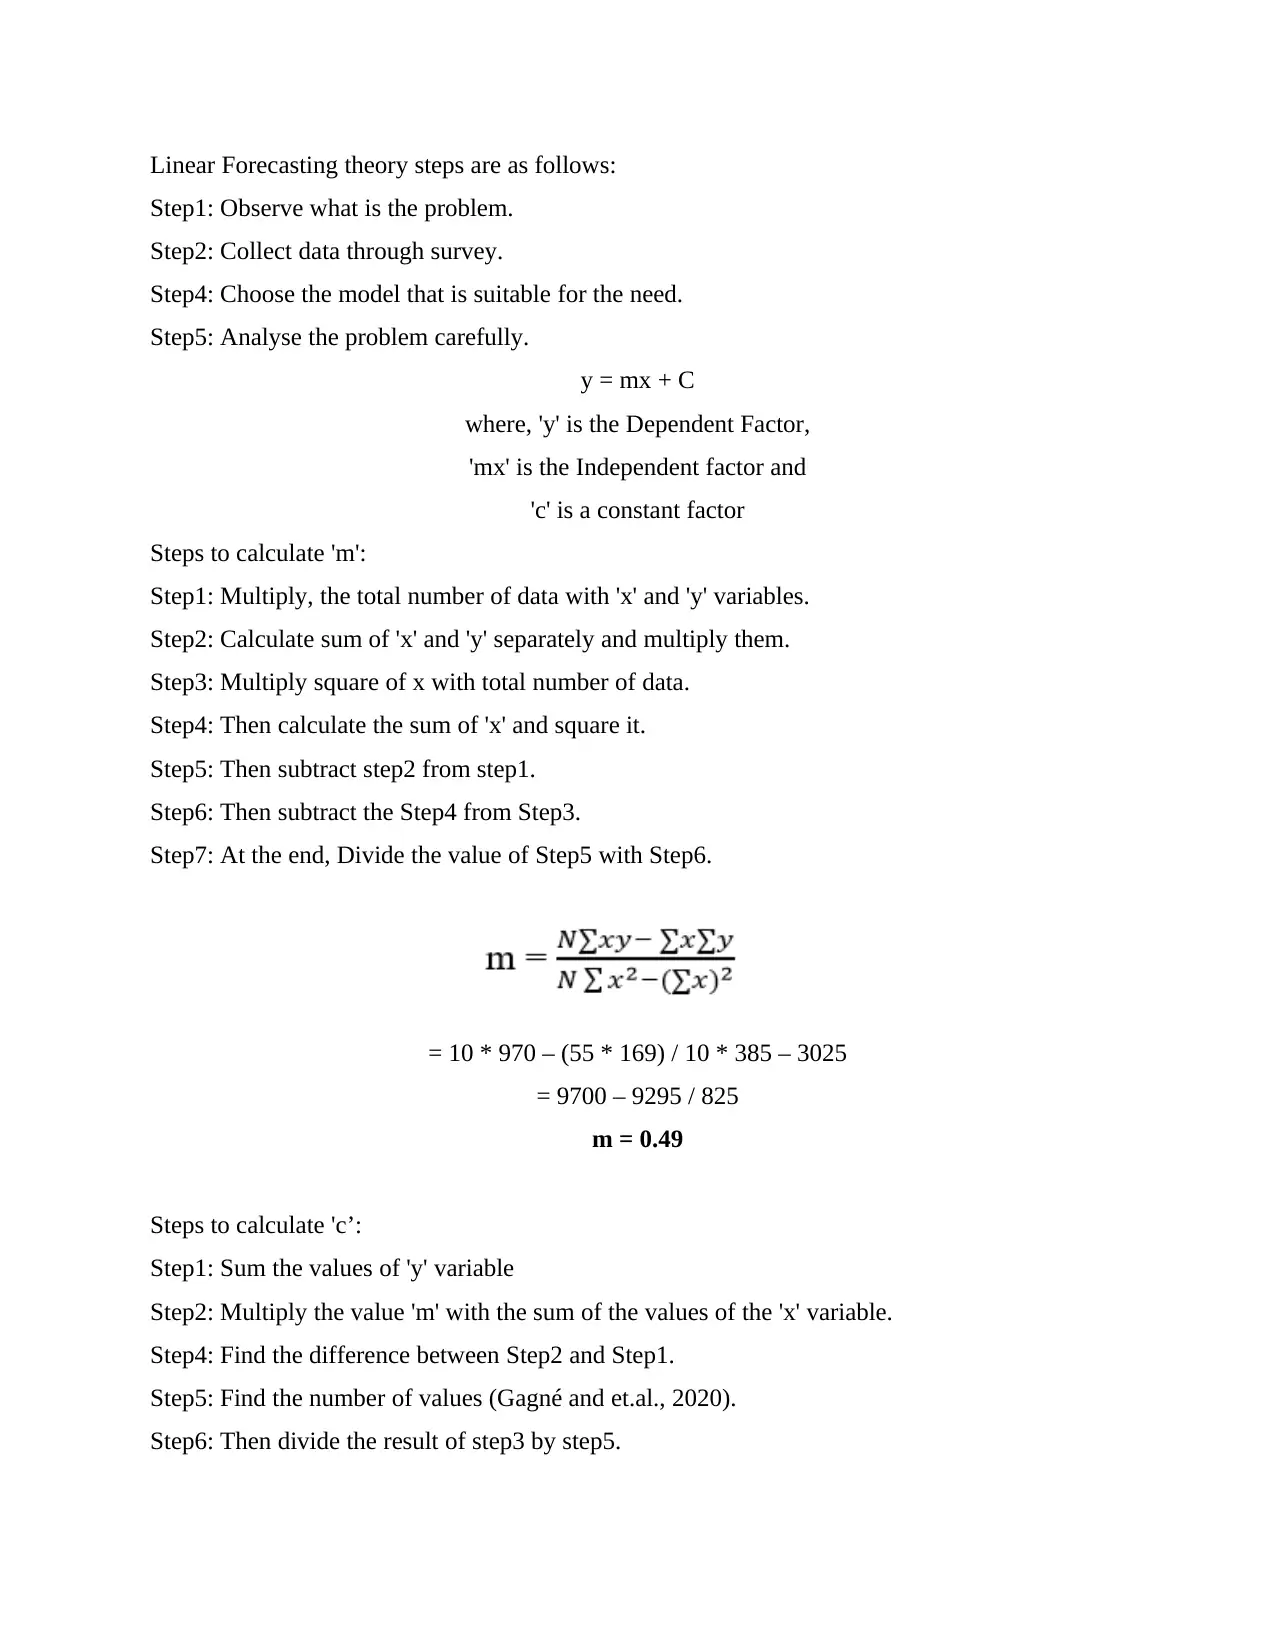
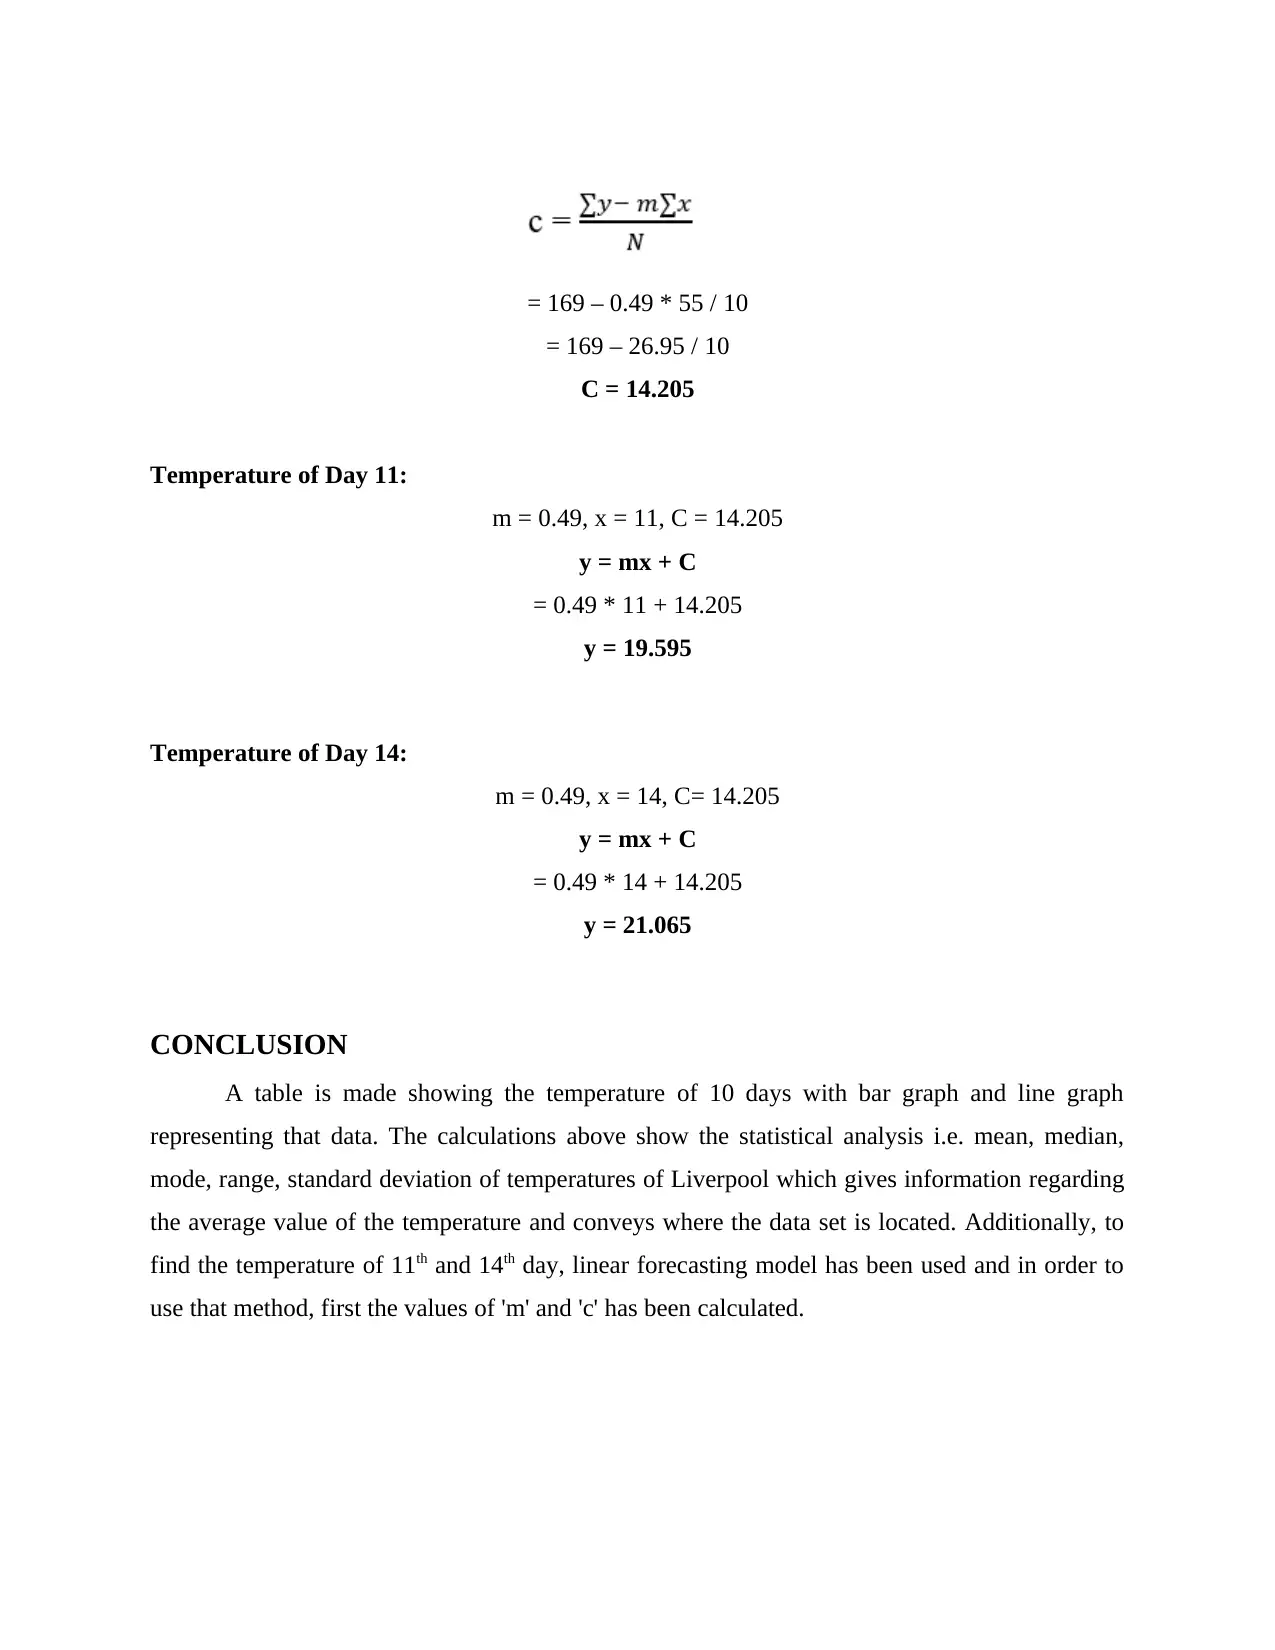
This report presents a comprehensive analysis of Liverpool's temperature data over a 10-day period. It begins by organizing the data in a table format and visualizing it using two types of charts. The core of the report involves calculating descriptive statistics, including the mean, median, mode, rang...
Read More
Contribute Materials
Your contribution can guide someone’s learning journey. Share your
documents today.

Numeracy and Data
Analysis
Analysis
Secure Best Marks with AI Grader
Need help grading? Try our AI Grader for instant feedback on your assignments.

Contents
INTRODUCTION...........................................................................................................................3
MAIN BODY..................................................................................................................................3
1. Arrange the data in a table format...........................................................................................3
2. Present the data using any two types of charts of your choice. Example: Column chart, line
chart, bar chart, scatter plot etc....................................................................................................4
3. Calculate the mean, median, mode, range and standard deviation also provide steps for
calculation....................................................................................................................................5
4. Calculate the value of 'm' and 'c' and show the steps followed. Using the values of 'm' and 'c'
values, forecast the temperature for day 11 and day 14..............................................................6
CONCLUSION................................................................................................................................8
REFERENCES................................................................................................................................9

INTRODUCTION
The concepts are a part of descriptive statistics and a crucial concept that is used in data pre-
processing steps. The report below, shows the temperature of Liverpool, UK in 10 consecutive
days. A table is prepared with the daily temperature with their bar and line graphs. Next, the data
has been analysed using the measures of central tendency i.e. mean, median, mode, range and
standard deviation. Lastly, the linear forecasting model has been used to calculate future
temperatures of the city after calculating the values of 'm' and 'c' (Merkelbach and et.al., 2022).
MAIN BODY
1. Arrange the data in a table format.
DAY TEMPERATURES
1 14
2 15
3 15
4 16
5 20
6 18
7 17
8 16
9 18
10 20
Total 169

2. Present the data using any two types of charts of your choice. Example: Column chart, line
chart, bar chart, scatter plot etc.
Secure Best Marks with AI Grader
Need help grading? Try our AI Grader for instant feedback on your assignments.

3. Calculate the mean, median, mode, range and standard deviation also provide steps for
calculation.
Mean: It is the average of the data.
Steps to calculate Mean:
Step1: Collect the data set.
Step2: Add the values of the set.
Step3: Find the number of data.
Step4: Divide Step 2 by Step 3.
Mean of Temperature= Sum of the given data set / Total given data set
= 169 / 10
= 16.9
Median: It is the centre most number of the data set.
Following are the steps to calculate median:
Step1: Arrange the data in ascending or descending order.
Step2: Observe if the data is odd or even in number.
Step3: Use the formula (n+1) / 2 if the 'n' is odd or N / 2 if 'n' is even.
Median Value (even) = N / 2
= 10 / 2
= 5th value
14, 15, 15, 16, 16, 17, 18, 18, 20, 20
Median = 16
Mode: It calculate the value of mode by selecting the term which is highly repeatable in a
given data set (Logan, 2020).
Steps to calculated the Mode:
Step1: Arrange the data in ascending or descending order.
Step2: Count the number of repeated numbers.
Step3: Take a close look at all the repeated numbers.

Step4: Select the highest repeated number / s.
Mode= 15, 16, 18 and 20
Range: It is the difference between the highest and the lowest value.
Following are the steps to calculate range:
Step1: Look at the data.
Step2: Pick the highest and lowest value.
Step3: Subtract them.
Calculation of Temperature Range:
Range = Highest value – Lowest Value
= 20 – 14
= 6
Standard Deviation: It is a value that tells, on an average how far is each value from the
mean.
Following are the steps to calculate standard deviation:
Step1: Take the mean value.
Step2: Find deviation from mean.
Step3: Square all the deviations and find the sum (Larsen and et.al., 2022).
Step4: Then divide the square from the total number of data.
Step5: Take square root of the result.
Calculation of temperature standard deviation:
Standard Deviation= √∑ (xi – μ) ^ 2 / N
=√ (169 – 16.9) ^ 2 / 10
= 15.21
4. Calculate the value of 'm' and 'c' and show the steps followed. Using the values of 'm' and 'c'
values, forecast the temperature for day 11 and day 14.
Linear Forecasting Model: It is a tool that helps in predicting future value from past
values (Hirsch and et.al., 2018).

Linear Forecasting theory steps are as follows:
Step1: Observe what is the problem.
Step2: Collect data through survey.
Step4: Choose the model that is suitable for the need.
Step5: Analyse the problem carefully.
y = mx + C
where, 'y' is the Dependent Factor,
'mx' is the Independent factor and
'c' is a constant factor
Steps to calculate 'm':
Step1: Multiply, the total number of data with 'x' and 'y' variables.
Step2: Calculate sum of 'x' and 'y' separately and multiply them.
Step3: Multiply square of x with total number of data.
Step4: Then calculate the sum of 'x' and square it.
Step5: Then subtract step2 from step1.
Step6: Then subtract the Step4 from Step3.
Step7: At the end, Divide the value of Step5 with Step6.
= 10 * 970 – (55 * 169) / 10 * 385 – 3025
= 9700 – 9295 / 825
m = 0.49
Steps to calculate 'c’:
Step1: Sum the values of 'y' variable
Step2: Multiply the value 'm' with the sum of the values of the 'x' variable.
Step4: Find the difference between Step2 and Step1.
Step5: Find the number of values (Gagné and et.al., 2020).
Step6: Then divide the result of step3 by step5.
Paraphrase This Document
Need a fresh take? Get an instant paraphrase of this document with our AI Paraphraser

= 169 – 0.49 * 55 / 10
= 169 – 26.95 / 10
C = 14.205
Temperature of Day 11:
m = 0.49, x = 11, C = 14.205
y = mx + C
= 0.49 * 11 + 14.205
y = 19.595
Temperature of Day 14:
m = 0.49, x = 14, C= 14.205
y = mx + C
= 0.49 * 14 + 14.205
y = 21.065
CONCLUSION
A table is made showing the temperature of 10 days with bar graph and line graph
representing that data. The calculations above show the statistical analysis i.e. mean, median,
mode, range, standard deviation of temperatures of Liverpool which gives information regarding
the average value of the temperature and conveys where the data set is located. Additionally, to
find the temperature of 11th and 14th day, linear forecasting model has been used and in order to
use that method, first the values of 'm' and 'c' has been calculated.

REFERENCES
Books and Journals
Gagné, M and et.al., 2020. Disentangling the role of income in the academic achievement of
migrant children. Social Science Research. 85. p.102344.
Hirsch, S and et.al., 2018. Basic numerical competences in large-scale assessment data: Structure
and long-term relevance. Journal of Experimental Child Psychology. 167. pp.32-48.
Larsen, S.A and et.al., 2022. The public–private debate: school sector differences in academic
achievement from Year 3 to Year 9?. The Australian Educational Researcher. pp.1-32.
Logan, T., 2020. A practical, iterative framework for secondary data analysis in educational
research. The Australian Educational Researcher. 47(1). pp.129-148.
Merkelbach, I and et.al., 2022. Differential Efficacy of Digital Scaffolding of Numeracy Skills in
Kindergartners With Mild Perinatal Aversities. The Connection Between Mathematical
and Reading Abilities and Disabilities.
1 out of 9
Related Documents

Your All-in-One AI-Powered Toolkit for Academic Success.
+13062052269
info@desklib.com
Available 24*7 on WhatsApp / Email
Unlock your academic potential
© 2024 | Zucol Services PVT LTD | All rights reserved.