Station Analysis: Temperature & Precipitation Data Interpretation

Verified

Added on  2024/06/21

|5
|599
|88
Homework Assignment
AI Summary
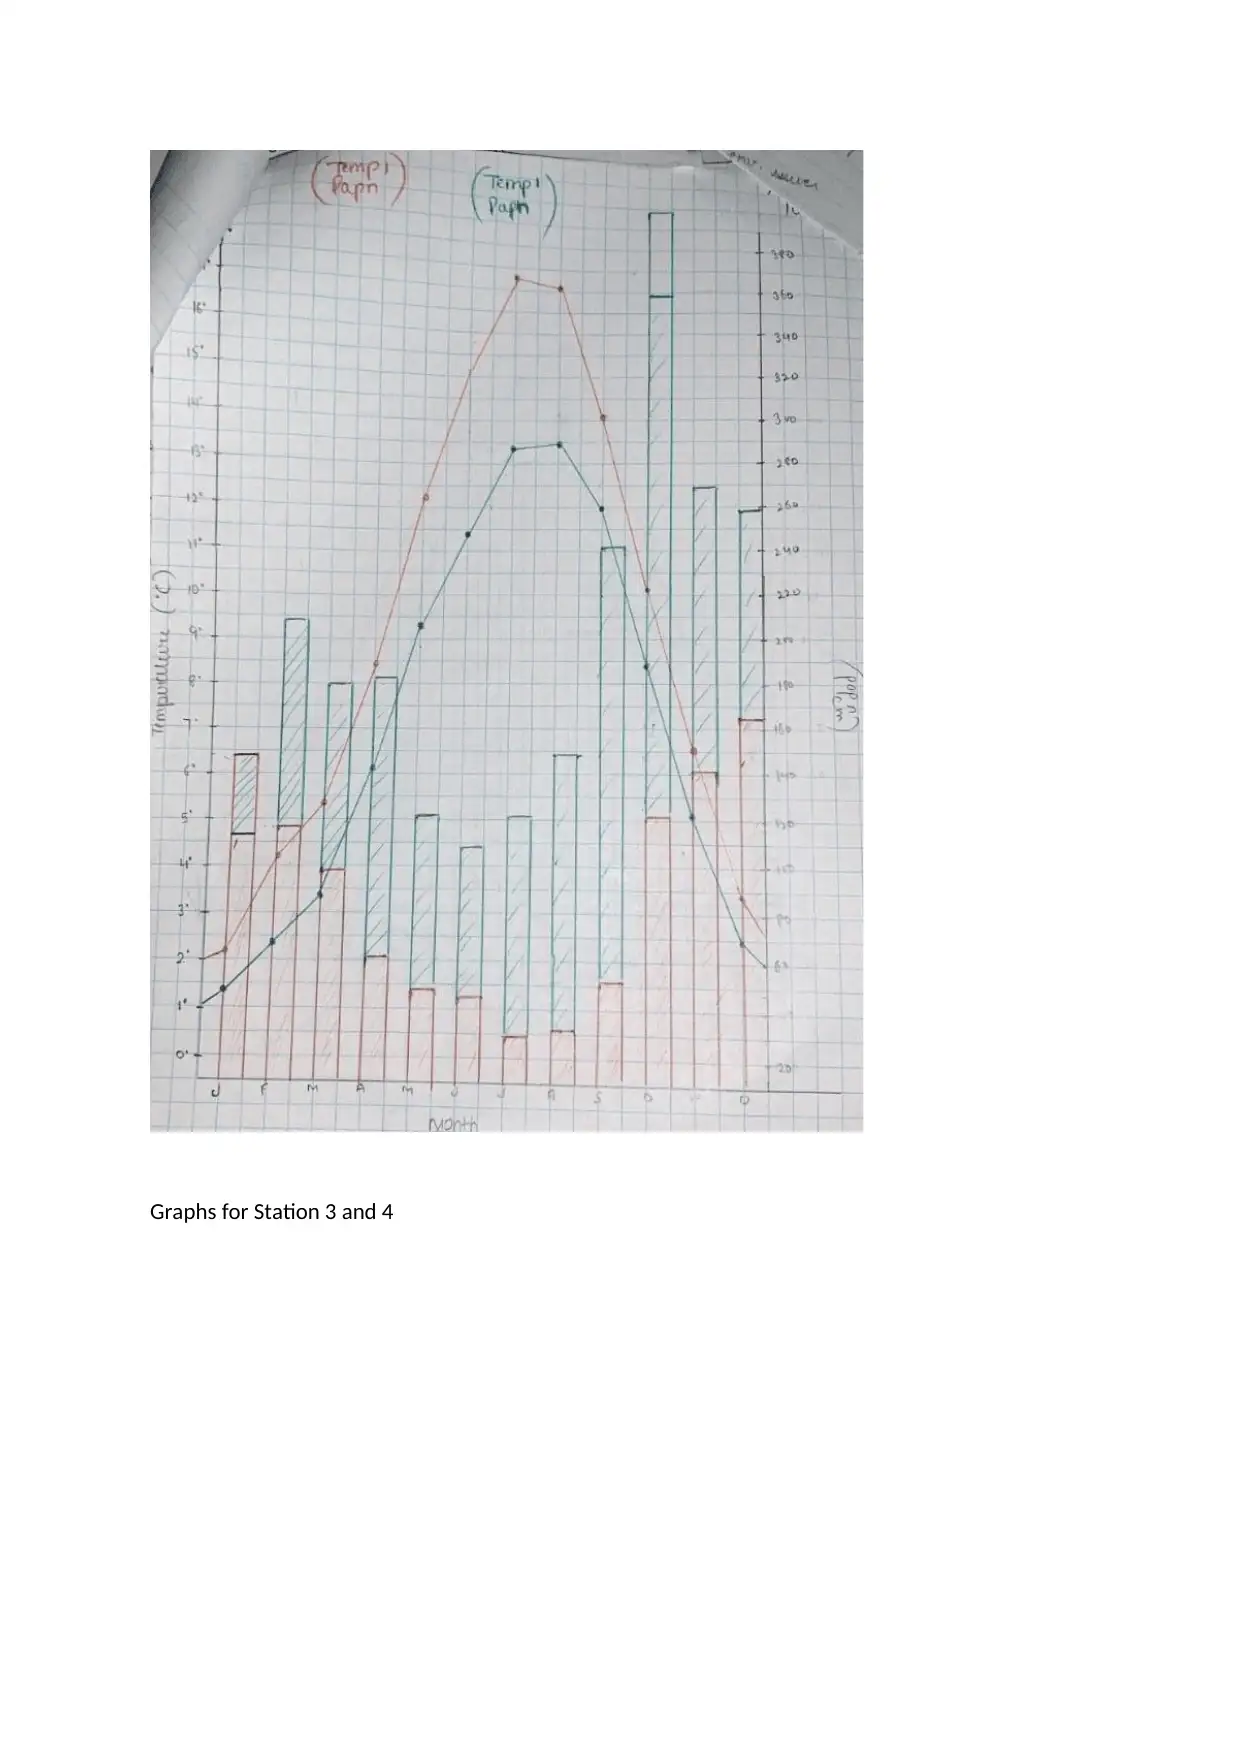
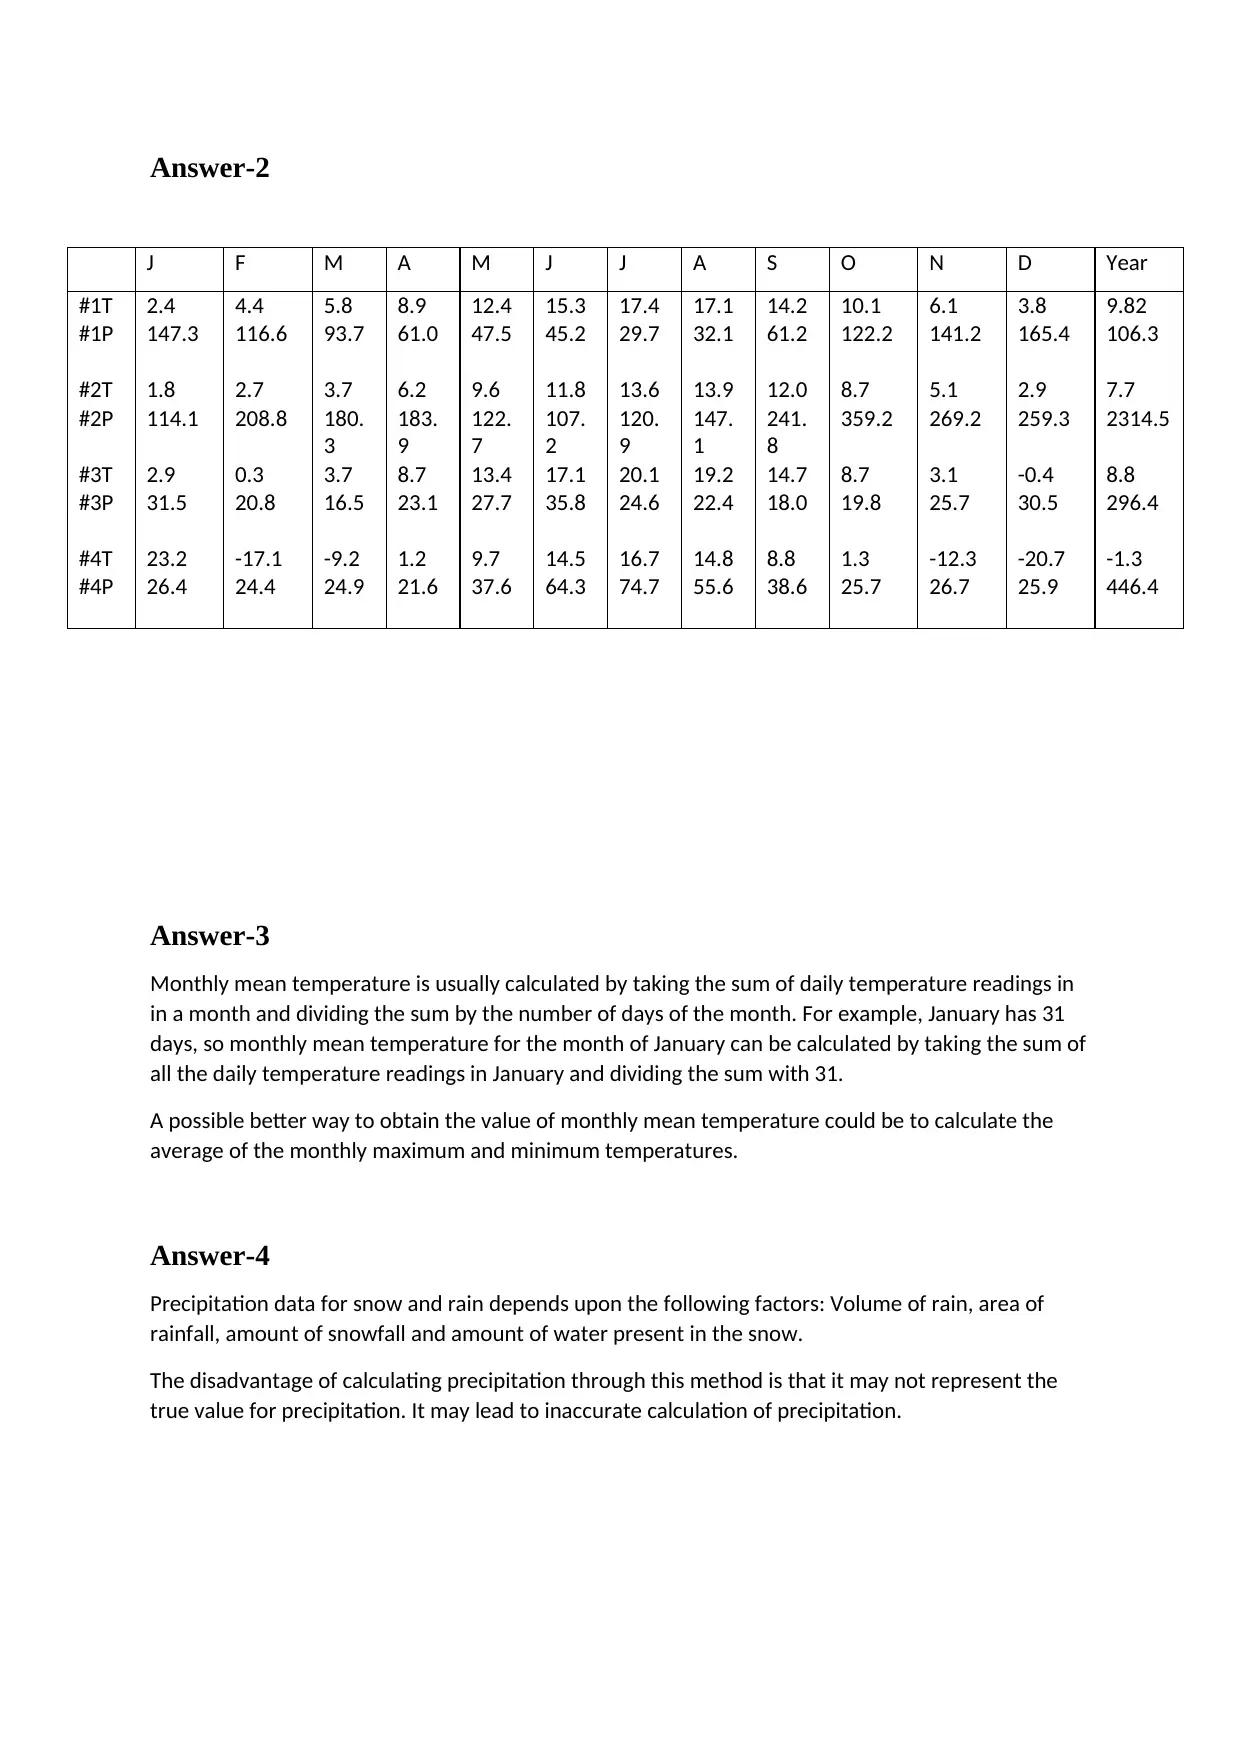
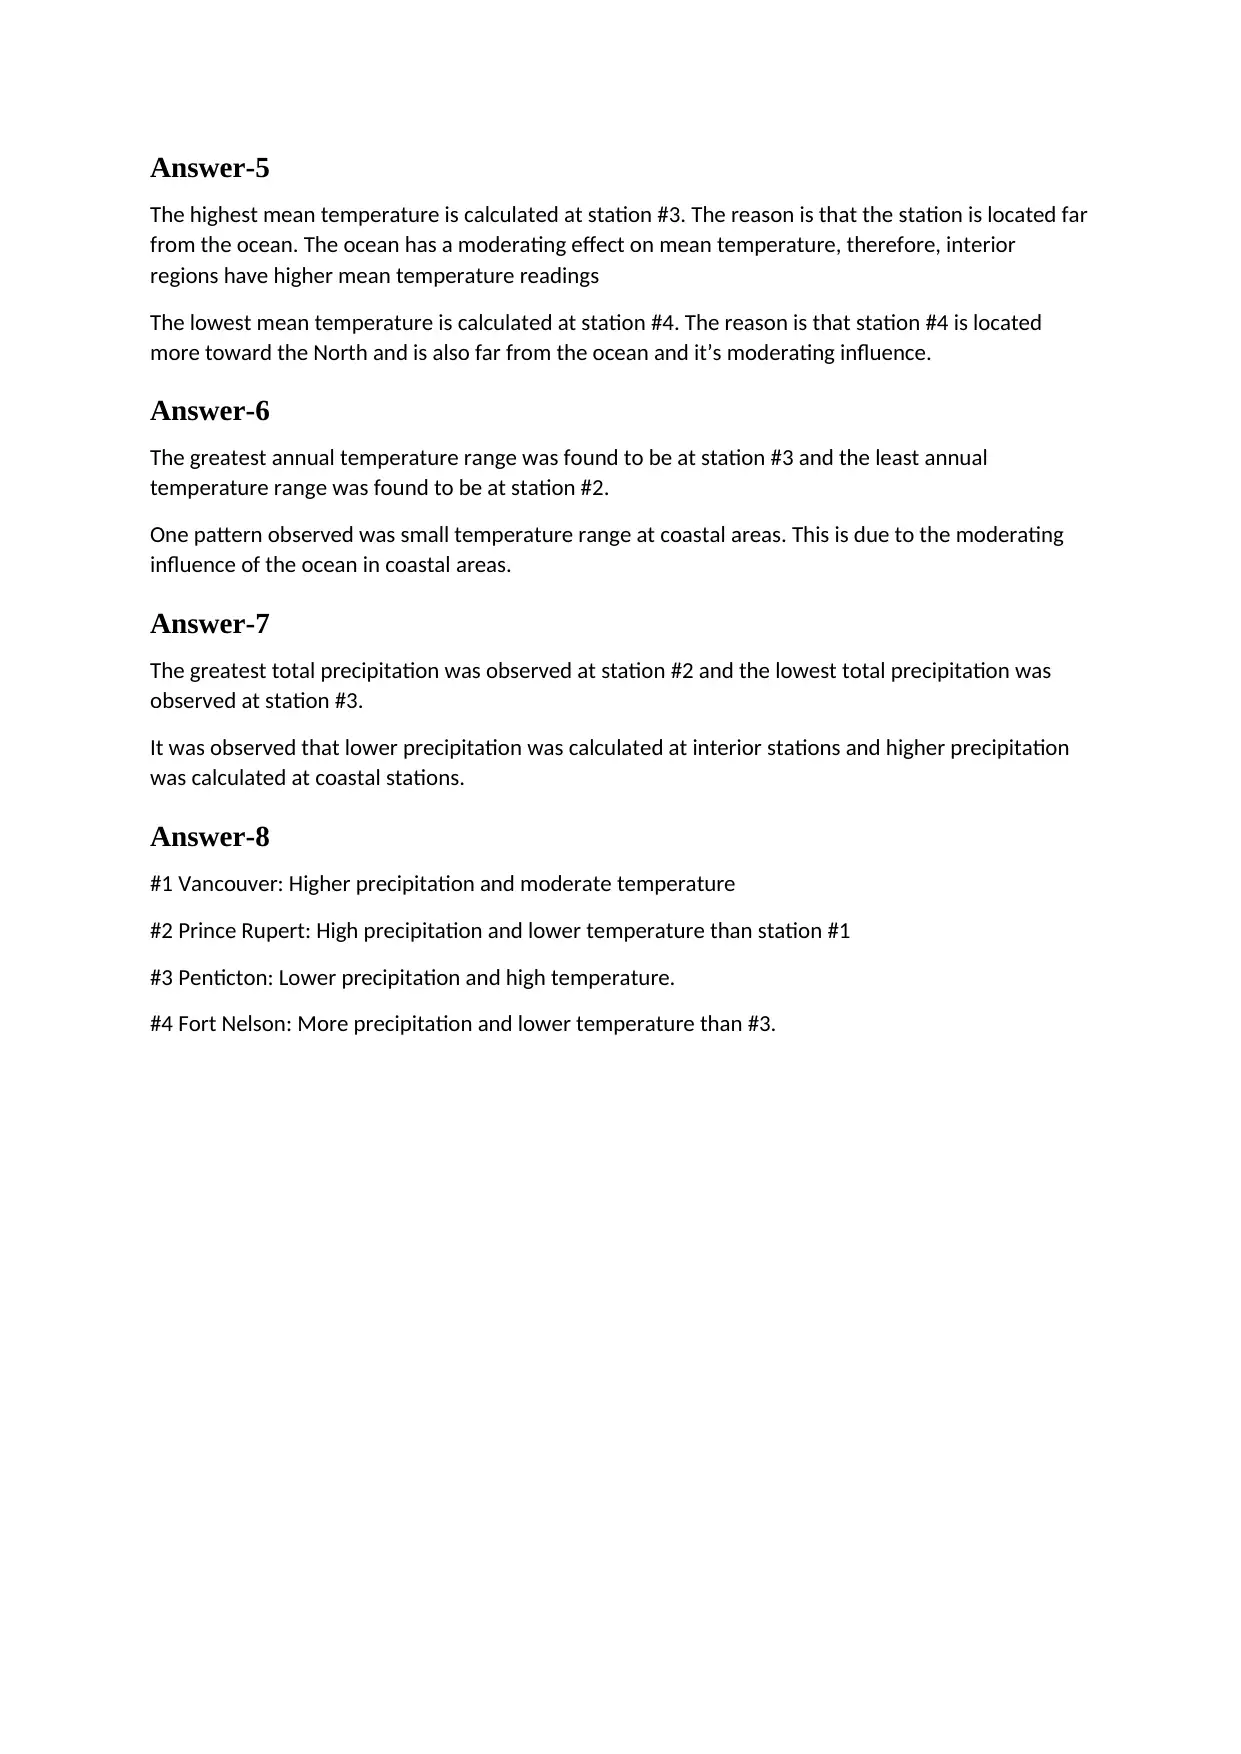
This assignment provides a detailed analysis of temperature and precipitation data collected from four different stations. It includes a comparison of temperature and precipitation patterns between stations 1 and 2 versus stations 3 and 4, presenting the data in graphical format. The analysis involves calculating monthly mean temperatures and discussing factors influencing precipitation data, such as rainfall volume and snowfall. The assignment identifies the stations with the highest and lowest mean temperatures, attributing these differences to geographical factors like proximity to the ocean and latitudinal location. It also examines annual temperature ranges and total precipitation levels across the stations, noting patterns related to coastal versus interior locations. Finally, the assignment provides brief climate characterizations for each station based on the analyzed data, relating temperature and precipitation to geographical location. Desklib offers a wide array of similar solved assignments and study resources for students.
Document Page
Table of Contents
Answer-1...............................................................................................................................................1
Answer-2...............................................................................................................................................4
Answer-3...............................................................................................................................................4
Answer-4...............................................................................................................................................4
Answer-5...............................................................................................................................................5
Answer-6...............................................................................................................................................5
Answer-7...............................................................................................................................................5
Answer-8...............................................................................................................................................5
Answer-1
Comparison of temperature and precipitation data from stations 1 and 2 in first plot with data from
stations 3 and 4 in the second plot
tabler-icon-diamond-filled.svg

Paraphrase This Document

Need a fresh take? Get an instant paraphrase of this document with our AI Paraphraser
Document Page
Graph for Station 1 and 2
Document Page
Graphs for Station 3 and 4
Document Page
Answer-2
J F M A M J J A S O N D Year
#1T
#1P
#2T
#2P
#3T
#3P
#4T
#4P
2.4
147.3
1.8
114.1
2.9
31.5
23.2
26.4
4.4
116.6
2.7
208.8
0.3
20.8
-17.1
24.4
5.8
93.7
3.7
180.
3
3.7
16.5
-9.2
24.9
8.9
61.0
6.2
183.
9
8.7
23.1
1.2
21.6
12.4
47.5
9.6
122.
7
13.4
27.7
9.7
37.6
15.3
45.2
11.8
107.
2
17.1
35.8
14.5
64.3
17.4
29.7
13.6
120.
9
20.1
24.6
16.7
74.7
17.1
32.1
13.9
147.
1
19.2
22.4
14.8
55.6
14.2
61.2
12.0
241.
8
14.7
18.0
8.8
38.6
10.1
122.2
8.7
359.2
8.7
19.8
1.3
25.7
6.1
141.2
5.1
269.2
3.1
25.7
-12.3
26.7
3.8
165.4
2.9
259.3
-0.4
30.5
-20.7
25.9
9.82
106.3
7.7
2314.5
8.8
296.4
-1.3
446.4
Answer-3
Monthly mean temperature is usually calculated by taking the sum of daily temperature readings in
in a month and dividing the sum by the number of days of the month. For example, January has 31
days, so monthly mean temperature for the month of January can be calculated by taking the sum of
all the daily temperature readings in January and dividing the sum with 31.
A possible better way to obtain the value of monthly mean temperature could be to calculate the
average of the monthly maximum and minimum temperatures.
Answer-4
Precipitation data for snow and rain depends upon the following factors: Volume of rain, area of
rainfall, amount of snowfall and amount of water present in the snow.
The disadvantage of calculating precipitation through this method is that it may not represent the
true value for precipitation. It may lead to inaccurate calculation of precipitation.
tabler-icon-diamond-filled.svg

Paraphrase This Document

Need a fresh take? Get an instant paraphrase of this document with our AI Paraphraser
Document Page
Answer-5
The highest mean temperature is calculated at station #3. The reason is that the station is located far
from the ocean. The ocean has a moderating effect on mean temperature, therefore, interior
regions have higher mean temperature readings
The lowest mean temperature is calculated at station #4. The reason is that station #4 is located
more toward the North and is also far from the ocean and it’s moderating influence.
Answer-6
The greatest annual temperature range was found to be at station #3 and the least annual
temperature range was found to be at station #2.
One pattern observed was small temperature range at coastal areas. This is due to the moderating
influence of the ocean in coastal areas.
Answer-7
The greatest total precipitation was observed at station #2 and the lowest total precipitation was
observed at station #3.
It was observed that lower precipitation was calculated at interior stations and higher precipitation
was calculated at coastal stations.
Answer-8
#1 Vancouver: Higher precipitation and moderate temperature
#2 Prince Rupert: High precipitation and lower temperature than station #1
#3 Penticton: Lower precipitation and high temperature.
#4 Fort Nelson: More precipitation and lower temperature than #3.
chevron_up_icon
1 out of 5
circle_padding
hide_on_mobile
zoom_out_icon
[object Object]