Macquarie University ENGG100 Tensile Strength Lab Report
VerifiedAdded on 2022/11/26
|11
|2381
|113
Report
AI Summary
This lab report details an experiment comparing the tensile strength of mild steel and aluminum. The experiment utilized a universal testing machine to apply uniaxial loads and measure the resulting stress and strain. The methodology included precise measurements of specimen dimensions, data acquisition during the tensile tests, and subsequent graph plotting and calculations. The results revealed that mild steel exhibited a higher tensile strength compared to aluminum, with differing behaviors in terms of yield strength, Young's modulus, and fracture points. The analysis considered the micro-crystalline structures of the metals and their impact on the stress-strain curves. The report concludes with a discussion on the implications of these findings for engineering applications, highlighting the suitability of mild steel in construction and machinery and aluminum in applications requiring lower density and higher conductivity.
Tensile Strength Lab Report
Student’s Name
Proffessor/Lecturer
Abstract
Tensile strength is a mechanical property that deals with the ability of these materials to be able to carry
out work. The test was done to investigate the tensile strength properties of two metals, the mild steel and
that of aluminium. The experiment was successful due to the use of universal testing machine to
determine the tensile strength. This machine usually helps engineers determine the tensile strength while
performing design or considering using different metals. The experiment further proves that the tensile
strength of mild steel is higher than that of aluminium. Which tells us why it is preferred in different
applications that require loading of higher degrees. When one is considering subjecting different metals
to loading, it is better done using the tensile strength determination.
Introduction
In mechanical engineering, the strength or generally the properties of materials are determined using their
tensile strength. The ability for a material to withstand some loading, or a downward force, is its tensile
strength. In life, many materials are subjected to a lot of forces, loading especially and the nature and
heaviness of these loads vary from one to the other. Materials are determined and selected by how they
can have the following features: Tensile, compression, and shearing, those are not all but just a few that
are commonly considered. When designing mechanical works, and materials are involved, then those are
some of the considerations taken. Some features that are also considered outside those, are the reaction
when subjected to certain degrees of temperature and current conductivity. The usage of a material should
be specified to its tensile strength, which is why it is important to conduct such experiments because
through these experiments, it is easy to predict the tensile properties of a material before it is used, or
when it is used, it will be easy to know the amount of loading the material can withstand. These
experiments are usually conducted by subjecting the tested material, whose dimensions are known, to
longitudinal or axial forces [1]. The material or specimen is subjected to these forces until the material
begins to get deformed and it begins to fail. The tensile load is read and recorded and the respective
extensions are also taken down and considered for calculation to determine stress or strain and how they
relate regarding the material being experimented. Other mechanical properties of materials can be
examined by examining the tensile strength, like the percentage elongation, yield strength, and general
strength of the material among other features. The features recorded before the experiment are the
diameter DO, and length LO, sometimes the cross-sectional areas can also be recorded [2].
When conducting the tensile strength experiment, the shape of the materials must be the same for
standardization. At the time testing is being carried out, deformation can be noted to be at the narrow
central region as shown in the diagram. The curve below is for a typical material, which means by the aid
of that diagram, one is able to know the features of the material, before taking any further step.
Paraphrase This Document
Need a fresh take? Get an instant paraphrase of this document with our AI Paraphraser
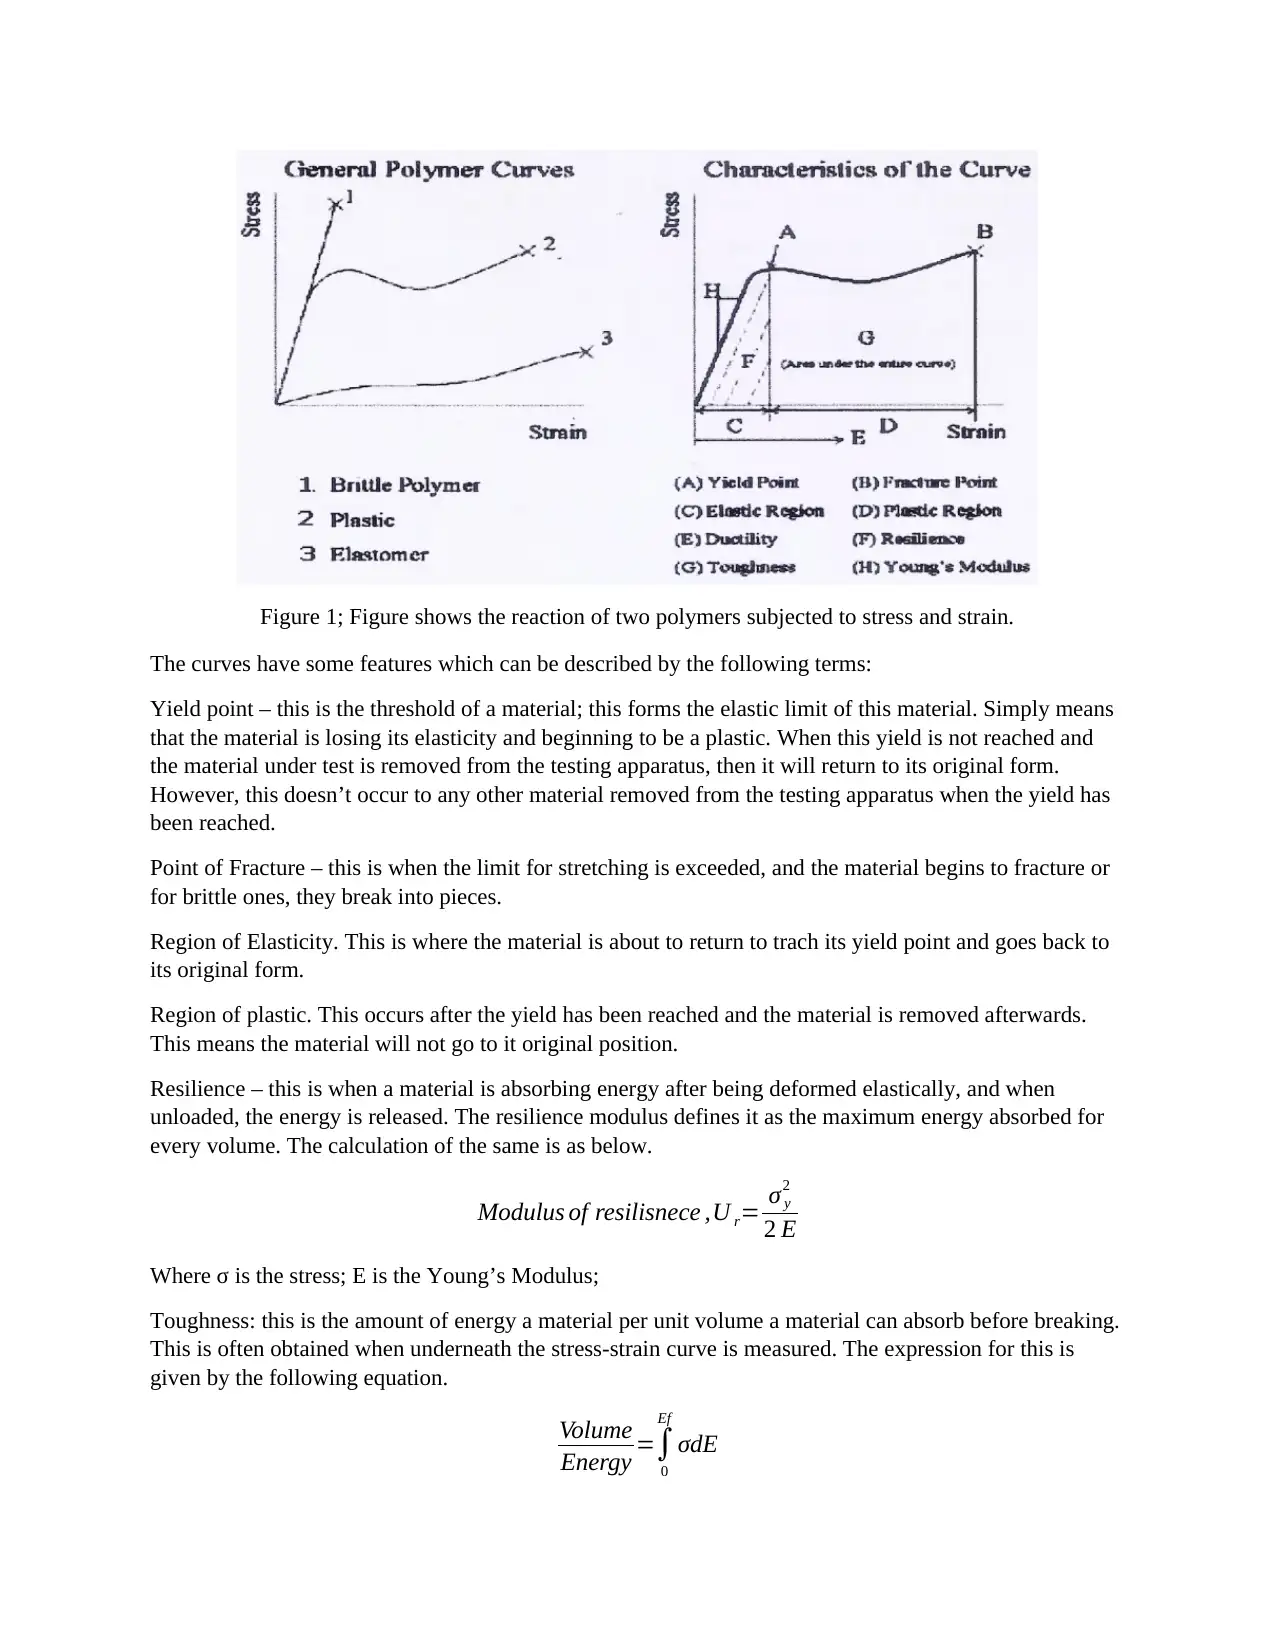
Figure 1; Figure shows the reaction of two polymers subjected to stress and strain.
The curves have some features which can be described by the following terms:
Yield point – this is the threshold of a material; this forms the elastic limit of this material. Simply means
that the material is losing its elasticity and beginning to be a plastic. When this yield is not reached and
the material under test is removed from the testing apparatus, then it will return to its original form.
However, this doesn’t occur to any other material removed from the testing apparatus when the yield has
been reached.
Point of Fracture – this is when the limit for stretching is exceeded, and the material begins to fracture or
for brittle ones, they break into pieces.
Region of Elasticity. This is where the material is about to return to trach its yield point and goes back to
its original form.
Region of plastic. This occurs after the yield has been reached and the material is removed afterwards.
This means the material will not go to it original position.
Resilience – this is when a material is absorbing energy after being deformed elastically, and when
unloaded, the energy is released. The resilience modulus defines it as the maximum energy absorbed for
every volume. The calculation of the same is as below.
Modulus of resilisnece ,U r= σ y
2
2 E
Where σ is the stress; E is the Young’s Modulus;
Toughness: this is the amount of energy a material per unit volume a material can absorb before breaking.
This is often obtained when underneath the stress-strain curve is measured. The expression for this is
given by the following equation.
Volume
Energy =∫
0
Ef
σdE
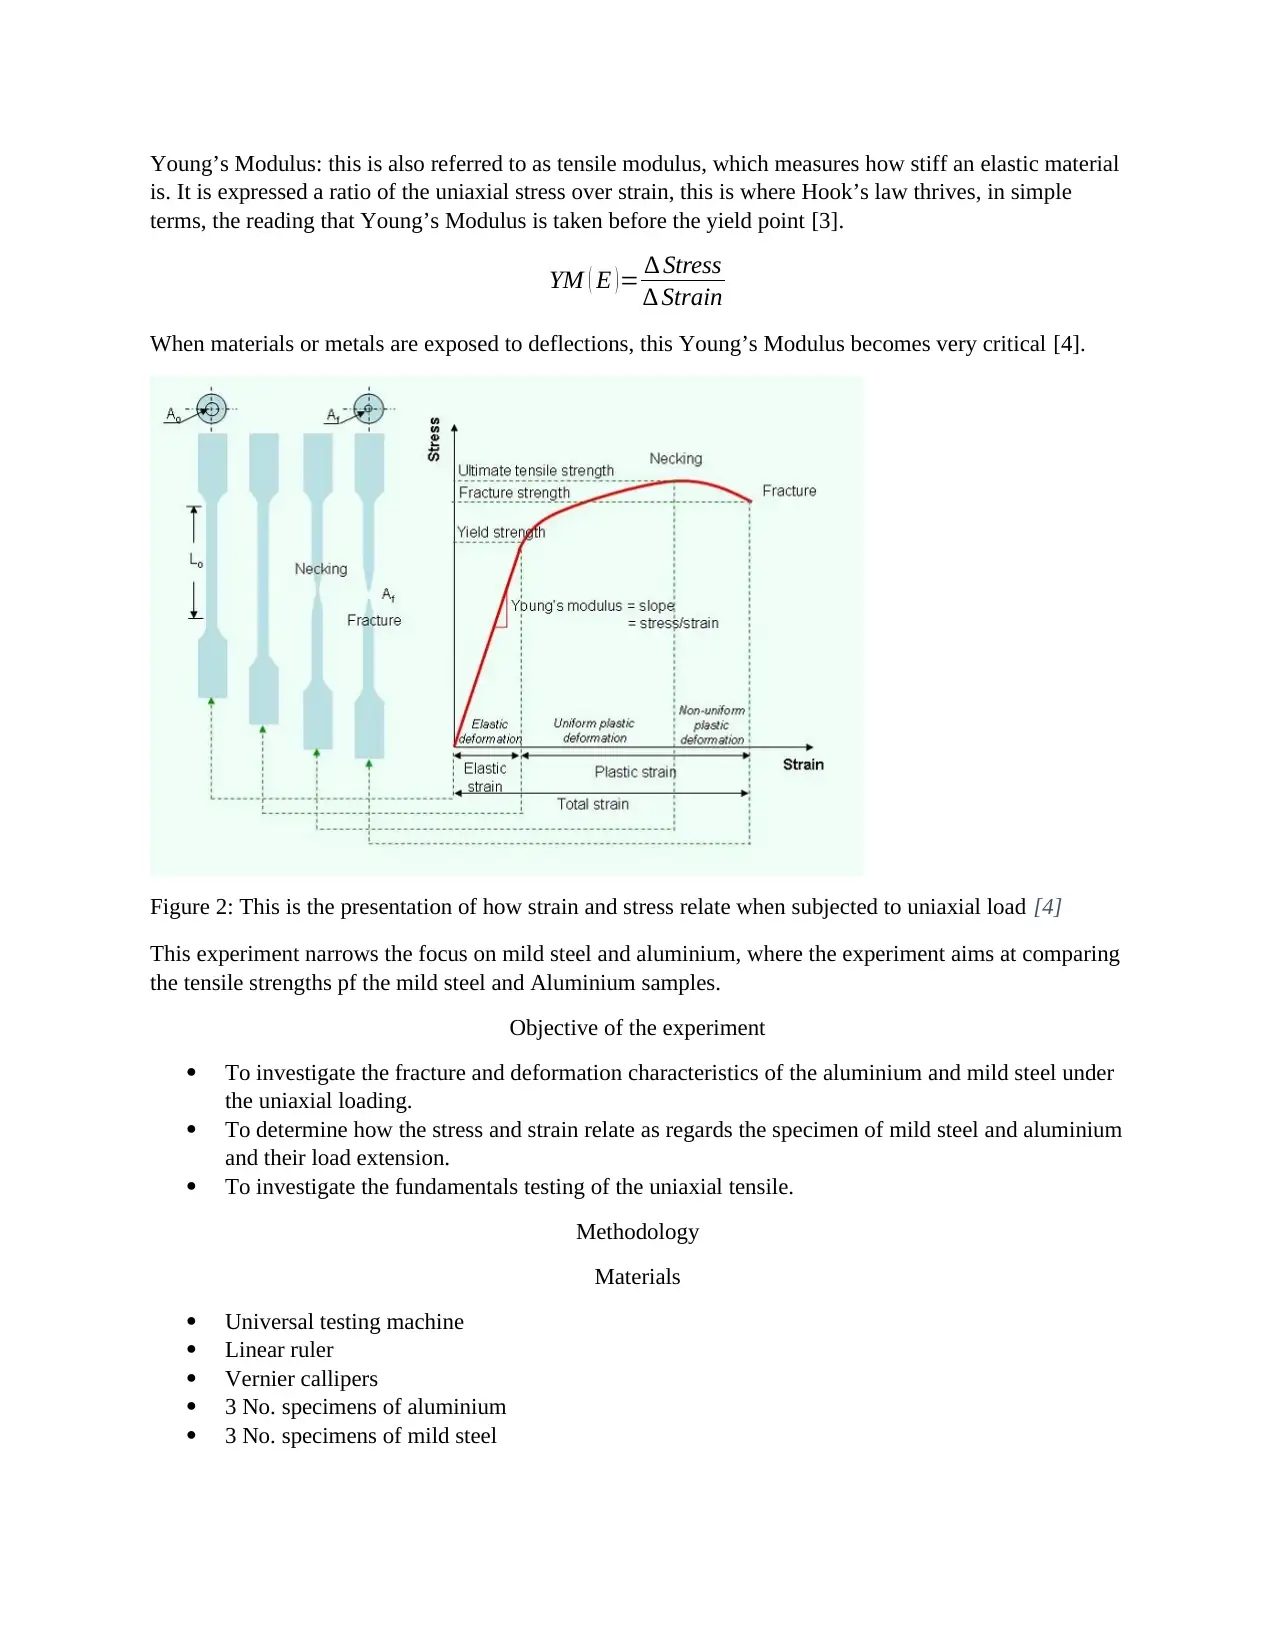
Young’s Modulus: this is also referred to as tensile modulus, which measures how stiff an elastic material
is. It is expressed a ratio of the uniaxial stress over strain, this is where Hook’s law thrives, in simple
terms, the reading that Young’s Modulus is taken before the yield point [3].
YM ( E )= ∆ Stress
∆ Strain
When materials or metals are exposed to deflections, this Young’s Modulus becomes very critical [4].
Figure 2: This is the presentation of how strain and stress relate when subjected to uniaxial load [4]
This experiment narrows the focus on mild steel and aluminium, where the experiment aims at comparing
the tensile strengths pf the mild steel and Aluminium samples.
Objective of the experiment
To investigate the fracture and deformation characteristics of the aluminium and mild steel under
the uniaxial loading.
To determine how the stress and strain relate as regards the specimen of mild steel and aluminium
and their load extension.
To investigate the fundamentals testing of the uniaxial tensile.
Methodology
Materials
Universal testing machine
Linear ruler
Vernier callipers
3 No. specimens of aluminium
3 No. specimens of mild steel
⊘ This is a preview!⊘
Do you want full access?
Subscribe today to unlock all pages.
Trusted by 1+ million students worldwide
Procedure
Use the Vernier callipers to measure the width and height of each sample
By use of a ruler to measure and verify the gauge length of the samples
Data acquisition and recording was taken after a software was activated and materials that relates to the
sample was selected after a command was given to the software.
When the load cell was set to zero, Instron frame set to measure the tensile strengths/load on each
specimen
The jaws were attuned to the size of the specimens, after which the extensometers were attached on the
reduced sections of gauge specimen
The scroll wheel was then used and the machine preloaded this was done to prevent slipping
By the adjustment of the extensometer to zero, after the specimen is ejected, now the test for strain began
The data was tabulated on the spreadsheet by a use of the software
The sample was placed in the universal testing machine where tensile determination was performed and
results recorded in computer.
These obtained data were later used for graph plotting and later calculation
Analysis of Results
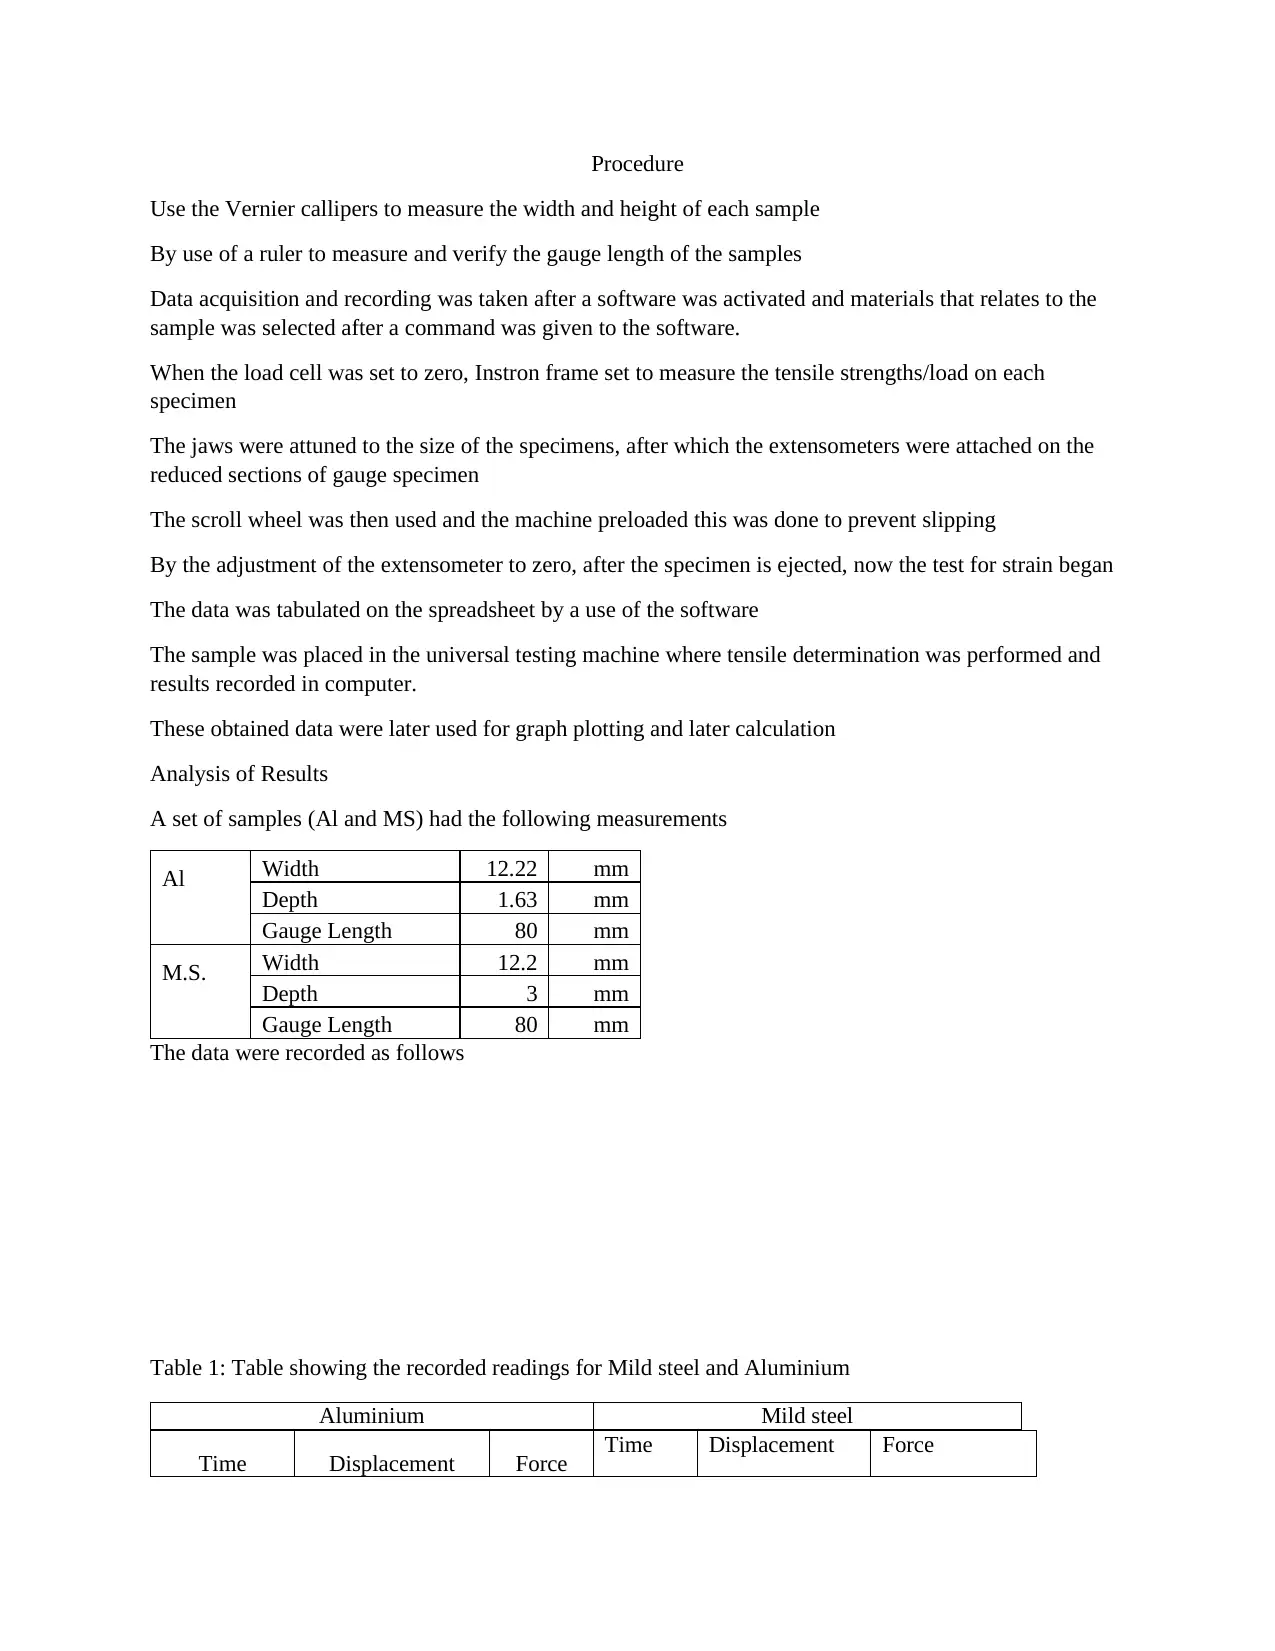
A set of samples (Al and MS) had the following measurements
Al Width 12.22 mm
Depth 1.63 mm
Gauge Length 80 mm
M.S. Width 12.2 mm
Depth 3 mm
Gauge Length 80 mm
The data were recorded as follows
Table 1: Table showing the recorded readings for Mild steel and Aluminium
Aluminium Mild steel
Time Displacement Force Time Displacement Force
Use the Vernier callipers to measure the width and height of each sample
By use of a ruler to measure and verify the gauge length of the samples
Data acquisition and recording was taken after a software was activated and materials that relates to the
sample was selected after a command was given to the software.
When the load cell was set to zero, Instron frame set to measure the tensile strengths/load on each
specimen
The jaws were attuned to the size of the specimens, after which the extensometers were attached on the
reduced sections of gauge specimen
The scroll wheel was then used and the machine preloaded this was done to prevent slipping
By the adjustment of the extensometer to zero, after the specimen is ejected, now the test for strain began
The data was tabulated on the spreadsheet by a use of the software
The sample was placed in the universal testing machine where tensile determination was performed and
results recorded in computer.
These obtained data were later used for graph plotting and later calculation
Analysis of Results
A set of samples (Al and MS) had the following measurements
Al Width 12.22 mm
Depth 1.63 mm
Gauge Length 80 mm
M.S. Width 12.2 mm
Depth 3 mm
Gauge Length 80 mm
The data were recorded as follows
Table 1: Table showing the recorded readings for Mild steel and Aluminium
Aluminium Mild steel
Time Displacement Force Time Displacement Force
Paraphrase This Document
Need a fresh take? Get an instant paraphrase of this document with our AI Paraphraser
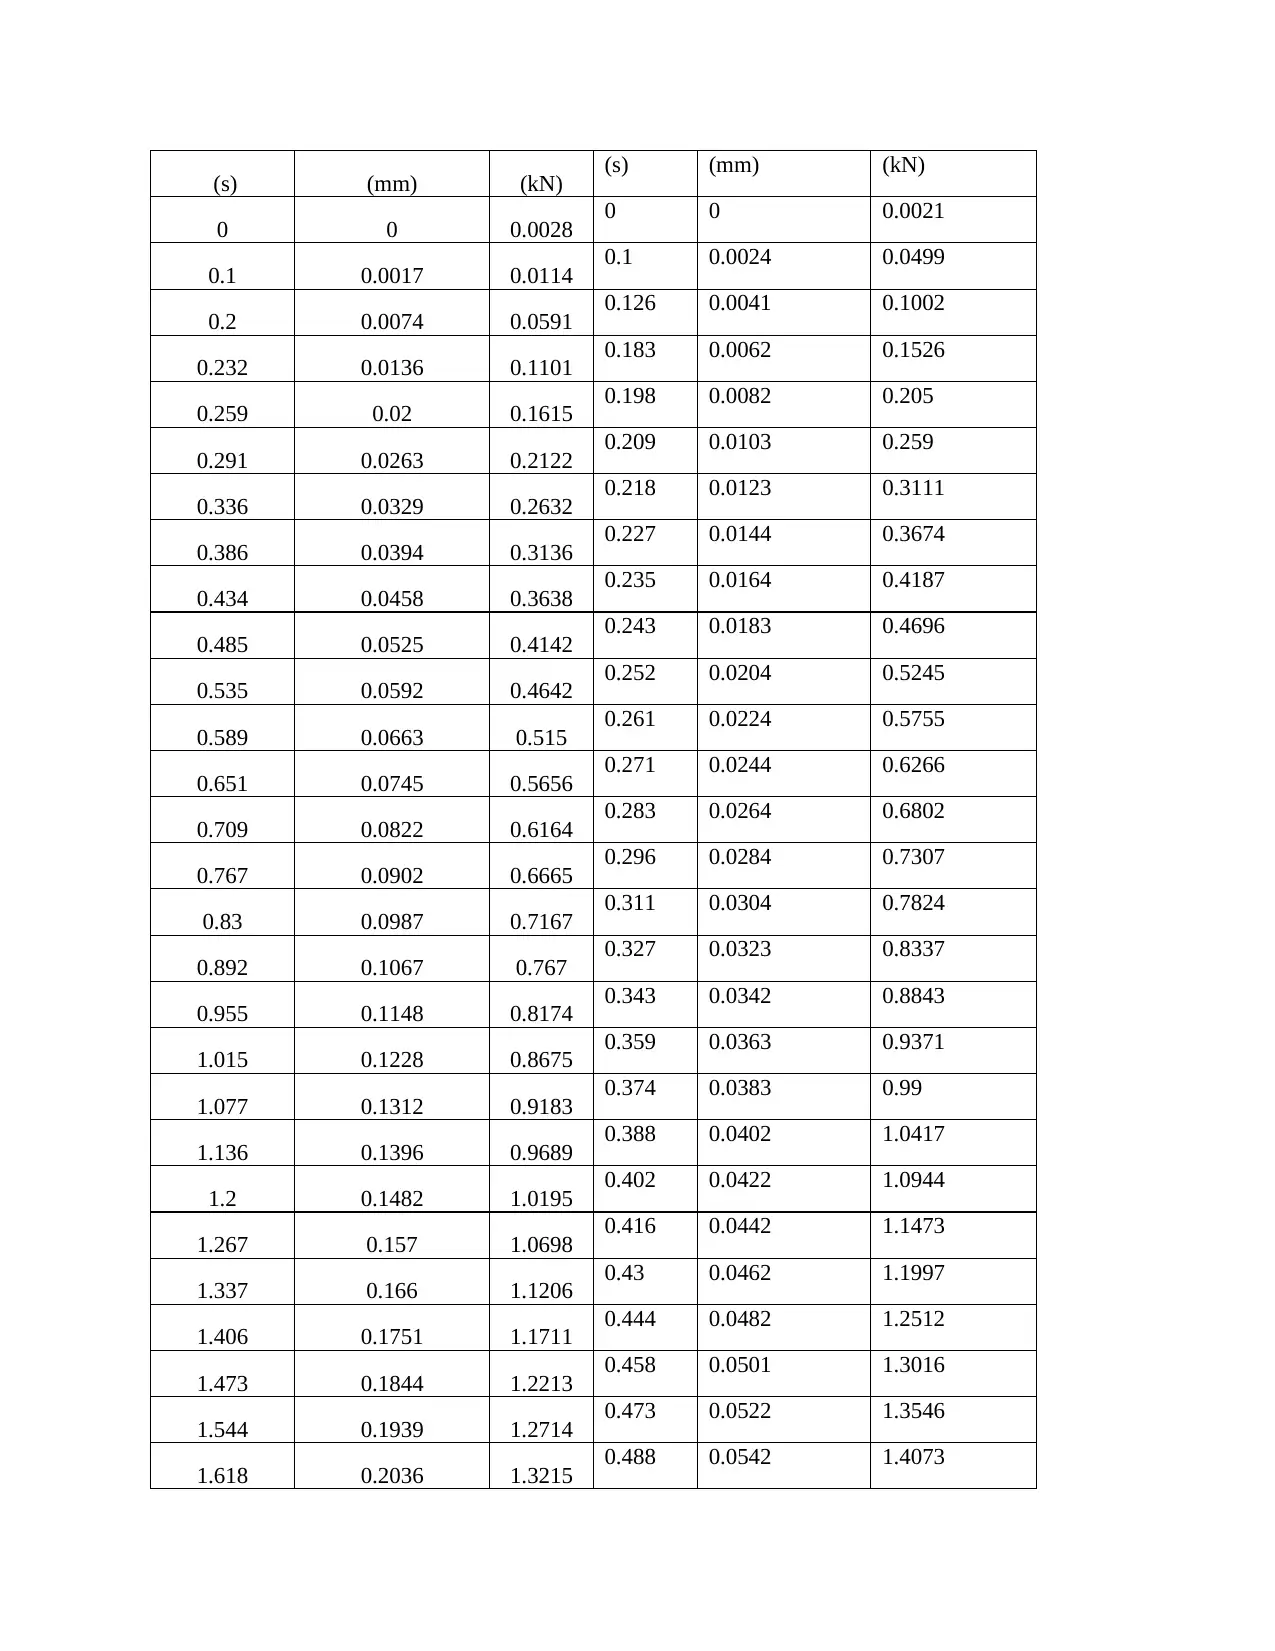
(s) (mm) (kN) (s) (mm) (kN)
0 0 0.0028 0 0 0.0021
0.1 0.0017 0.0114 0.1 0.0024 0.0499
0.2 0.0074 0.0591 0.126 0.0041 0.1002
0.232 0.0136 0.1101 0.183 0.0062 0.1526
0.259 0.02 0.1615 0.198 0.0082 0.205
0.291 0.0263 0.2122 0.209 0.0103 0.259
0.336 0.0329 0.2632 0.218 0.0123 0.3111
0.386 0.0394 0.3136 0.227 0.0144 0.3674
0.434 0.0458 0.3638 0.235 0.0164 0.4187
0.485 0.0525 0.4142 0.243 0.0183 0.4696
0.535 0.0592 0.4642 0.252 0.0204 0.5245
0.589 0.0663 0.515 0.261 0.0224 0.5755
0.651 0.0745 0.5656 0.271 0.0244 0.6266
0.709 0.0822 0.6164 0.283 0.0264 0.6802
0.767 0.0902 0.6665 0.296 0.0284 0.7307
0.83 0.0987 0.7167 0.311 0.0304 0.7824
0.892 0.1067 0.767 0.327 0.0323 0.8337
0.955 0.1148 0.8174 0.343 0.0342 0.8843
1.015 0.1228 0.8675 0.359 0.0363 0.9371
1.077 0.1312 0.9183 0.374 0.0383 0.99
1.136 0.1396 0.9689 0.388 0.0402 1.0417
1.2 0.1482 1.0195 0.402 0.0422 1.0944
1.267 0.157 1.0698 0.416 0.0442 1.1473
1.337 0.166 1.1206 0.43 0.0462 1.1997
1.406 0.1751 1.1711 0.444 0.0482 1.2512
1.473 0.1844 1.2213 0.458 0.0501 1.3016
1.544 0.1939 1.2714 0.473 0.0522 1.3546
1.618 0.2036 1.3215 0.488 0.0542 1.4073
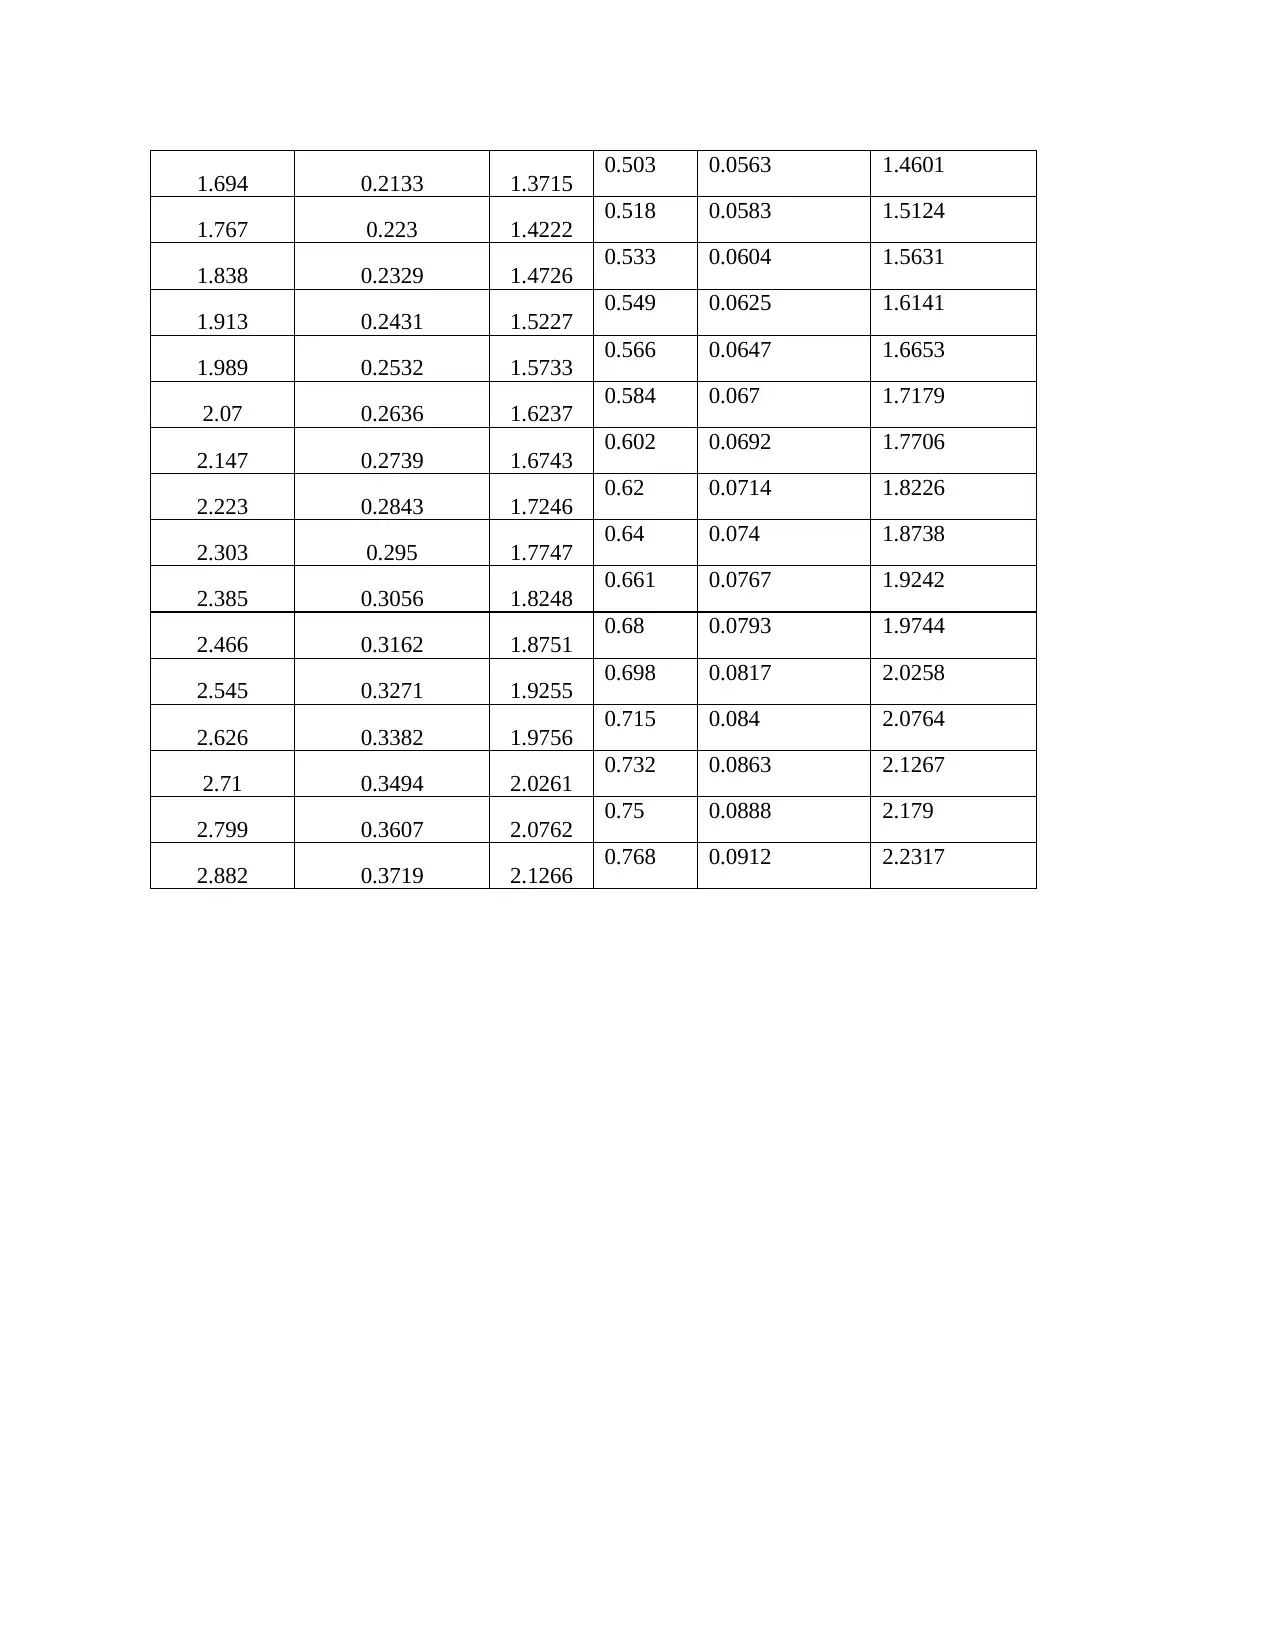
1.694 0.2133 1.3715 0.503 0.0563 1.4601
1.767 0.223 1.4222 0.518 0.0583 1.5124
1.838 0.2329 1.4726 0.533 0.0604 1.5631
1.913 0.2431 1.5227 0.549 0.0625 1.6141
1.989 0.2532 1.5733 0.566 0.0647 1.6653
2.07 0.2636 1.6237 0.584 0.067 1.7179
2.147 0.2739 1.6743 0.602 0.0692 1.7706
2.223 0.2843 1.7246 0.62 0.0714 1.8226
2.303 0.295 1.7747 0.64 0.074 1.8738
2.385 0.3056 1.8248 0.661 0.0767 1.9242
2.466 0.3162 1.8751 0.68 0.0793 1.9744
2.545 0.3271 1.9255 0.698 0.0817 2.0258
2.626 0.3382 1.9756 0.715 0.084 2.0764
2.71 0.3494 2.0261 0.732 0.0863 2.1267
2.799 0.3607 2.0762 0.75 0.0888 2.179
2.882 0.3719 2.1266 0.768 0.0912 2.2317
⊘ This is a preview!⊘
Do you want full access?
Subscribe today to unlock all pages.
Trusted by 1+ million students worldwide
0 2 4 6 8 10 12
0
0.5
1
1.5
2
2.5
3
3.5
4
4.5
5
Aluminium
Strain
Stress
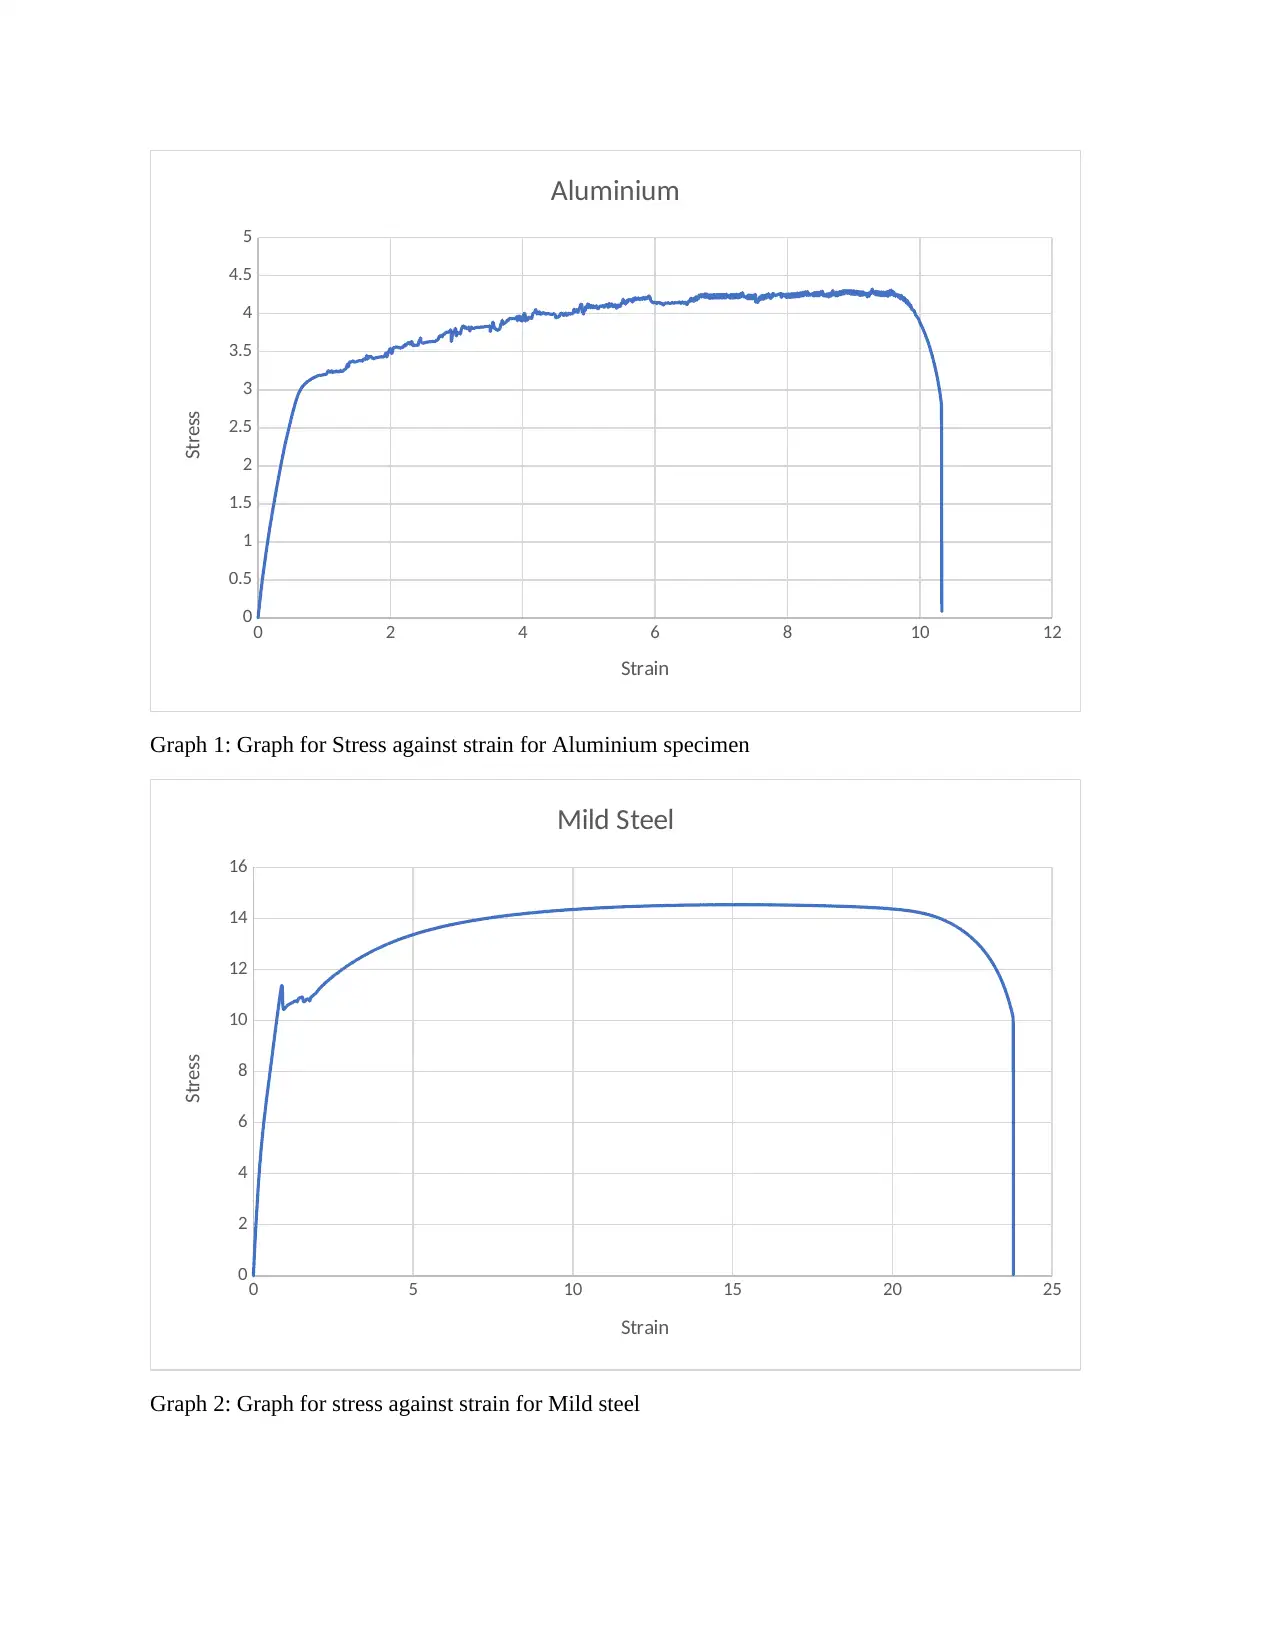
Graph 1: Graph for Stress against strain for Aluminium specimen
0 5 10 15 20 25
0
2
4
6
8
10
12
14
16
Mild Steel
Strain
Stress
Graph 2: Graph for stress against strain for Mild steel
0
0.5
1
1.5
2
2.5
3
3.5
4
4.5
5
Aluminium
Strain
Stress
Graph 1: Graph for Stress against strain for Aluminium specimen
0 5 10 15 20 25
0
2
4
6
8
10
12
14
16
Mild Steel
Strain
Stress
Graph 2: Graph for stress against strain for Mild steel
Paraphrase This Document
Need a fresh take? Get an instant paraphrase of this document with our AI Paraphraser
0 100 200 300 400 500 600 700 800 900 1000
0
2
4
6
8
10
12
14
16
Aluminium
Mild Steel
Aluminium and Mild steel
Strain (mm/mm)
Stress (Mpa)
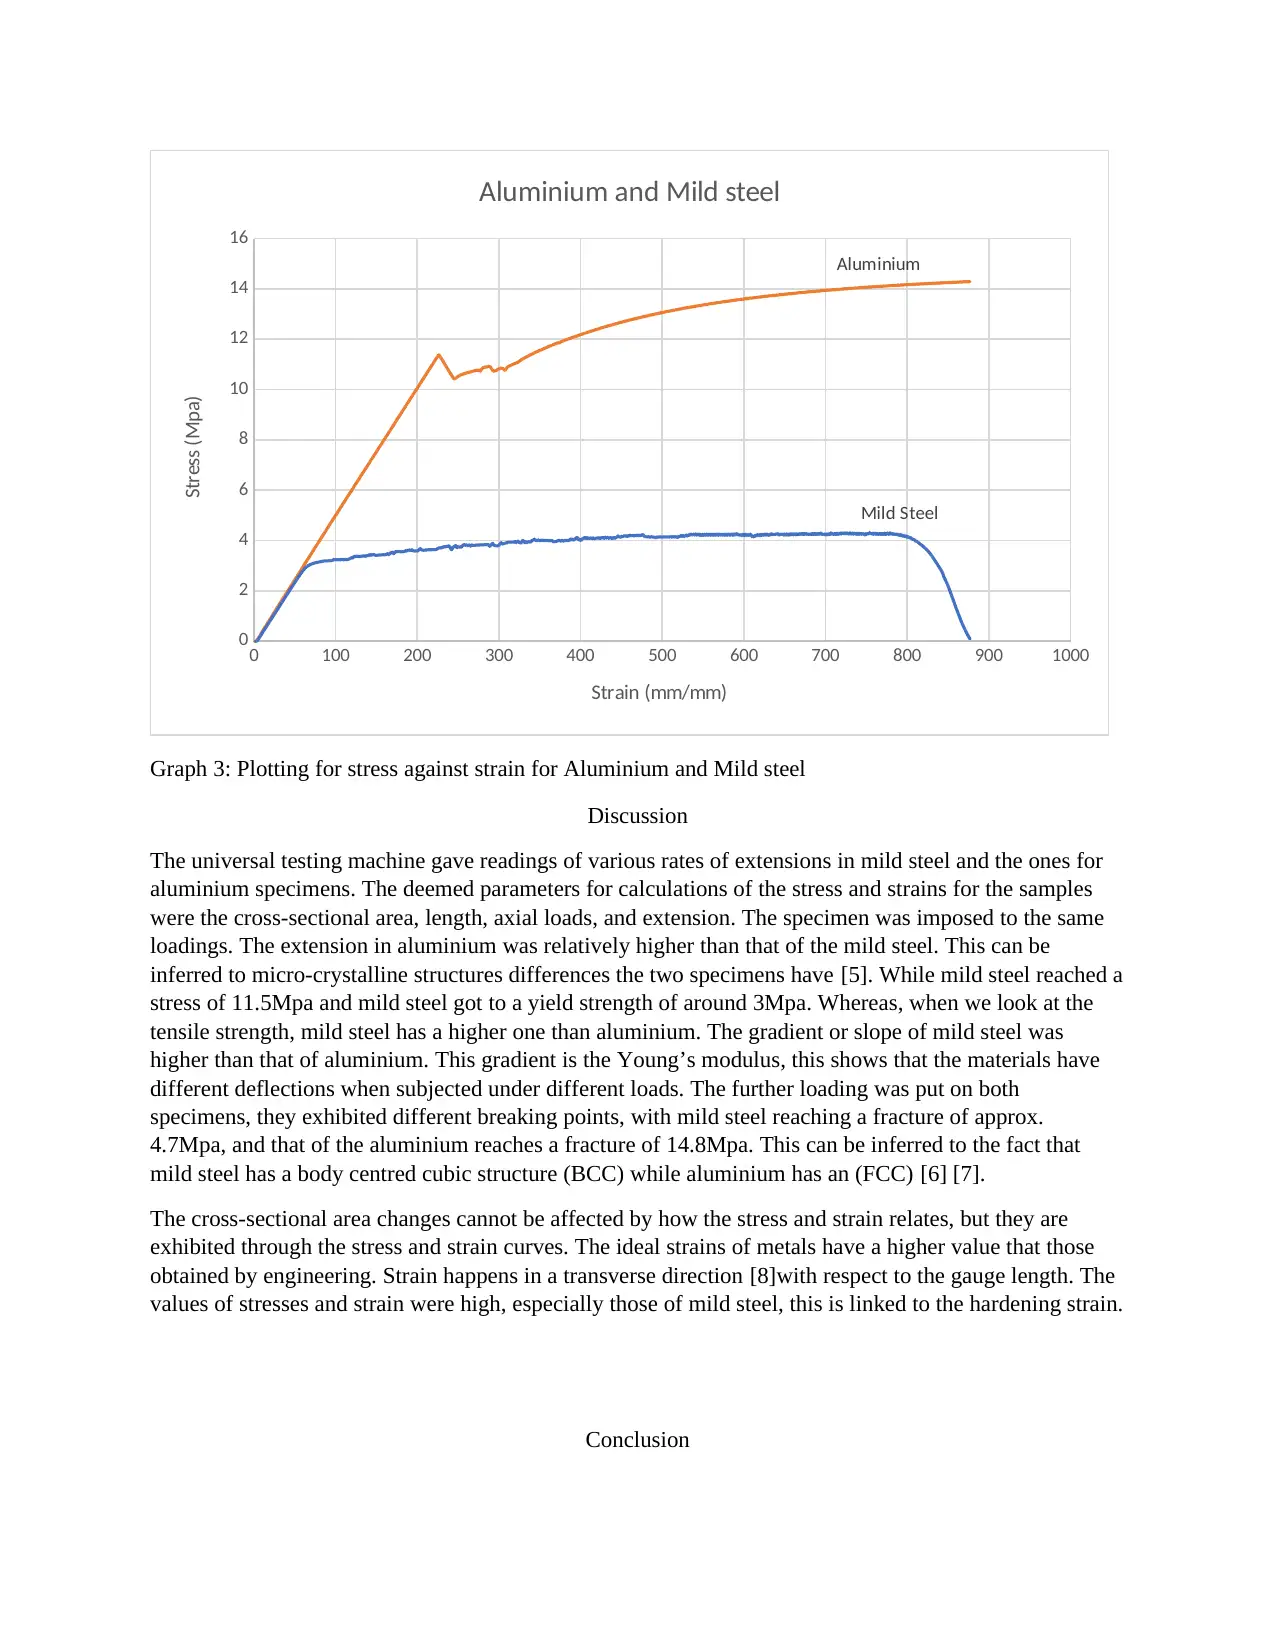
Graph 3: Plotting for stress against strain for Aluminium and Mild steel
Discussion
The universal testing machine gave readings of various rates of extensions in mild steel and the ones for
aluminium specimens. The deemed parameters for calculations of the stress and strains for the samples
were the cross-sectional area, length, axial loads, and extension. The specimen was imposed to the same
loadings. The extension in aluminium was relatively higher than that of the mild steel. This can be
inferred to micro-crystalline structures differences the two specimens have [5]. While mild steel reached a
stress of 11.5Mpa and mild steel got to a yield strength of around 3Mpa. Whereas, when we look at the
tensile strength, mild steel has a higher one than aluminium. The gradient or slope of mild steel was
higher than that of aluminium. This gradient is the Young’s modulus, this shows that the materials have
different deflections when subjected under different loads. The further loading was put on both
specimens, they exhibited different breaking points, with mild steel reaching a fracture of approx.
4.7Mpa, and that of the aluminium reaches a fracture of 14.8Mpa. This can be inferred to the fact that
mild steel has a body centred cubic structure (BCC) while aluminium has an (FCC) [6] [7].
The cross-sectional area changes cannot be affected by how the stress and strain relates, but they are
exhibited through the stress and strain curves. The ideal strains of metals have a higher value that those
obtained by engineering. Strain happens in a transverse direction [8]with respect to the gauge length. The
values of stresses and strain were high, especially those of mild steel, this is linked to the hardening strain.
Conclusion
0
2
4
6
8
10
12
14
16
Aluminium
Mild Steel
Aluminium and Mild steel
Strain (mm/mm)
Stress (Mpa)
Graph 3: Plotting for stress against strain for Aluminium and Mild steel
Discussion
The universal testing machine gave readings of various rates of extensions in mild steel and the ones for
aluminium specimens. The deemed parameters for calculations of the stress and strains for the samples
were the cross-sectional area, length, axial loads, and extension. The specimen was imposed to the same
loadings. The extension in aluminium was relatively higher than that of the mild steel. This can be
inferred to micro-crystalline structures differences the two specimens have [5]. While mild steel reached a
stress of 11.5Mpa and mild steel got to a yield strength of around 3Mpa. Whereas, when we look at the
tensile strength, mild steel has a higher one than aluminium. The gradient or slope of mild steel was
higher than that of aluminium. This gradient is the Young’s modulus, this shows that the materials have
different deflections when subjected under different loads. The further loading was put on both
specimens, they exhibited different breaking points, with mild steel reaching a fracture of approx.
4.7Mpa, and that of the aluminium reaches a fracture of 14.8Mpa. This can be inferred to the fact that
mild steel has a body centred cubic structure (BCC) while aluminium has an (FCC) [6] [7].
The cross-sectional area changes cannot be affected by how the stress and strain relates, but they are
exhibited through the stress and strain curves. The ideal strains of metals have a higher value that those
obtained by engineering. Strain happens in a transverse direction [8]with respect to the gauge length. The
values of stresses and strain were high, especially those of mild steel, this is linked to the hardening strain.
Conclusion
Now we know why many engineering applications, especially construction and fixing of machines or
machinery applications, requires mild steel. We understand that it is true that the crystalline structure of
the steel is tough enough to take in axial loads with higher values before they can fracture. Aluminium on
the other hand, required for application where materials of a much lower density, applications like
aerodynamics and motor vehicle industries, even electrical cabling needs the use of a lower density and a
higher conductivity, qualities that befits aluminium. The ductile abilities of aluminium are also attributed
to the fact they have a lower value of Young’s Modulus, and therefore even their deflection is lower. We
can therefore conclude that the experiment gives a true picture of what is claimed theoretically.
References
[1] J. Davies, Tensile Testing, ASM international, 2004.
[2] F. Michael and K. J. Asby, Materials and design, 2nd ed. Cambige University Press, 2008.
[3] J. G and Barry, Mechanics of Materials, 8th Edition ed., CL Engineering, 2012.
[4] K. D. Richard Budynas, Mc-Graw Hill Series in Mechanical Engineering, 10th Edition ed., Mc-Graw
Hill Series, 2014.
[5] M. Lolov, N. Dyulgerov and S. Velev, "Study Structure Formation of Microcrystalline Aluminum-
Silicon Alloys Subjected to Compaction," American Journal of Mechanical and Materials
Engineering, vol. 2, no. 3, pp. 28-32, 2018.
[6] S. Sinha, "Why Aluminium is not BCC or HCP?," Quora, 26 December 2016. [Online]. Available:
https://www.quora.com/Why-Aluminium-is-not-BCC-or-HCP. [Accessed 17 May 2019].
[7] B. Capudean, "Metallurgy Matters: The structure of metal," The fabricator.com, 24 April 2013.
[Online]. Available: https://www.thefabricator.com/article/metalsmaterials/the-structure-of-metal.
[Accessed 17 May 2019].
[8] D. Holmes, "Mechanics of materials," Mechanics of Slender Structures, 24 September 2014 .
[Online]. Available: https://www.bu.edu/moss/mechanics-of-materials-strain/. [Accessed 17 May
2019].
Appendix
⊘ This is a preview!⊘
Do you want full access?
Subscribe today to unlock all pages.
Trusted by 1+ million students worldwide
Paraphrase This Document
Need a fresh take? Get an instant paraphrase of this document with our AI Paraphraser
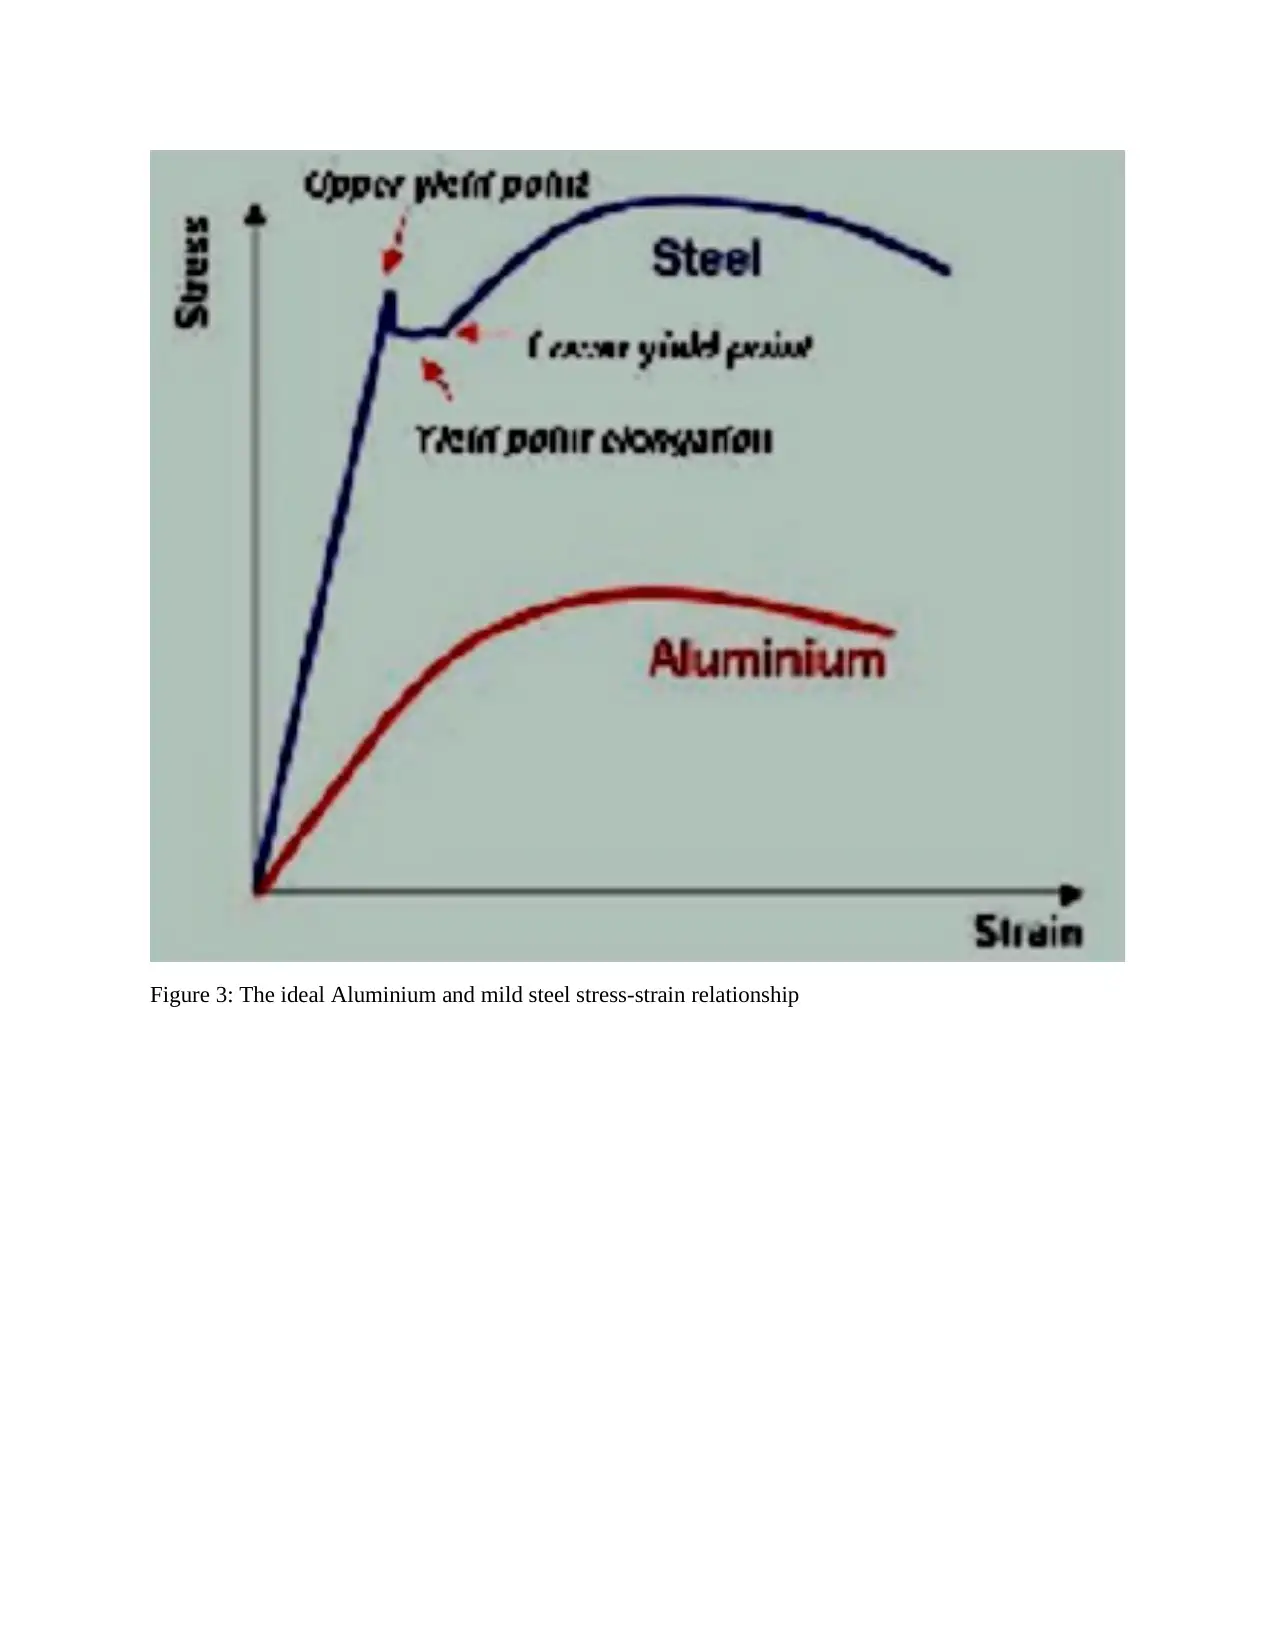
Figure 3: The ideal Aluminium and mild steel stress-strain relationship
1 out of 11
Related Documents


Your All-in-One AI-Powered Toolkit for Academic Success.
+13062052269
info@desklib.com
Available 24*7 on WhatsApp / Email
![[object Object]](/_next/static/media/star-bottom.7253800d.svg)
Unlock your academic potential
Copyright © 2020–2026 A2Z Services. All Rights Reserved. Developed and managed by ZUCOL.