Comparative Analysis: Terms of Trade Trends in USA and China
VerifiedAdded on 2022/09/09
|21
|4128
|12
Report
AI Summary
This report provides an in-depth analysis of the terms of trade trends between the USA and China from 2008 to 2018. The study is divided into three phases: 2008-2013, 2013-2018, and a summary of the entire decade. It explores how the terms of trade, defined as the ratio of export prices to import prices, have evolved in both countries, highlighting key fluctuations and underlying factors. The report examines the impact of the 2007-2008 global financial crisis, changes in economic policies, and the differing economic systems of the USA (capitalism) and China (socialism) on trade dynamics. It further investigates the factors influencing these trends, such as monetary policies and global market volatility, and assesses the effects of these terms of trade on the economic welfare of both nations. The analysis includes data visualizations and comparative insights to provide a comprehensive understanding of international trade and its impact on the world's two largest economies.

Paraphrase This Document
Need a fresh take? Get an instant paraphrase of this document with our AI Paraphraser
Trends in terms of trade: USA and China 2
Executive summary
The international and global market has experienced on increase in international trade over the
last couple of decades due to increased globalization that has been propelled by technology
advancements and its fast and effective adoption worldwide. This has opened markets that were
un-reachable leading to the development of demand and supply, therefore, increasing foreign
trade between countries. Terms of trade in an international economic concept that is essential in
determining the state of the economy of a country through carrying out its business activities,
these business activities can be summed up to a county’s exports and imports.USA and China
will be the main focus in the paper from a perspective of TOT. The trends in the terms of trade
will be analyzed with the phase where the 1st phases are from 2008-2013 second phases 2013-
2018 and the final phase is the summary of 2008-2018. Additionally, the factors that are
affecting the trends in terms of trade of the USA and China will also be depicted in the paper.
Finally, the various effects on the economic welfare of China and USA by the terms of trade will
be illustrated in the paper too
Trends in terms of trade: USA and China 3
Table of Contents
Terms of trade: China and USA......................................................................................................4
Introduction......................................................................................................................................4
A clear perspective on China and USA economies.........................................................................5
Terms of trade trend the USA..........................................................................................................7
Terms of trade trend China............................................................................................................11
Factors affecting the Trend in terms of trade in the USA..............................................................14
Factors affecting the Trend in terms of trade in China..................................................................15
Effects of the terms of trade on the welfare of the USA and China..............................................16
Conclusion.....................................................................................................................................17
References......................................................................................................................................18
⊘ This is a preview!⊘
Do you want full access?
Subscribe today to unlock all pages.
Trusted by 1+ million students worldwide
Trends in terms of trade: USA and China 4
Part One
Terms of trade: China and USA
Introduction
International trade between countries has grown exponentially over the last couple of decades
thanks to the increase in technological advancements and its adoption, which has propelled
globalization in the long run (Eriksen 2018). From an economics perspective, comparative
advantage is the main basis of the international trade of goods and services between countries.
There are various concepts, principles or variables that are used to monitor or analyses the
various aspects of international trade among them is the Terms of trade (TOT). Terms of trade in
an international economic concept that is essential in determining the state of the economy of a
country through carrying out its business activities, these business activities can be summed up
to a county’s exports and. Therefore, from this context, the definition of TOT can be derived to
basically mean the rate at which a country’s exports exchange for its imports (Schmitt‐Grohé and
Uribe 2018).
The prices of imports and exports in international trade naturally govern the terms of trade.
Therefore, TOT measurement requires price indices depiction of imported and exported goods
and conducting a comparison of the two. TOT would definitely increase when the exported
goods rise in prices and on the other hand TOT will decrease with the rise in imported goods.
The terms of trade of a country measure the country’s export prices in relation to its import
prices and it expressed as (index of export /index of import)x 100 (Kulish and Rees 2017).
A good example for achieving a clear understanding of the expression, if an economy is only
exporting mangoes and importing oranges, the terms of trades are basically the price of mangoes
divided by the prices of oranges, or in other words is how mangoes can be obtained for a unit of
Paraphrase This Document
Need a fresh take? Get an instant paraphrase of this document with our AI Paraphraser
Trends in terms of trade: USA and China 5
oranges The terms of trade have been affected by various trends over the years, this research
paper will focus on these trends through the perspective of two countries; China and USA. Trend
analysis for the last 10 years of the two countries will be illustrated backed up with factual
diagrams. This information will then be helpful in analyzing the terms of trade impact on the
welfare of the two countries
A clear perspective on China and USA economies
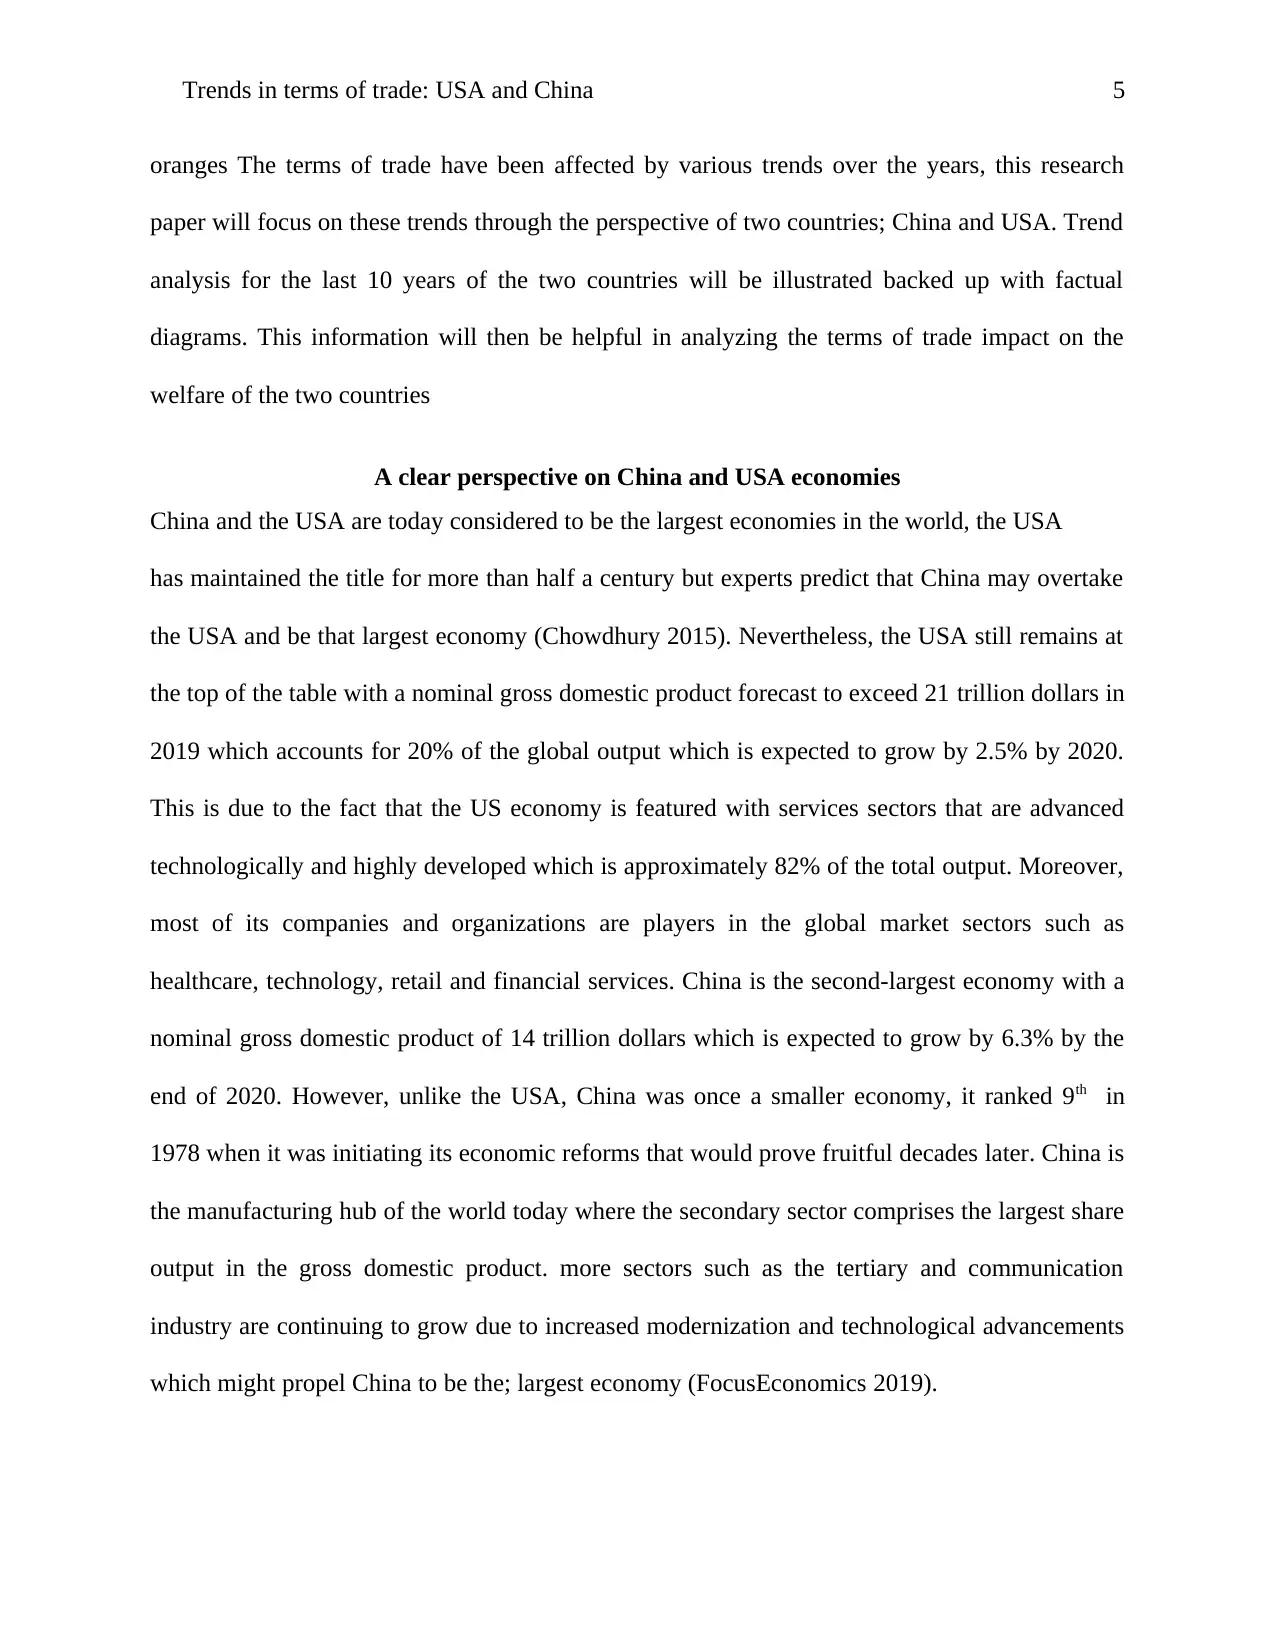
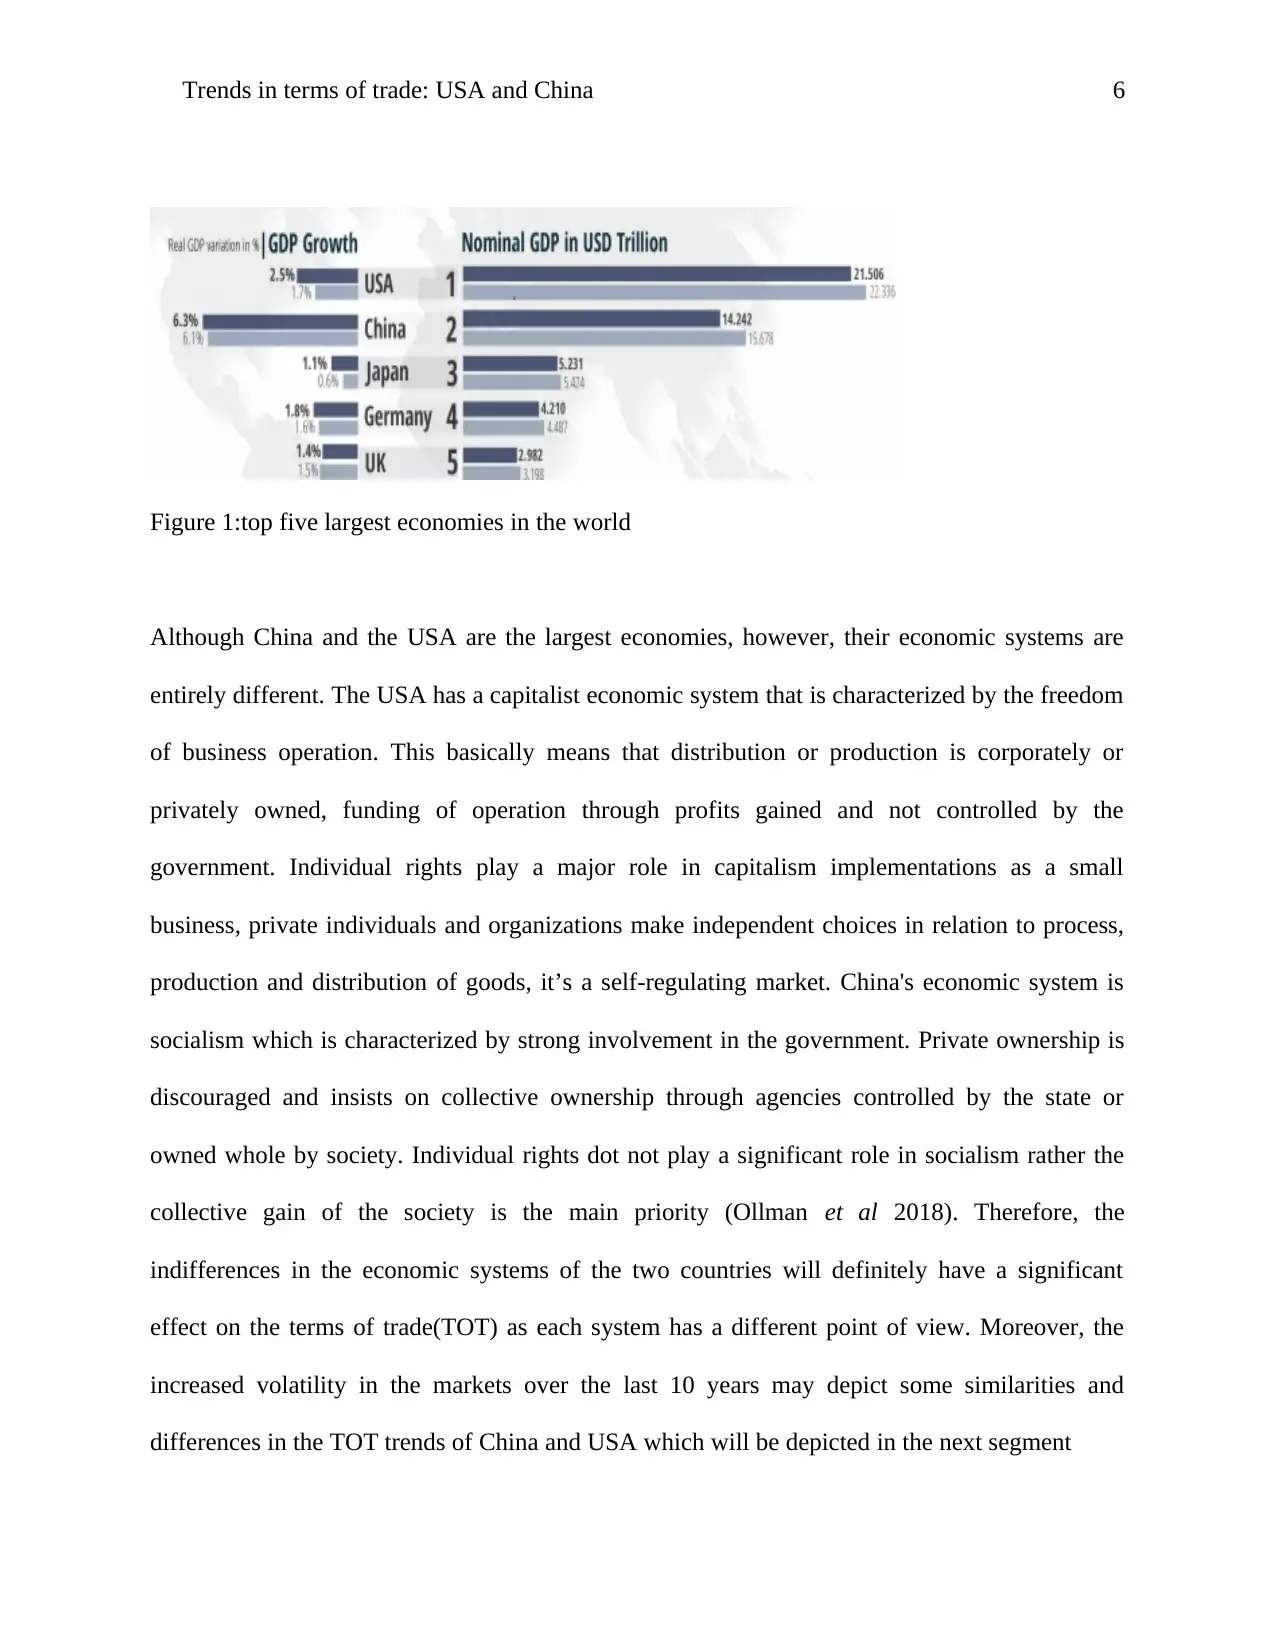
China and the USA are today considered to be the largest economies in the world, the USA
has maintained the title for more than half a century but experts predict that China may overtake
the USA and be that largest economy (Chowdhury 2015). Nevertheless, the USA still remains at
the top of the table with a nominal gross domestic product forecast to exceed 21 trillion dollars in
2019 which accounts for 20% of the global output which is expected to grow by 2.5% by 2020.
This is due to the fact that the US economy is featured with services sectors that are advanced
technologically and highly developed which is approximately 82% of the total output. Moreover,
most of its companies and organizations are players in the global market sectors such as
healthcare, technology, retail and financial services. China is the second-largest economy with a
nominal gross domestic product of 14 trillion dollars which is expected to grow by 6.3% by the
end of 2020. However, unlike the USA, China was once a smaller economy, it ranked 9th in
1978 when it was initiating its economic reforms that would prove fruitful decades later. China is
the manufacturing hub of the world today where the secondary sector comprises the largest share
output in the gross domestic product. more sectors such as the tertiary and communication
industry are continuing to grow due to increased modernization and technological advancements
which might propel China to be the; largest economy (FocusEconomics 2019).
oranges The terms of trade have been affected by various trends over the years, this research
paper will focus on these trends through the perspective of two countries; China and USA. Trend
analysis for the last 10 years of the two countries will be illustrated backed up with factual
diagrams. This information will then be helpful in analyzing the terms of trade impact on the
welfare of the two countries
A clear perspective on China and USA economies
China and the USA are today considered to be the largest economies in the world, the USA
has maintained the title for more than half a century but experts predict that China may overtake
the USA and be that largest economy (Chowdhury 2015). Nevertheless, the USA still remains at
the top of the table with a nominal gross domestic product forecast to exceed 21 trillion dollars in
2019 which accounts for 20% of the global output which is expected to grow by 2.5% by 2020.
This is due to the fact that the US economy is featured with services sectors that are advanced
technologically and highly developed which is approximately 82% of the total output. Moreover,
most of its companies and organizations are players in the global market sectors such as
healthcare, technology, retail and financial services. China is the second-largest economy with a
nominal gross domestic product of 14 trillion dollars which is expected to grow by 6.3% by the
end of 2020. However, unlike the USA, China was once a smaller economy, it ranked 9th in
1978 when it was initiating its economic reforms that would prove fruitful decades later. China is
the manufacturing hub of the world today where the secondary sector comprises the largest share
output in the gross domestic product. more sectors such as the tertiary and communication
industry are continuing to grow due to increased modernization and technological advancements
which might propel China to be the; largest economy (FocusEconomics 2019).
Trends in terms of trade: USA and China 6
Figure 1:top five largest economies in the world
Although China and the USA are the largest economies, however, their economic systems are
entirely different. The USA has a capitalist economic system that is characterized by the freedom
of business operation. This basically means that distribution or production is corporately or
privately owned, funding of operation through profits gained and not controlled by the
government. Individual rights play a major role in capitalism implementations as a small
business, private individuals and organizations make independent choices in relation to process,
production and distribution of goods, it’s a self-regulating market. China's economic system is
socialism which is characterized by strong involvement in the government. Private ownership is
discouraged and insists on collective ownership through agencies controlled by the state or
owned whole by society. Individual rights dot not play a significant role in socialism rather the
collective gain of the society is the main priority (Ollman et al 2018). Therefore, the
indifferences in the economic systems of the two countries will definitely have a significant
effect on the terms of trade(TOT) as each system has a different point of view. Moreover, the
increased volatility in the markets over the last 10 years may depict some similarities and
differences in the TOT trends of China and USA which will be depicted in the next segment
⊘ This is a preview!⊘
Do you want full access?
Subscribe today to unlock all pages.
Trusted by 1+ million students worldwide
Trends in terms of trade: USA and China 7
Part Two
Terms of trade trend the USA
In order to understand the terms of trade trend in the USA, this section will be divided into three
phases the first phase will be 2008-2013 and the second phase will be 2013-2018 and the last
phase will be the whole summary of the ten-year trend and projected forecast.
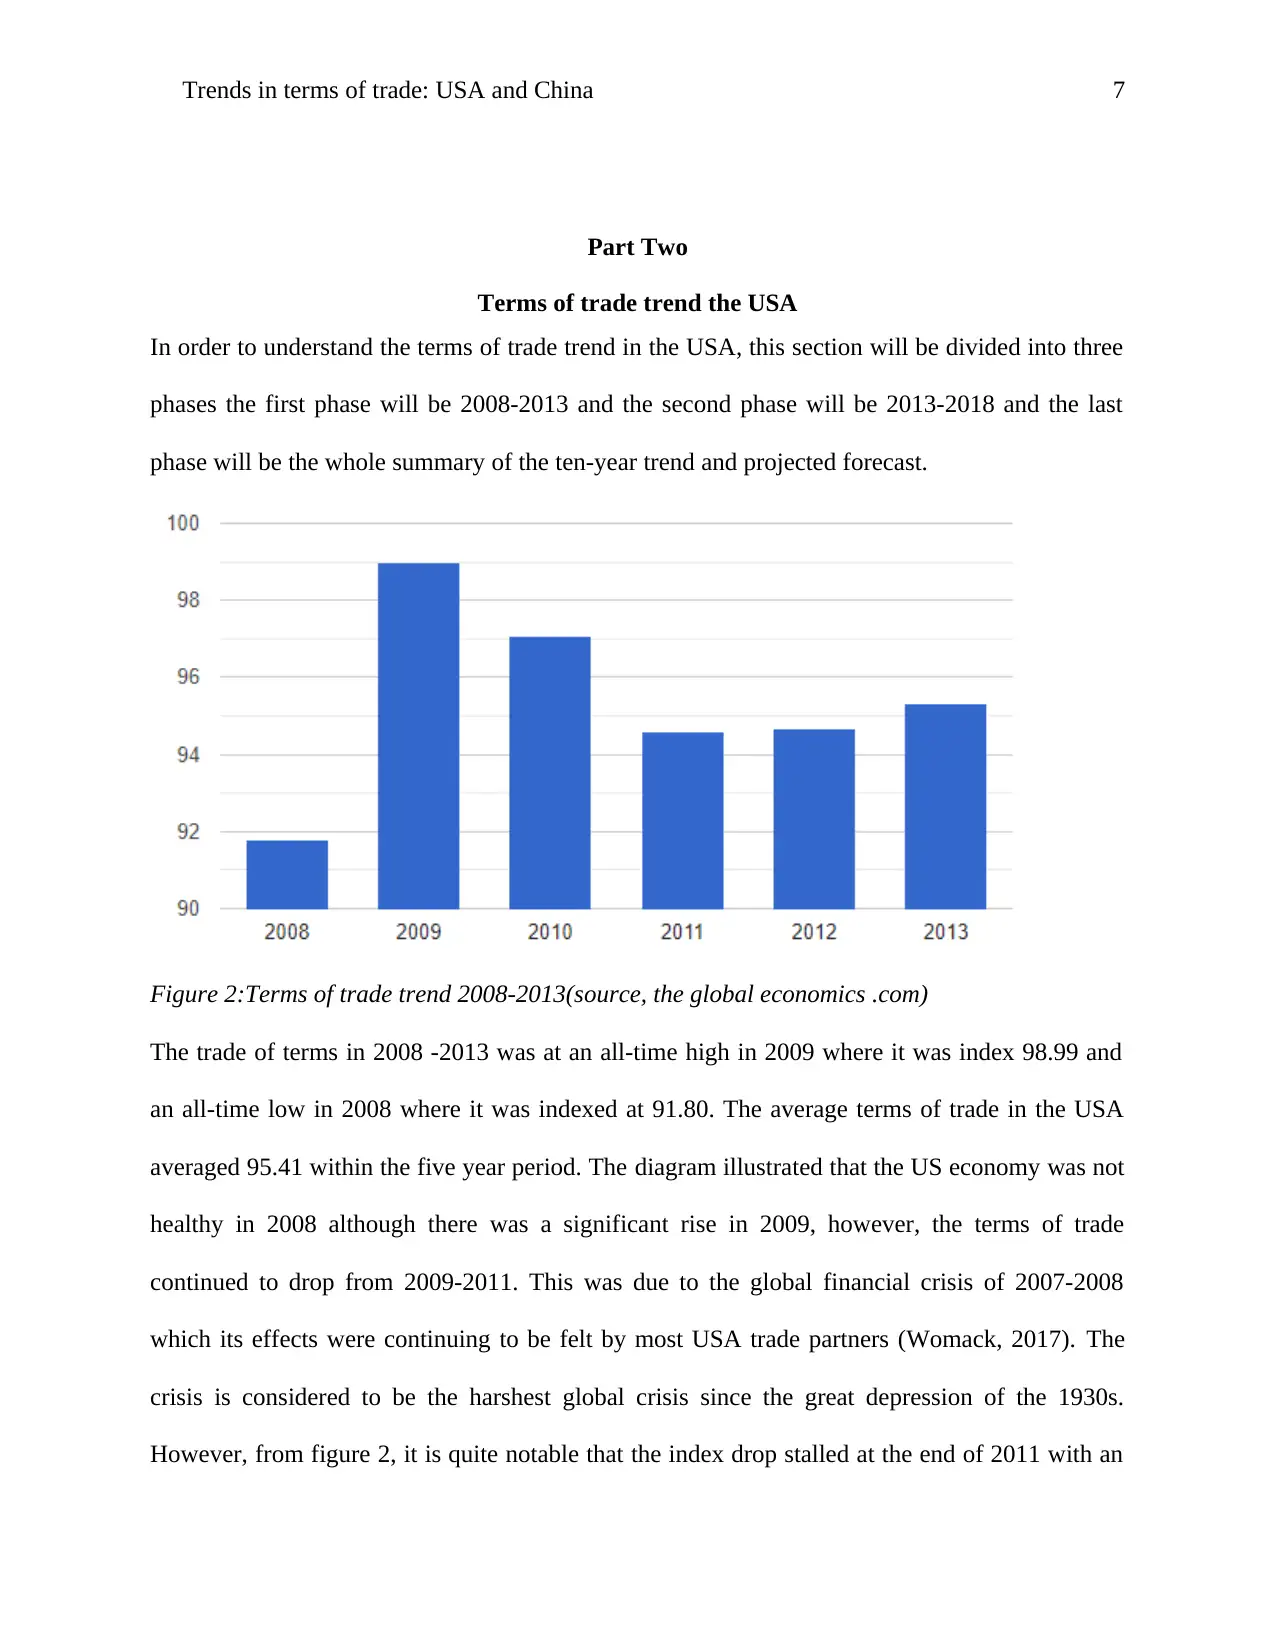
Figure 2:Terms of trade trend 2008-2013(source, the global economics .com)
The trade of terms in 2008 -2013 was at an all-time high in 2009 where it was index 98.99 and
an all-time low in 2008 where it was indexed at 91.80. The average terms of trade in the USA
averaged 95.41 within the five year period. The diagram illustrated that the US economy was not
healthy in 2008 although there was a significant rise in 2009, however, the terms of trade
continued to drop from 2009-2011. This was due to the global financial crisis of 2007-2008
which its effects were continuing to be felt by most USA trade partners (Womack, 2017). The
crisis is considered to be the harshest global crisis since the great depression of the 1930s.
However, from figure 2, it is quite notable that the index drop stalled at the end of 2011 with an
Part Two
Terms of trade trend the USA
In order to understand the terms of trade trend in the USA, this section will be divided into three
phases the first phase will be 2008-2013 and the second phase will be 2013-2018 and the last
phase will be the whole summary of the ten-year trend and projected forecast.
Figure 2:Terms of trade trend 2008-2013(source, the global economics .com)
The trade of terms in 2008 -2013 was at an all-time high in 2009 where it was index 98.99 and
an all-time low in 2008 where it was indexed at 91.80. The average terms of trade in the USA
averaged 95.41 within the five year period. The diagram illustrated that the US economy was not
healthy in 2008 although there was a significant rise in 2009, however, the terms of trade
continued to drop from 2009-2011. This was due to the global financial crisis of 2007-2008
which its effects were continuing to be felt by most USA trade partners (Womack, 2017). The
crisis is considered to be the harshest global crisis since the great depression of the 1930s.
However, from figure 2, it is quite notable that the index drop stalled at the end of 2011 with an
Paraphrase This Document
Need a fresh take? Get an instant paraphrase of this document with our AI Paraphraser
Trends in terms of trade: USA and China 8
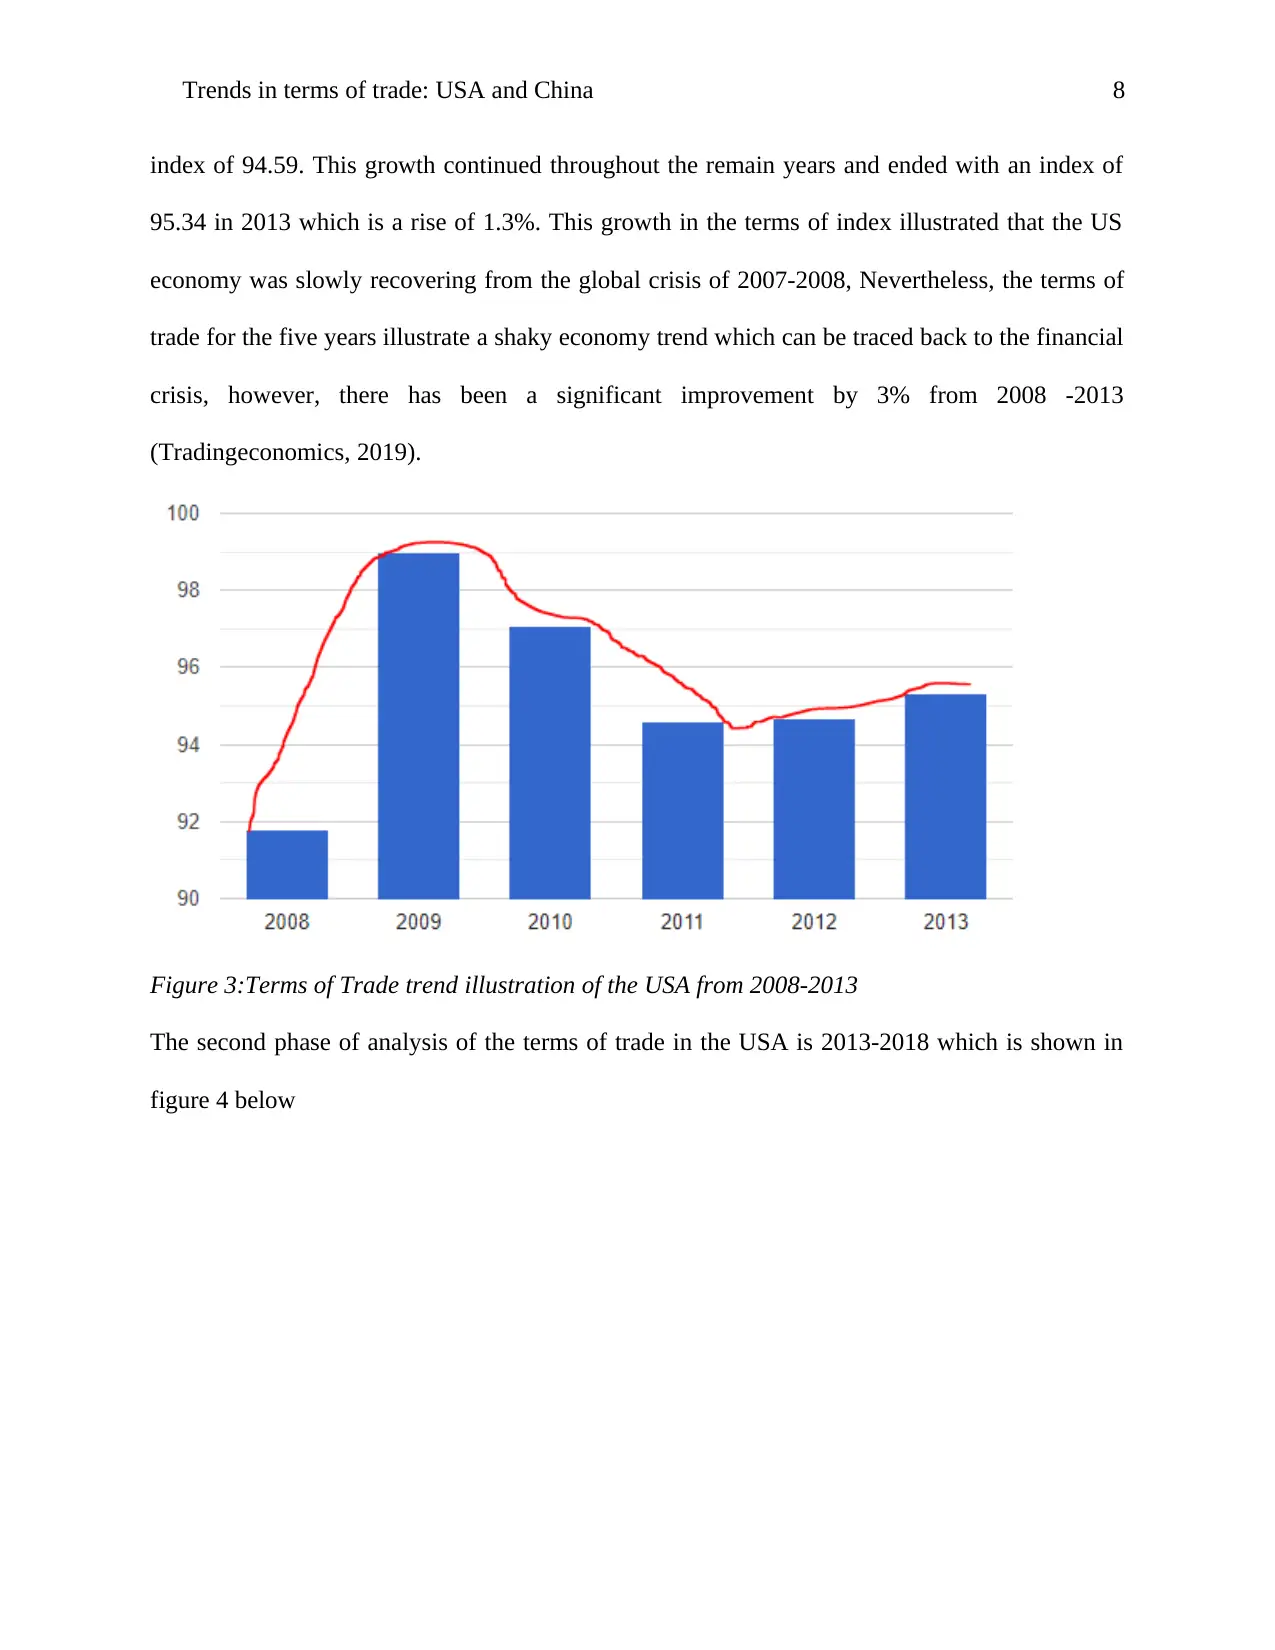
index of 94.59. This growth continued throughout the remain years and ended with an index of
95.34 in 2013 which is a rise of 1.3%. This growth in the terms of index illustrated that the US
economy was slowly recovering from the global crisis of 2007-2008, Nevertheless, the terms of
trade for the five years illustrate a shaky economy trend which can be traced back to the financial
crisis, however, there has been a significant improvement by 3% from 2008 -2013
(Tradingeconomics, 2019).
Figure 3:Terms of Trade trend illustration of the USA from 2008-2013
The second phase of analysis of the terms of trade in the USA is 2013-2018 which is shown in
figure 4 below
Trends in terms of trade: USA and China 9
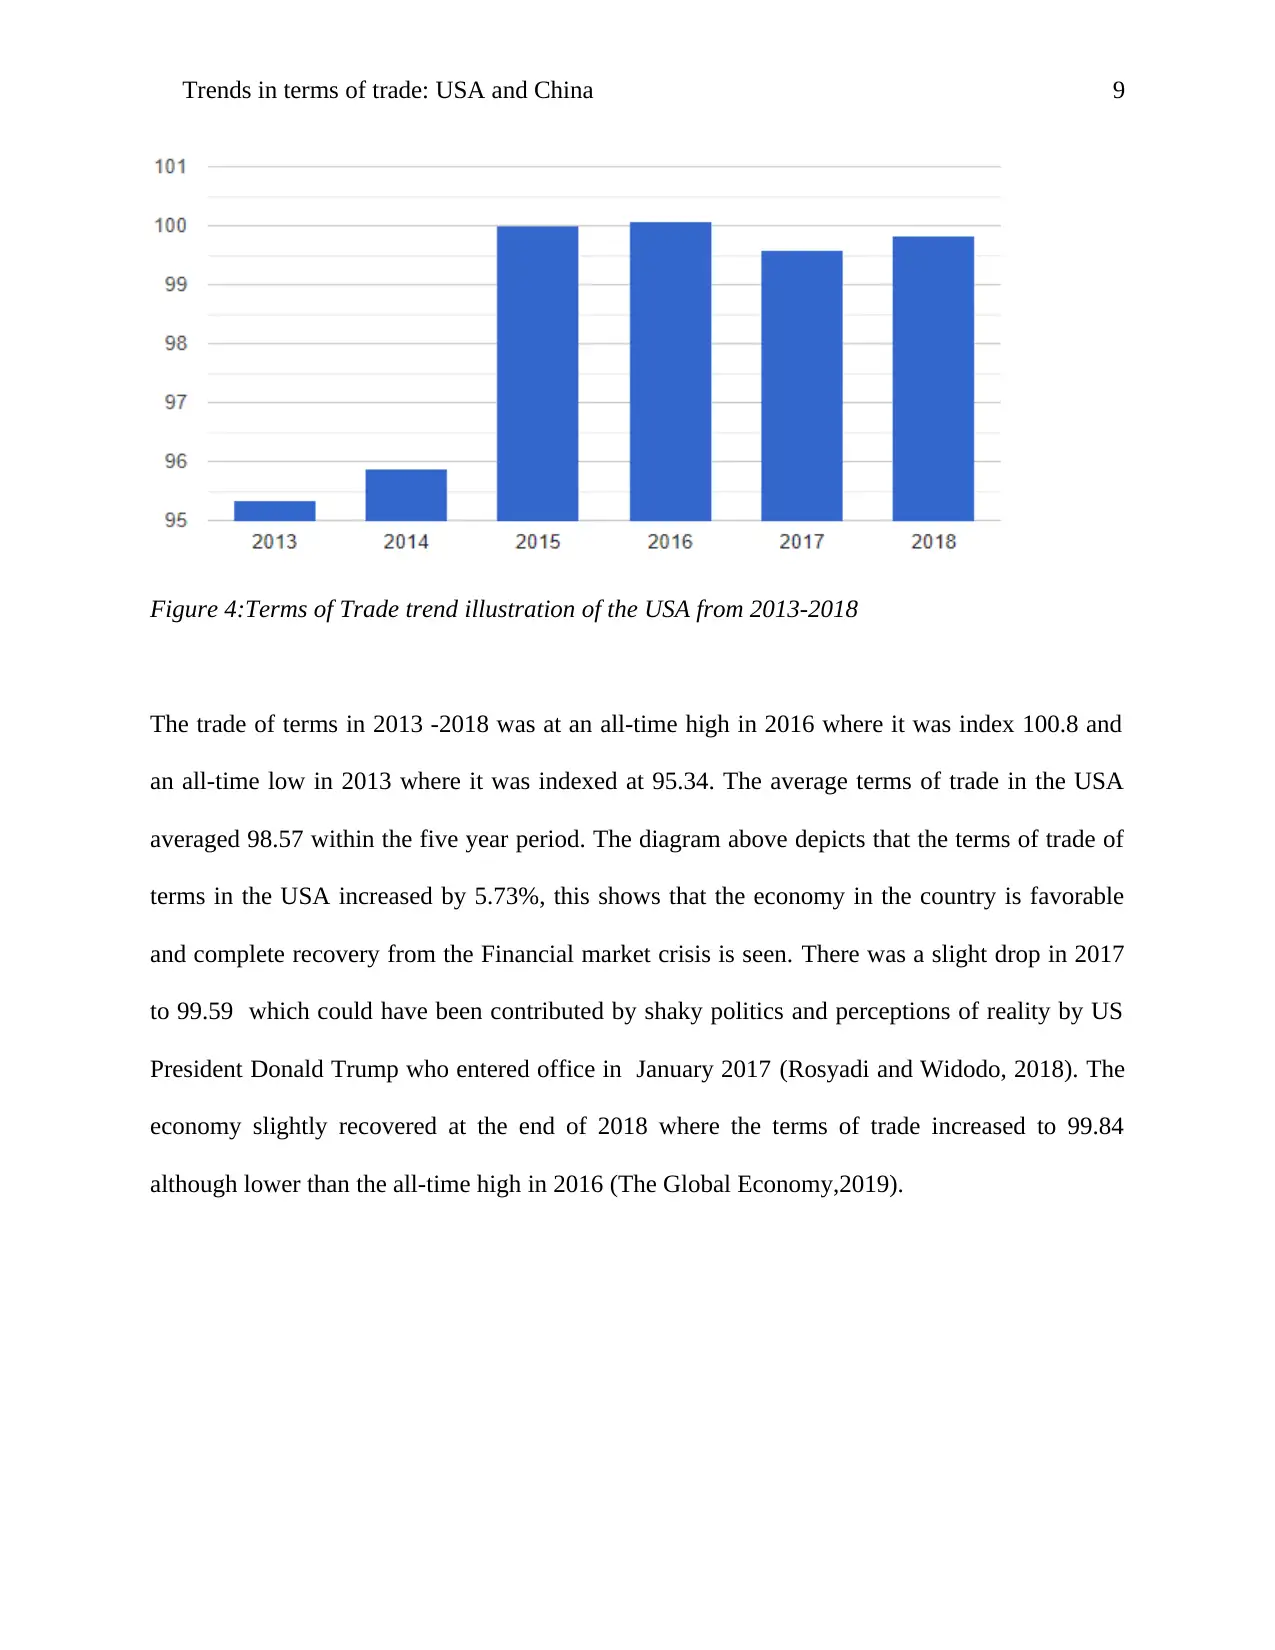
Figure 4:Terms of Trade trend illustration of the USA from 2013-2018
The trade of terms in 2013 -2018 was at an all-time high in 2016 where it was index 100.8 and
an all-time low in 2013 where it was indexed at 95.34. The average terms of trade in the USA
averaged 98.57 within the five year period. The diagram above depicts that the terms of trade of
terms in the USA increased by 5.73%, this shows that the economy in the country is favorable
and complete recovery from the Financial market crisis is seen. There was a slight drop in 2017
to 99.59 which could have been contributed by shaky politics and perceptions of reality by US
President Donald Trump who entered office in January 2017 (Rosyadi and Widodo, 2018). The
economy slightly recovered at the end of 2018 where the terms of trade increased to 99.84
although lower than the all-time high in 2016 (The Global Economy,2019).
⊘ This is a preview!⊘
Do you want full access?
Subscribe today to unlock all pages.
Trusted by 1+ million students worldwide
Trends in terms of trade: USA and China 10
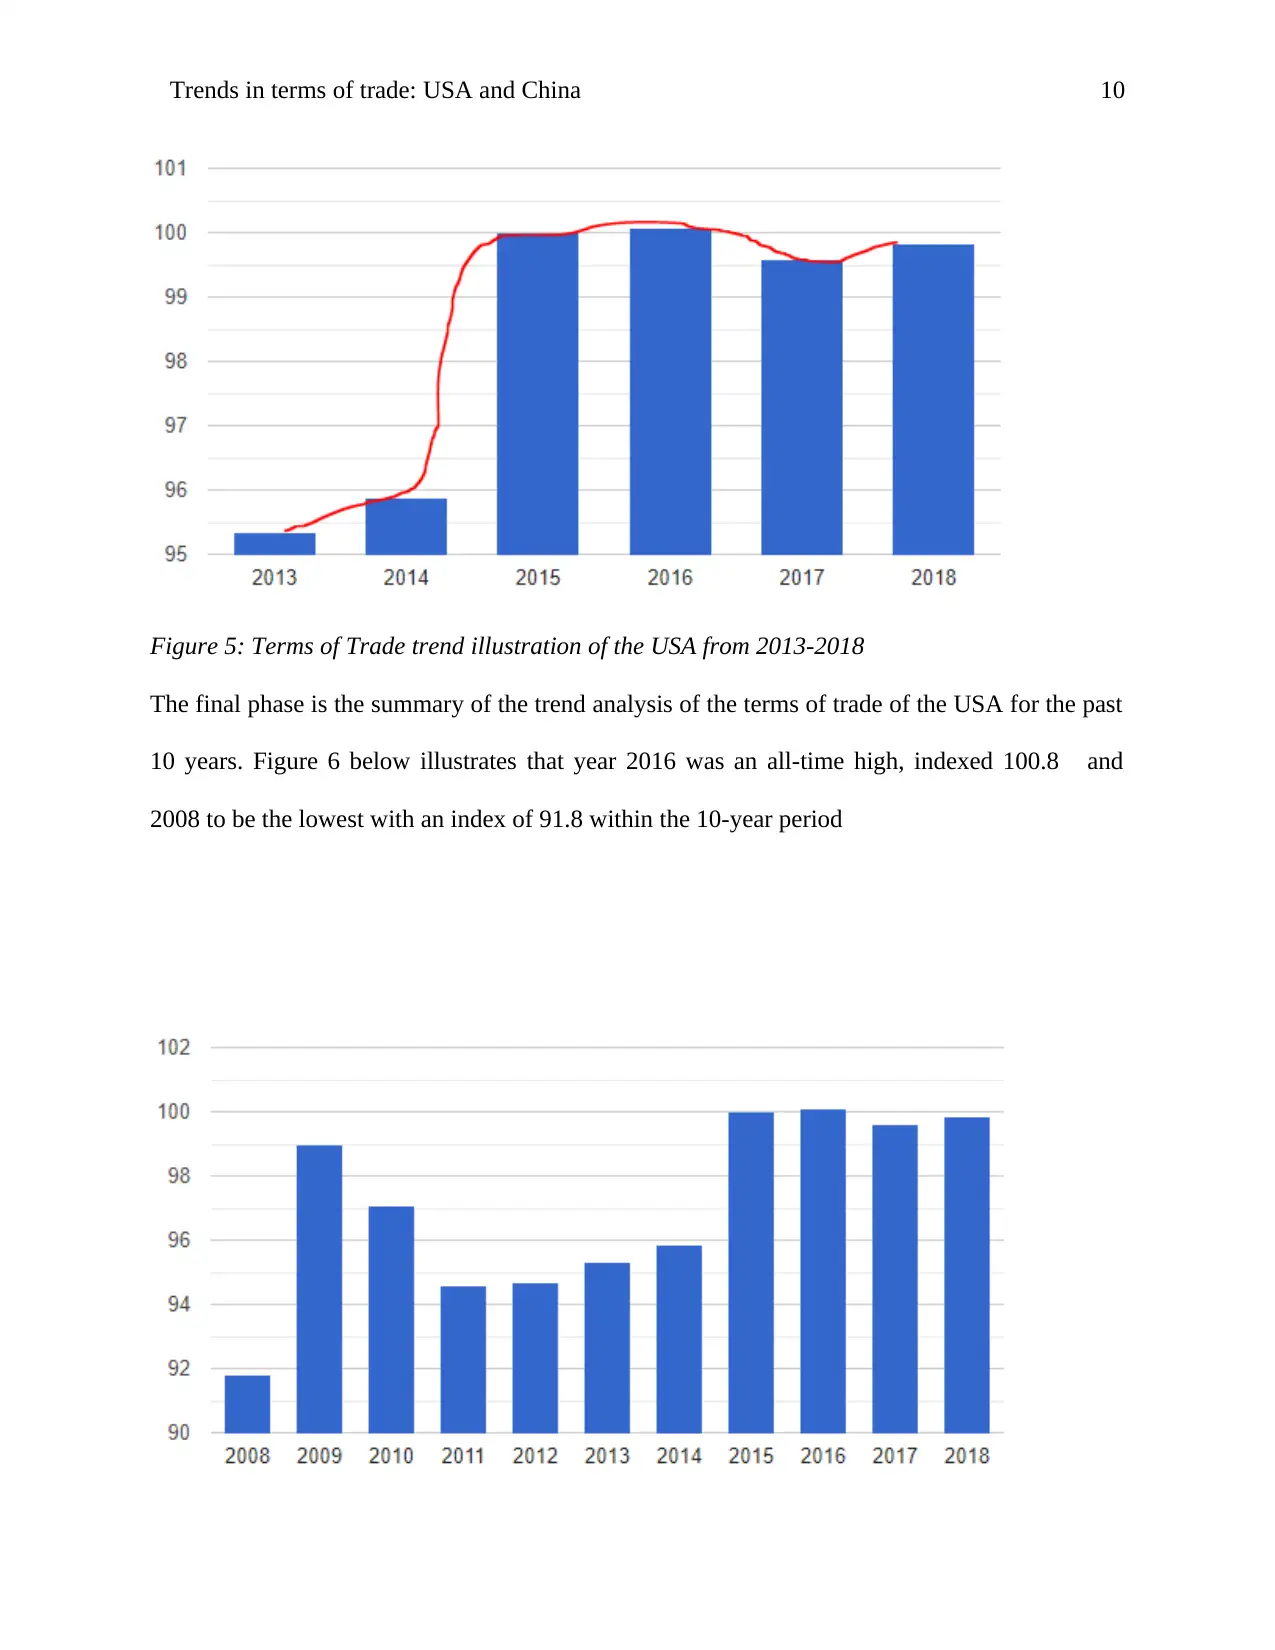
Figure 5: Terms of Trade trend illustration of the USA from 2013-2018
The final phase is the summary of the trend analysis of the terms of trade of the USA for the past
10 years. Figure 6 below illustrates that year 2016 was an all-time high, indexed 100.8 and
2008 to be the lowest with an index of 91.8 within the 10-year period
Paraphrase This Document
Need a fresh take? Get an instant paraphrase of this document with our AI Paraphraser
Trends in terms of trade: USA and China 11
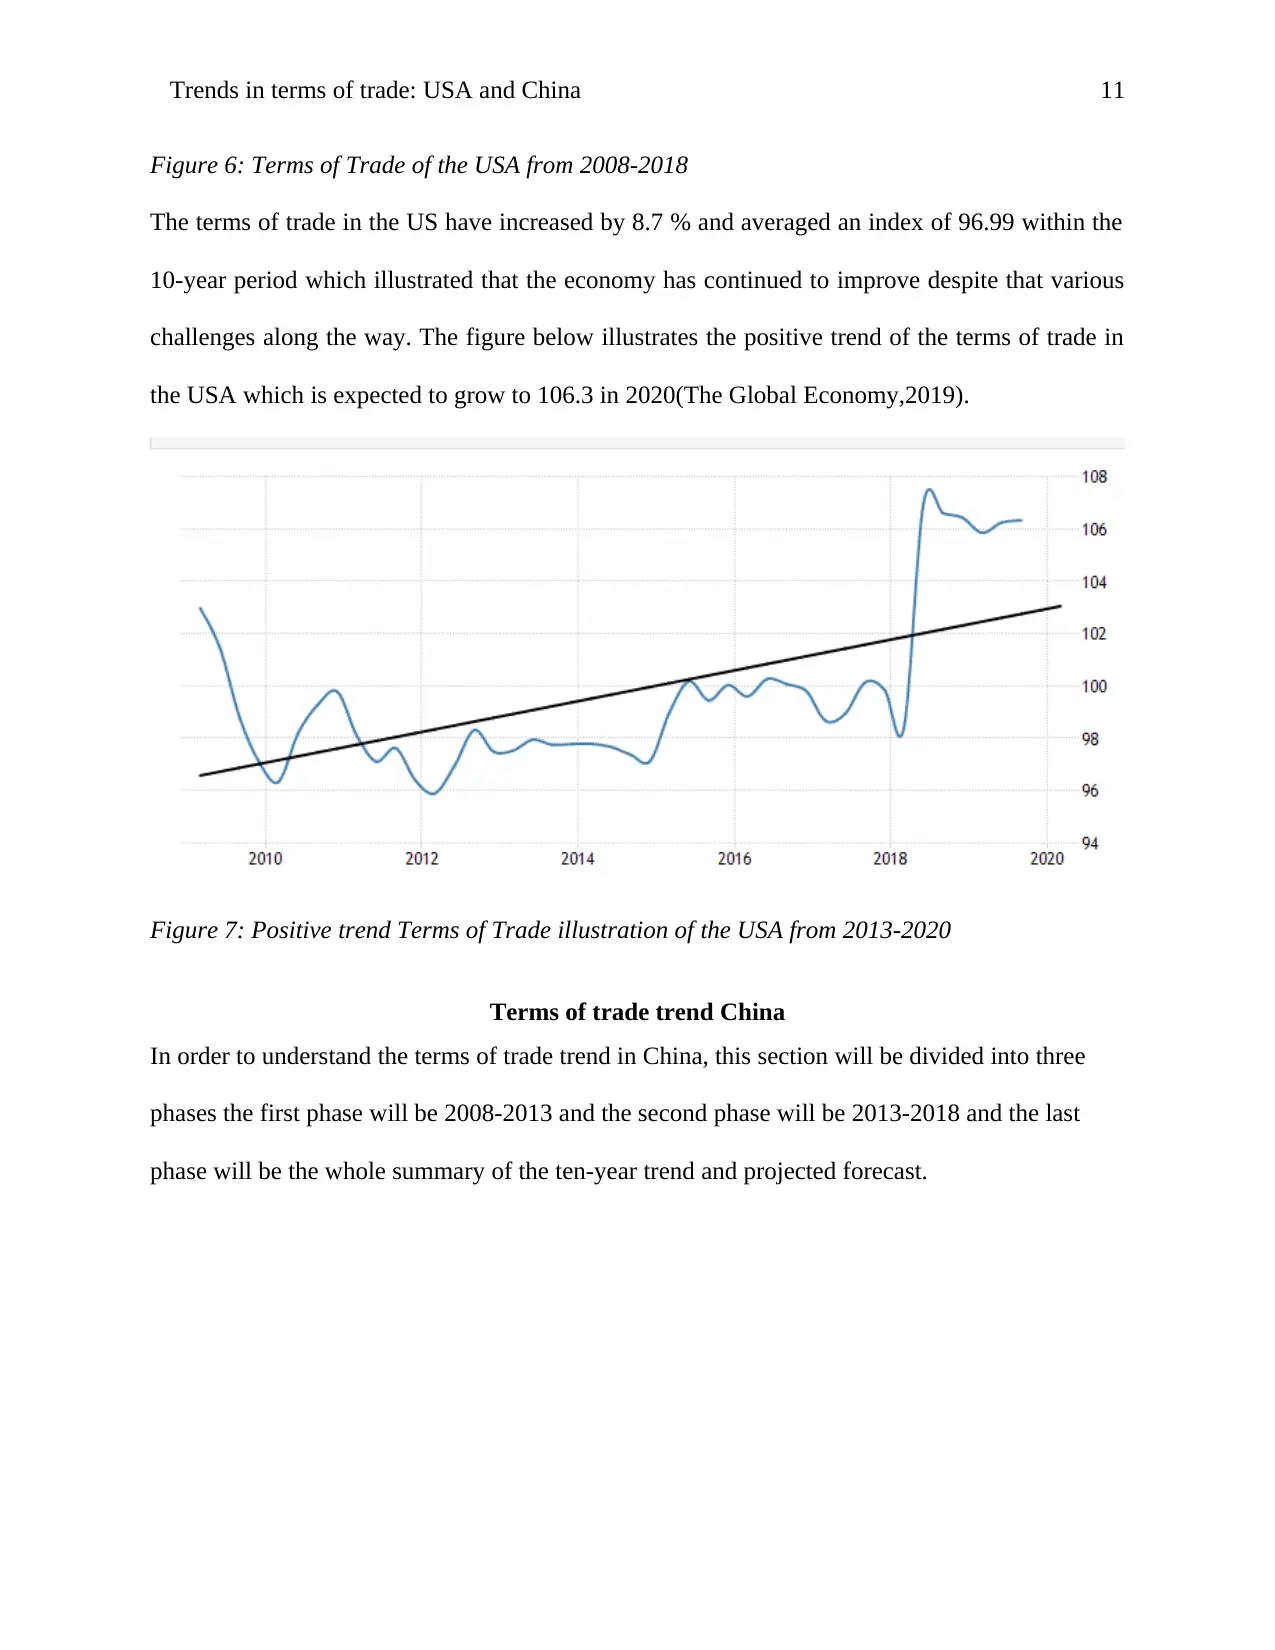
Figure 6: Terms of Trade of the USA from 2008-2018
The terms of trade in the US have increased by 8.7 % and averaged an index of 96.99 within the
10-year period which illustrated that the economy has continued to improve despite that various
challenges along the way. The figure below illustrates the positive trend of the terms of trade in
the USA which is expected to grow to 106.3 in 2020(The Global Economy,2019).
Figure 7: Positive trend Terms of Trade illustration of the USA from 2013-2020
Terms of trade trend China
In order to understand the terms of trade trend in China, this section will be divided into three
phases the first phase will be 2008-2013 and the second phase will be 2013-2018 and the last
phase will be the whole summary of the ten-year trend and projected forecast.
Trends in terms of trade: USA and China 12
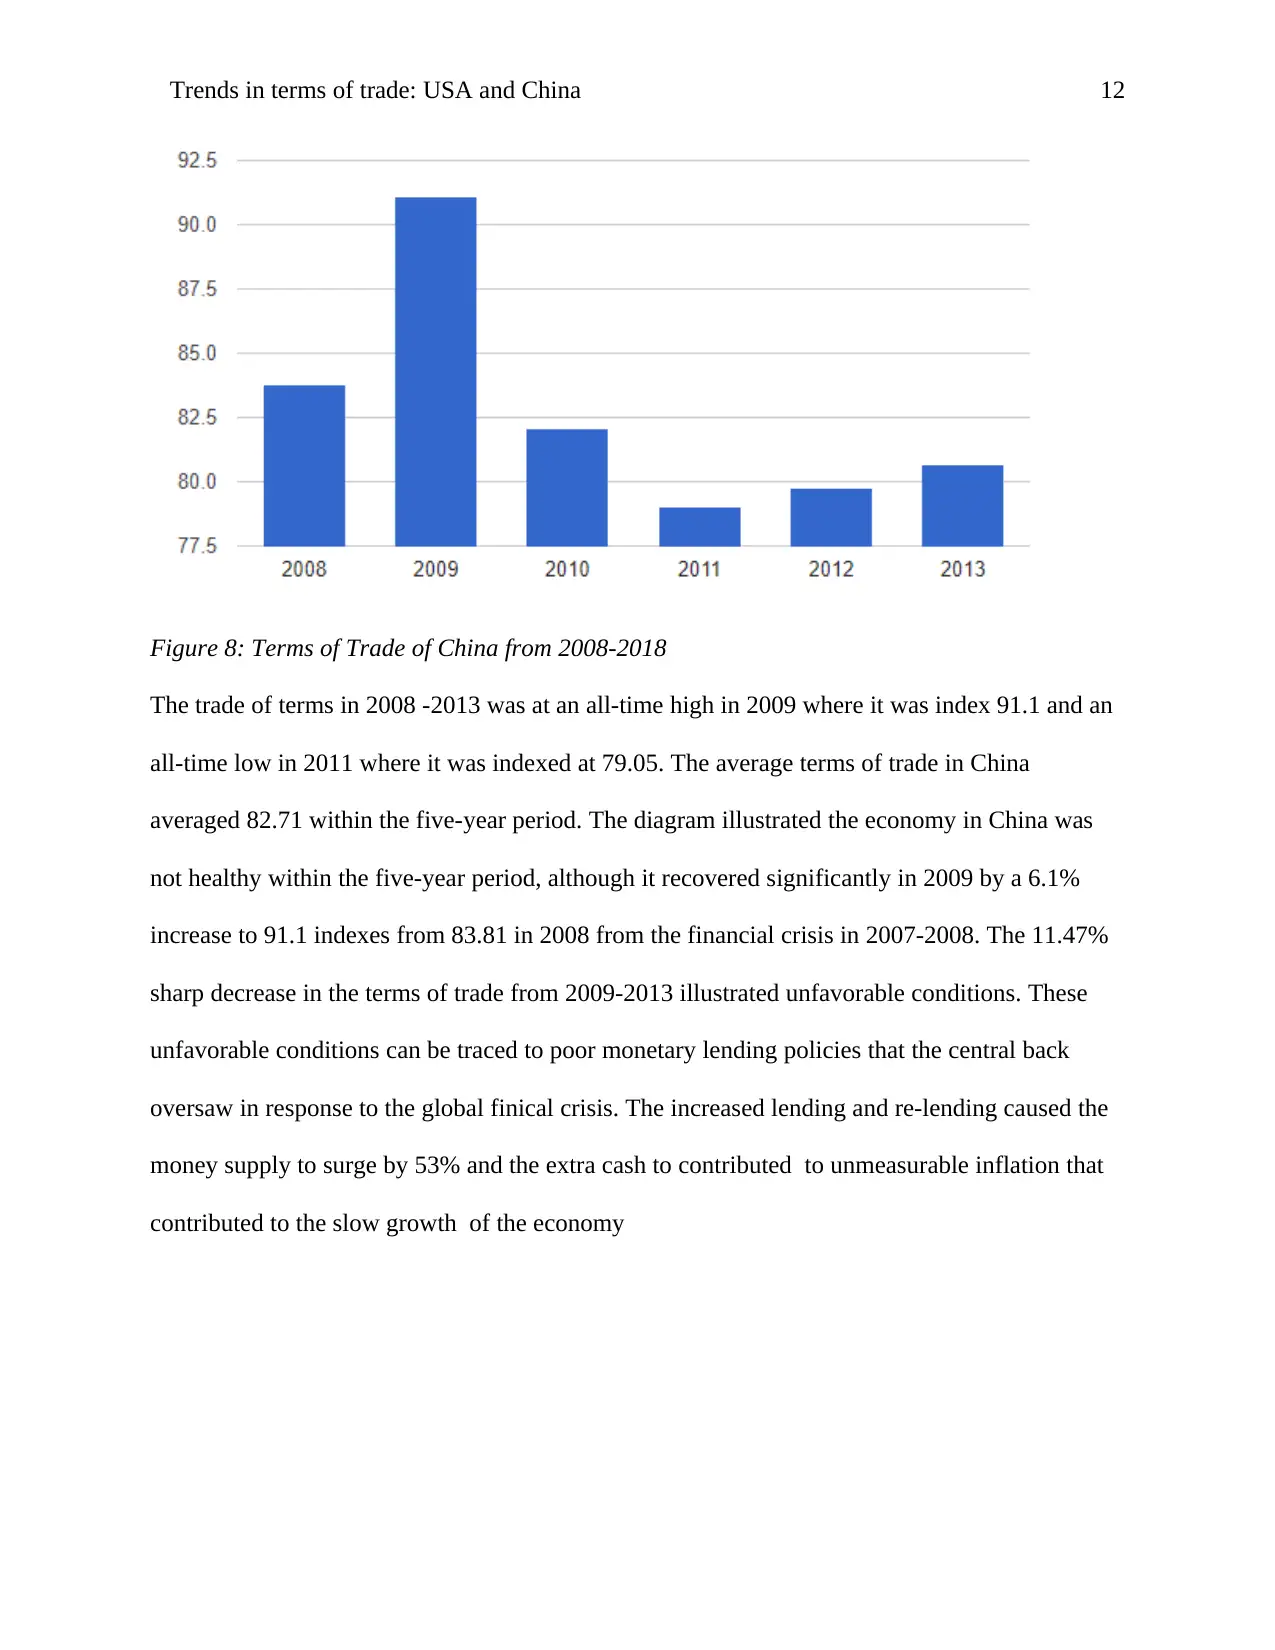
Figure 8: Terms of Trade of China from 2008-2018
The trade of terms in 2008 -2013 was at an all-time high in 2009 where it was index 91.1 and an
all-time low in 2011 where it was indexed at 79.05. The average terms of trade in China
averaged 82.71 within the five-year period. The diagram illustrated the economy in China was
not healthy within the five-year period, although it recovered significantly in 2009 by a 6.1%
increase to 91.1 indexes from 83.81 in 2008 from the financial crisis in 2007-2008. The 11.47%
sharp decrease in the terms of trade from 2009-2013 illustrated unfavorable conditions. These
unfavorable conditions can be traced to poor monetary lending policies that the central back
oversaw in response to the global finical crisis. The increased lending and re-lending caused the
money supply to surge by 53% and the extra cash to contributed to unmeasurable inflation that
contributed to the slow growth of the economy
⊘ This is a preview!⊘
Do you want full access?
Subscribe today to unlock all pages.
Trusted by 1+ million students worldwide
1 out of 21
Related Documents


Your All-in-One AI-Powered Toolkit for Academic Success.
+13062052269
info@desklib.com
Available 24*7 on WhatsApp / Email
![[object Object]](/_next/static/media/star-bottom.7253800d.svg)
Unlock your academic potential
Copyright © 2020–2026 A2Z Services. All Rights Reserved. Developed and managed by ZUCOL.