AF4S31 Financial Analysis Report: Tesco and Benedict Company
VerifiedAdded on 2022/10/19
|16
|4079
|236
Report
AI Summary
This report presents a comprehensive financial analysis of Tesco and Benedict, examining their financial performance through various lenses. The report begins with an introduction that underscores the significance of financial analysis for organizations and their stakeholders. It then delves into a stakeholder analysis of Tesco, identifying and assessing the interests of directors, suppliers/creditors, and employees. The report continues with a detailed ratio analysis of Benedict Company, evaluating liquidity, profitability, solvency, and efficiency ratios for the years 2000 and 2001. The analysis includes the current ratio, quick ratio, gross profit, return on assets, net profit, return on equity, debt-to-equity ratio, and inventory, creditor, and debtor ratios. The report highlights areas of concern, such as declining ratios, and provides recommendations for improvement. Ultimately, this report offers valuable insights into the financial health and performance of the two companies, providing a basis for informed decision-making by stakeholders.
Running Head: Financial analysis 1
TESCO AND BENEDICT
TESCO AND BENEDICT
Paraphrase This Document
Need a fresh take? Get an instant paraphrase of this document with our AI Paraphraser
Financial analysis 2
Table of Contents
Introduction......................................................................................................................................3
Stakeholder Analysis of the Tesco Company..................................................................................3
A).................................................................................................................................................3
B)..................................................................................................................................................5
Ratio Analysis..................................................................................................................................6
Liquidity ratios.................................................................................................................................6
Current ratio.................................................................................................................................6
Quick Ratio..................................................................................................................................8
Profitability ratios............................................................................................................................8
Gross Profit..................................................................................................................................9
Return on Assets........................................................................................................................10
Net Profit....................................................................................................................................10
Return on Equity........................................................................................................................10
Solvency Ratios.............................................................................................................................11
Debt to Equity ratio....................................................................................................................11
Debt ot total assets of the company...........................................................................................11
Efficiency Ratios...........................................................................................................................12
Inventory Ratio..........................................................................................................................13
Creditor’s Ratio..........................................................................................................................13
Debtors Ratio.............................................................................................................................13
Cause of Concern...........................................................................................................................14
Recommendations and Conclusions..............................................................................................14
References......................................................................................................................................15
Financial analysis 3
Introduction
Every organization once in a while conducts a financial analysis in order to get aware about
financial position of the company. As per the current requirements the users of the financial
statements has deep interest in the financial performances so that it becomes helpful in making
the strategic business decisions. The statements of the financial nature are the components for
any organization and partners have a profound enthusiasm to break down how well the
organization is working is the real market scenario in terms of the other competitive companies.
The below report examines about the engagement of the stakeholders in order to have an
understanding of the Tesco organization as well how sustainable the organization is. Besides
this, there is one more section of the report that clearly discusses the role of the Benedict
Company, how it has been embraced so as to keep up the potential clients, shareholders,
creditors so as to evaluate whether the decision to make the investment is correct or not
(Martínez‐Ferrero, Garcia‐Sanchez and Cuadrado‐Ballesteros, 2015).
Stakeholder Analysis of the Tesco Company
A)
The term stakeholder in the corporation is one that can be examined as the team without whose
assistance; the firm would cease to exist. The usage of the word stakeholder happens to be in the
year 1963 at Stanford research Institute. At times the stakeholders can also have the 50% interest
in the products or the services which has been provided by the organization. While talking about
the internal stakeholders, the list is made up of the management, employees, administrators,
external stakeholder and the suppliers. In this section a detailed analysis of the Tesco Company
⊘ This is a preview!⊘
Do you want full access?
Subscribe today to unlock all pages.
Trusted by 1+ million students worldwide
Financial analysis 4
and its stakeholders has been carried out to understand their needs and the preferences. The three
types of the stakeholders that have been analyzed below are the directors, suppliers, and the
management or say employees of the organization (Asay, Elliott and Rennekamp, 2016).
Directors: As per the stakeholders the directors possess the direct interest in the company and its
affair as they have taken a huge risk by investing in the business. From the analysis it can be
understood that the directors the key people in deciding most of the decisions of Tesco and
hence, their interest becomes imperative automatically. Further the directors also furnish a report
wherein all the necessary and the substantial information is given which ultimately is provided to
the shareholders and hence in this manner the directors become a relevant stakeholder (Tse, et al
2016).
Suppliers/ Creditors: the fundamental strategy of the Tesco is to treat the individuals the
manner in which they need to treat themselves, and it's something they apply solidly to give the
relationship another touch among the suppliers and the creditors of the organization. As per the
annual report it can be observed that the suppliers are considered on the second number while
analyzing the stakeholder theory of Tesco as they are the major element, which Tesco must
satisfy to. Further, the suppliers can take the strategic business decision only they will be fully
aware about the financial health; events and the important decision are taking place in the
business. The suppliers supply the material at the commercial level as well as to different
branches of it (Jenkins and Williamson, 2015).
Employees: Employees are the key members of the organization and it is very important to
understand their needs and preferences. The managers have the core responsibility of creating the
goals, atmosphere of the work among the workers of Tesco. There are different fields which a
Paraphrase This Document
Need a fresh take? Get an instant paraphrase of this document with our AI Paraphraser
Financial analysis 5
manger has to handle such as law, finance, marketing, sales and production and without them it
becomes impossible for the company to grow and sustain. Hence under the concept of the
stakeholders the next best stakeholder is employee (Sadler and Evans, 2016).
B)
Corporate Social Responsibility' is viewed as the future of all associations explicitly as well as
implicitly. Furthermore, the organizations must be increasingly dynamic on the classification of
'CSR' exercises and on how the steady usage in the retail association and in their dispersion
channels could be availed (Tesco, 2016). As per the Tesco's Environmental and Social Review
and the Corporate Governance Report, it is evident with regards to contribution being made and
it also defines the performance of the stakeholders on the grounds of responsibility. The two
stakeholders that have been analyzed in the detailed manner are the suppliers and the employees.
With the creditors and suppliers the general methodology of the organization is, it has
consistently been encouraging to utilize the dibble crop which is comprehensive of various
frames and figures. Besides this year the new yields have been presented and the new facility to
grow the crops is also available. This also helped in easing down the business to an extremely
high level by allowing the opportunity or say flexibility to order online (Karim, Suh, Carter and
Zhang, 2015).
Ratio Analysis
The ratios are the key determinants and they acts as a driver or a tool that can be used to analyze
the health of the companies in terms of the competitor or even against the industry benchmark.
The ratio investigation helps in making mindful decisions about the changes observed in the
organization. It basically satisfies the request of the users of the financial statements as they are
Financial analysis 6
keen to know the happenings of the company and moreover they are also helpful in deciding
whether to carry on the business terms with the organization or not. In this section the ratios of
the Benedict Company has been evaluated for the year 2000 and the year 2001. This will give an
insight to the changes that have taken place over the period of the last two years and the
necessary adjustments as well as strategies are also discussed to improve the position. The ratios
are generally assessed on the basis of the profitability, liquidity, efficiency, and solvency
(Williams and Dobelman, 2017).
Liquidity ratios
The primary proportion that will be chosen by the organization is in terms of the liquidity, which
is utilized to gauge the financial situation of the business as far as how fluid the organization can
move in order to meet its present commitments and the liabilities of the current nature. This is
also to check whether the organization will have adequate amount to compensation back the
present liabilities proficiently and viably. The liquidity proportions are additionally distributed
into the current ratio and the quick ratios (Robinson, et al 2015).
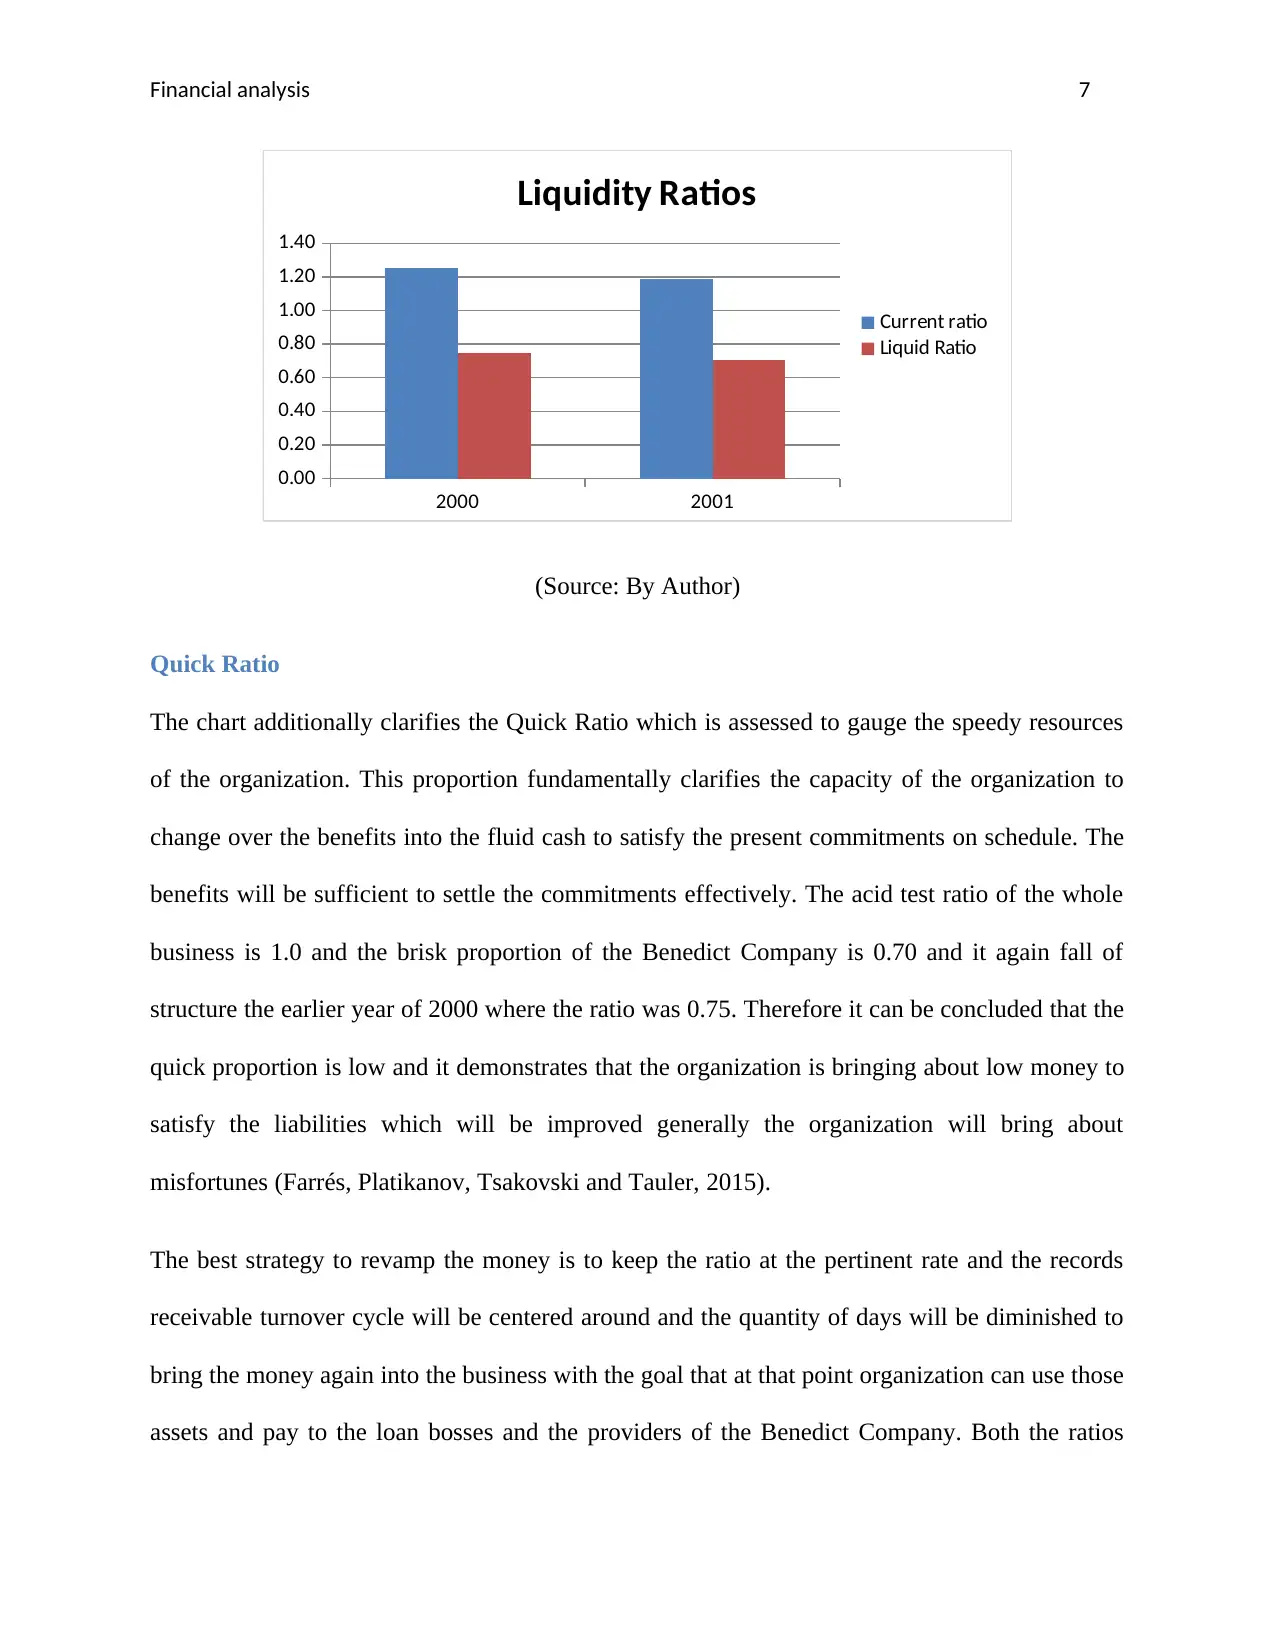
Current ratio
Current Ratio is the proportion which is determined to discover the capacity of the organization
to compensation its present liabilities on the basis of the existing resources. The present current
ratio of the company is 1.19 and it decreased in comparison to the previous year of 2000. When
the position is realized in terms of the industry benchmark it can be seen that the ratio is 1.60.
The company is nowhere close to this ratio whereas it declined in terms of the previous year.
This indicates that the company needs to buck up to settle the liabilities as soon as possible by
making use of the assets in the most judicious manner (Wen and Zhu, 2019).
keen to know the happenings of the company and moreover they are also helpful in deciding
whether to carry on the business terms with the organization or not. In this section the ratios of
the Benedict Company has been evaluated for the year 2000 and the year 2001. This will give an
insight to the changes that have taken place over the period of the last two years and the
necessary adjustments as well as strategies are also discussed to improve the position. The ratios
are generally assessed on the basis of the profitability, liquidity, efficiency, and solvency
(Williams and Dobelman, 2017).
Liquidity ratios
The primary proportion that will be chosen by the organization is in terms of the liquidity, which
is utilized to gauge the financial situation of the business as far as how fluid the organization can
move in order to meet its present commitments and the liabilities of the current nature. This is
also to check whether the organization will have adequate amount to compensation back the
present liabilities proficiently and viably. The liquidity proportions are additionally distributed
into the current ratio and the quick ratios (Robinson, et al 2015).
Current ratio
Current Ratio is the proportion which is determined to discover the capacity of the organization
to compensation its present liabilities on the basis of the existing resources. The present current
ratio of the company is 1.19 and it decreased in comparison to the previous year of 2000. When
the position is realized in terms of the industry benchmark it can be seen that the ratio is 1.60.
The company is nowhere close to this ratio whereas it declined in terms of the previous year.
This indicates that the company needs to buck up to settle the liabilities as soon as possible by
making use of the assets in the most judicious manner (Wen and Zhu, 2019).
⊘ This is a preview!⊘
Do you want full access?
Subscribe today to unlock all pages.
Trusted by 1+ million students worldwide
Financial analysis 7
2000 2001
0.00
0.20
0.40
0.60
0.80
1.00
1.20
1.40
Liquidity Ratios
Current ratio
Liquid Ratio
(Source: By Author)
Quick Ratio
The chart additionally clarifies the Quick Ratio which is assessed to gauge the speedy resources
of the organization. This proportion fundamentally clarifies the capacity of the organization to
change over the benefits into the fluid cash to satisfy the present commitments on schedule. The
benefits will be sufficient to settle the commitments effectively. The acid test ratio of the whole
business is 1.0 and the brisk proportion of the Benedict Company is 0.70 and it again fall of
structure the earlier year of 2000 where the ratio was 0.75. Therefore it can be concluded that the
quick proportion is low and it demonstrates that the organization is bringing about low money to
satisfy the liabilities which will be improved generally the organization will bring about
misfortunes (Farrés, Platikanov, Tsakovski and Tauler, 2015).
The best strategy to revamp the money is to keep the ratio at the pertinent rate and the records
receivable turnover cycle will be centered around and the quantity of days will be diminished to
bring the money again into the business with the goal that at that point organization can use those
assets and pay to the loan bosses and the providers of the Benedict Company. Both the ratios
Paraphrase This Document
Need a fresh take? Get an instant paraphrase of this document with our AI Paraphraser
Financial analysis 8
hold equal importance and are required to be attended on the emergency basis to save the future
performance of the business (Kajananthan and Velnampy, 2018).
Profitability ratios
The ratios of the profitability of the organization are the ones that are determined to decide if the
organization is working productively or not. The profits are additionally significant structure the
perspective of the speculators and the investors as the greater part of the income are the key
drivers for the investors. The productivity is the most significant factor regarding the entomb
also intra organization examination with the goal that it gives the plan to the administration about
whether the organization will improve the presentation of the organization, or whether it is
working great or not or experiencing misfortunes that should be recouped. There are four
parameters on the basis of which the profitability is measured such as gross profit, net profit,
return on equity and the return on assets .
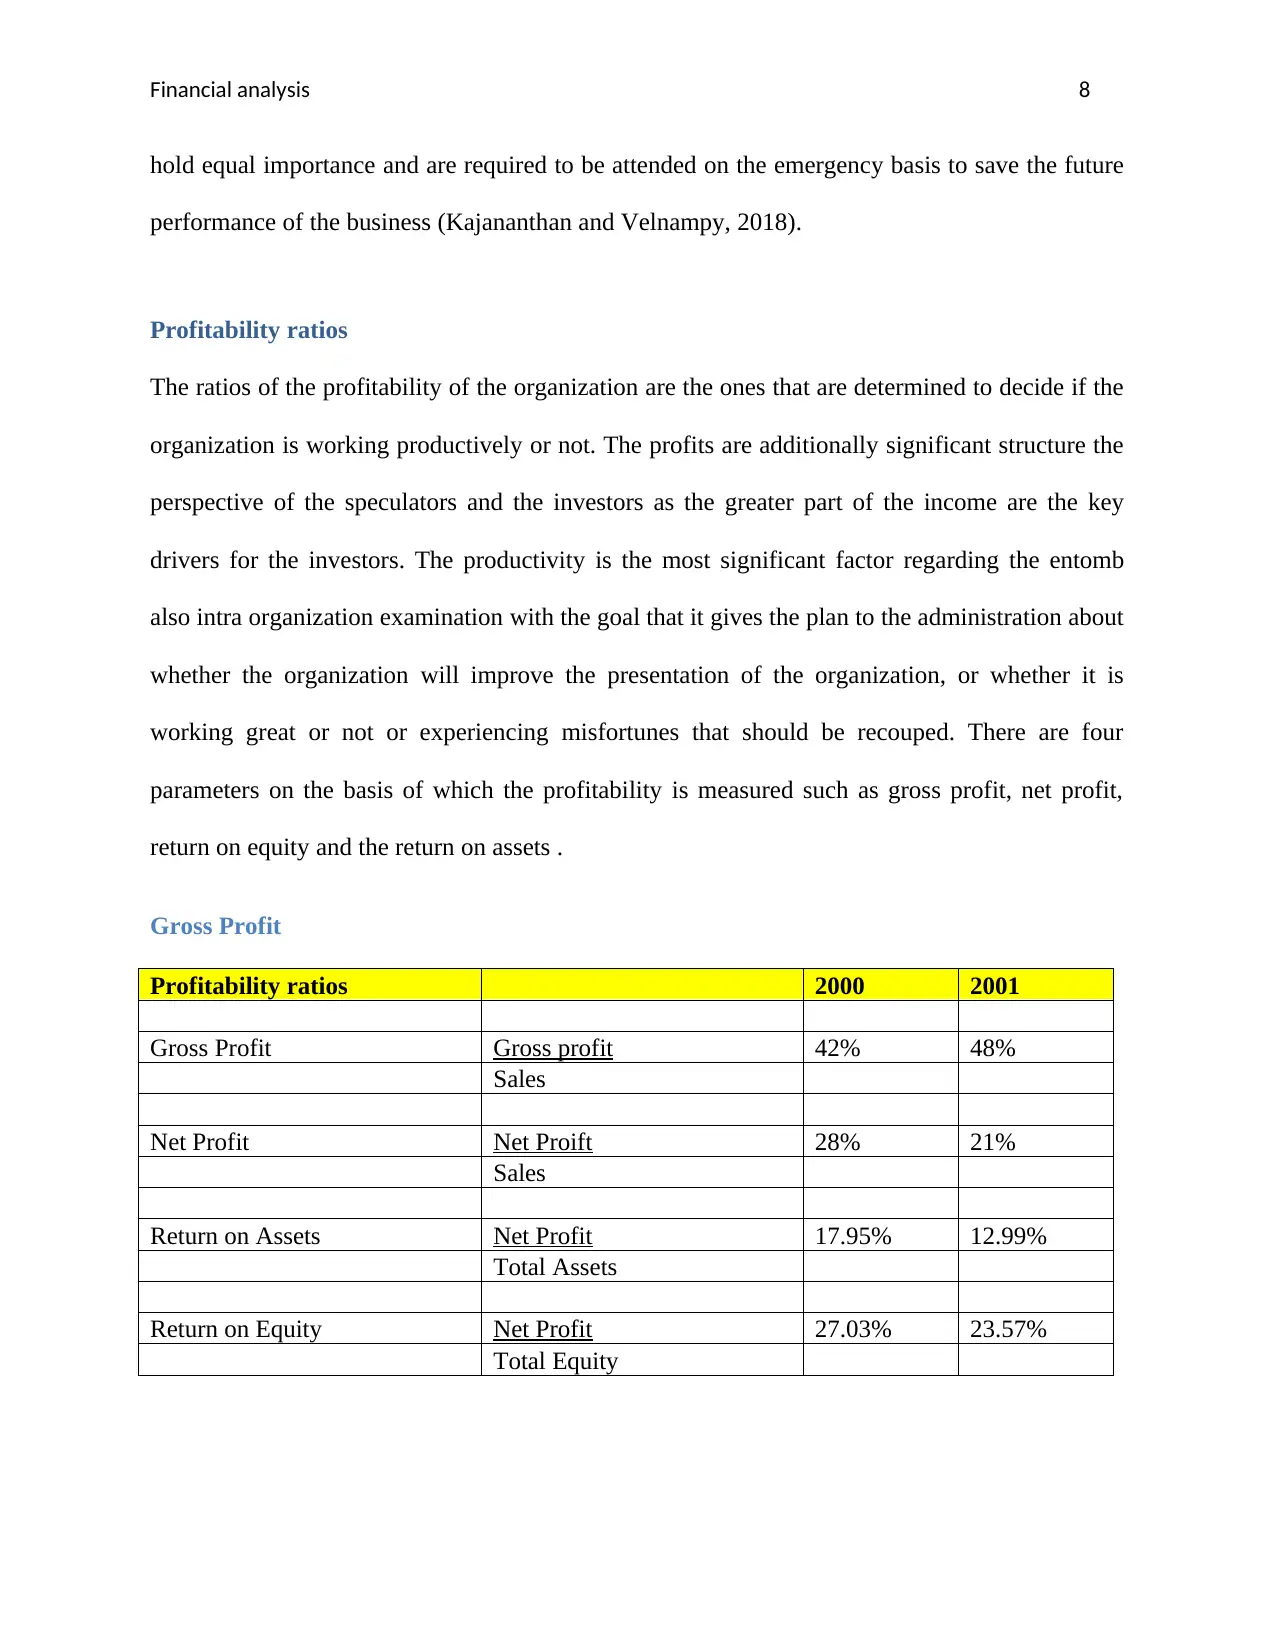
Gross Profit
Profitability ratios 2000 2001
Gross Profit Gross profit 42% 48%
Sales
Net Profit Net Proift 28% 21%
Sales
Return on Assets Net Profit 17.95% 12.99%
Total Assets
Return on Equity Net Profit 27.03% 23.57%
Total Equity
hold equal importance and are required to be attended on the emergency basis to save the future
performance of the business (Kajananthan and Velnampy, 2018).
Profitability ratios
The ratios of the profitability of the organization are the ones that are determined to decide if the
organization is working productively or not. The profits are additionally significant structure the
perspective of the speculators and the investors as the greater part of the income are the key
drivers for the investors. The productivity is the most significant factor regarding the entomb
also intra organization examination with the goal that it gives the plan to the administration about
whether the organization will improve the presentation of the organization, or whether it is
working great or not or experiencing misfortunes that should be recouped. There are four
parameters on the basis of which the profitability is measured such as gross profit, net profit,
return on equity and the return on assets .
Gross Profit
Profitability ratios 2000 2001
Gross Profit Gross profit 42% 48%
Sales
Net Profit Net Proift 28% 21%
Sales
Return on Assets Net Profit 17.95% 12.99%
Total Assets
Return on Equity Net Profit 27.03% 23.57%
Total Equity
Financial analysis 9
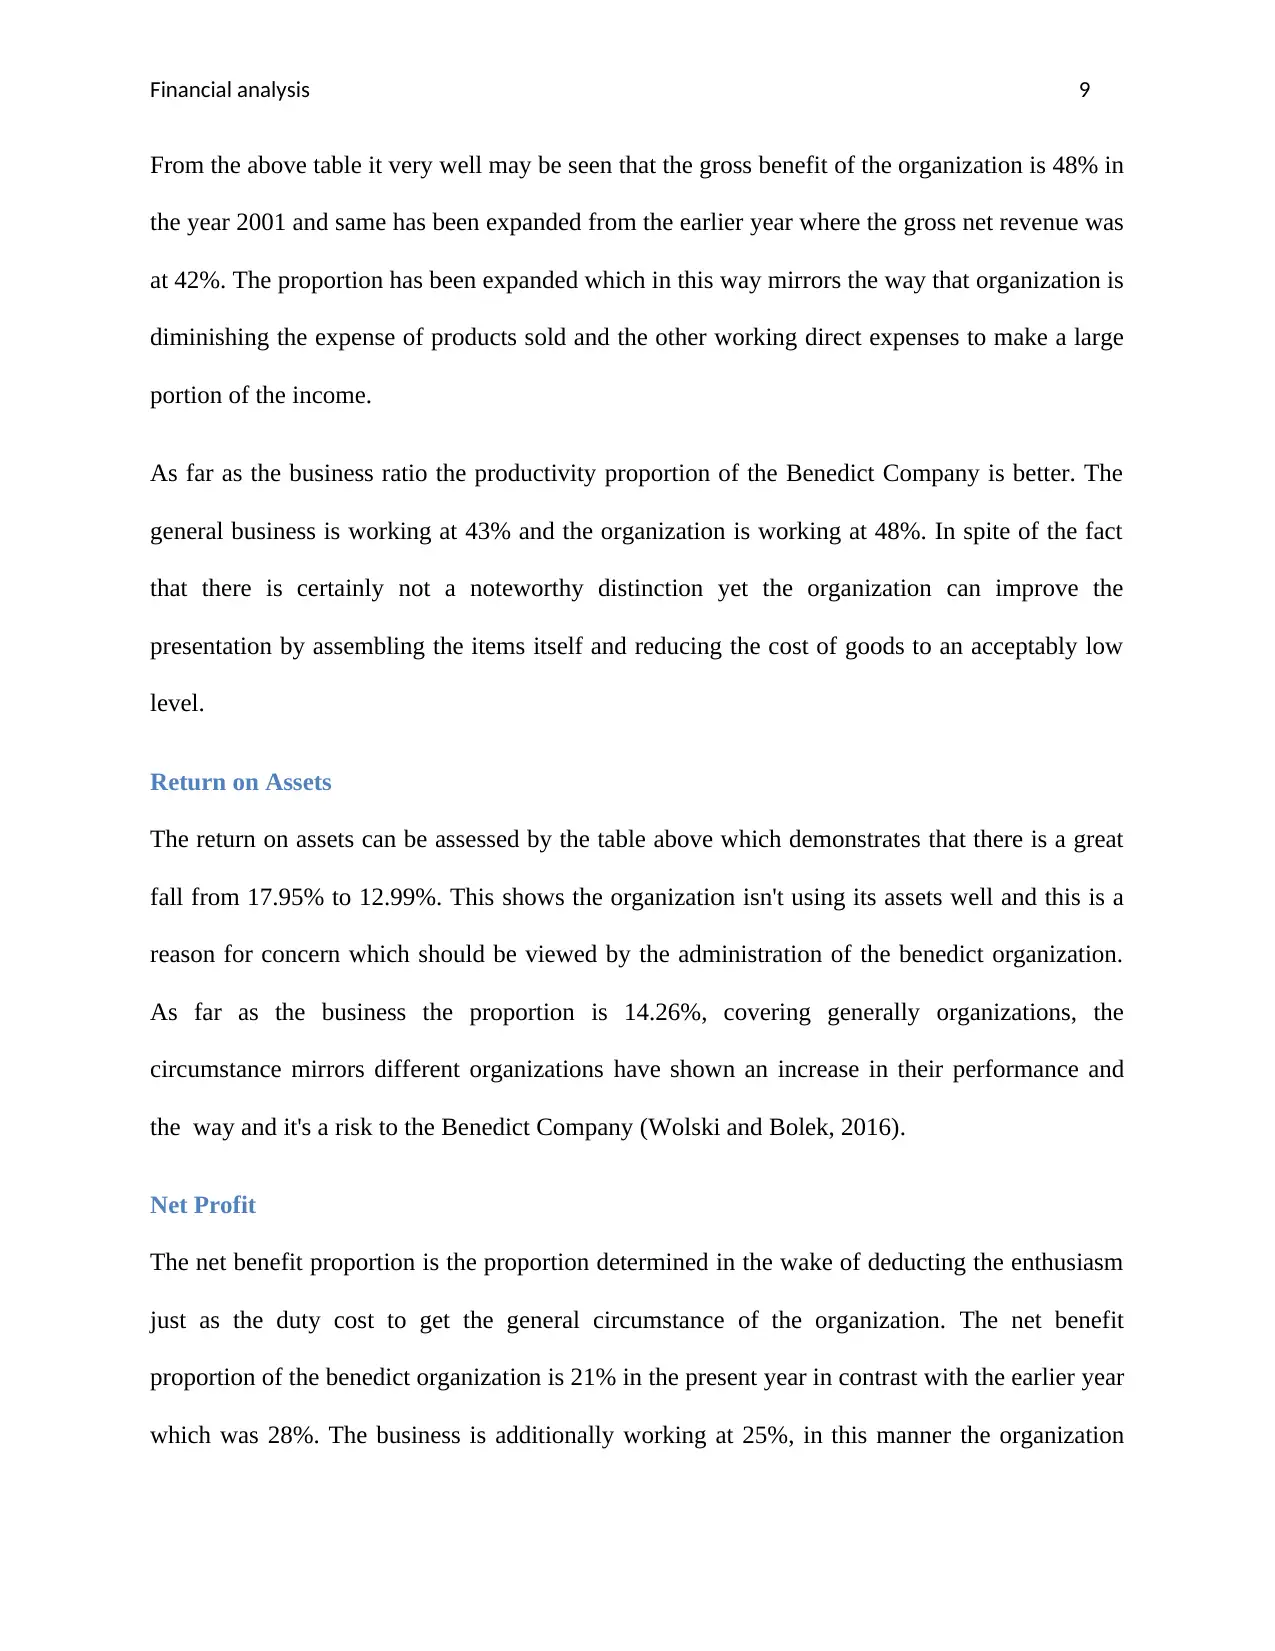
From the above table it very well may be seen that the gross benefit of the organization is 48% in
the year 2001 and same has been expanded from the earlier year where the gross net revenue was
at 42%. The proportion has been expanded which in this way mirrors the way that organization is
diminishing the expense of products sold and the other working direct expenses to make a large
portion of the income.
As far as the business ratio the productivity proportion of the Benedict Company is better. The
general business is working at 43% and the organization is working at 48%. In spite of the fact
that there is certainly not a noteworthy distinction yet the organization can improve the
presentation by assembling the items itself and reducing the cost of goods to an acceptably low
level.
Return on Assets
The return on assets can be assessed by the table above which demonstrates that there is a great
fall from 17.95% to 12.99%. This shows the organization isn't using its assets well and this is a
reason for concern which should be viewed by the administration of the benedict organization.
As far as the business the proportion is 14.26%, covering generally organizations, the
circumstance mirrors different organizations have shown an increase in their performance and
the way and it's a risk to the Benedict Company (Wolski and Bolek, 2016).
Net Profit
The net benefit proportion is the proportion determined in the wake of deducting the enthusiasm
just as the duty cost to get the general circumstance of the organization. The net benefit
proportion of the benedict organization is 21% in the present year in contrast with the earlier year
which was 28%. The business is additionally working at 25%, in this manner the organization
⊘ This is a preview!⊘
Do you want full access?
Subscribe today to unlock all pages.
Trusted by 1+ million students worldwide
Financial analysis 10
can build the net benefit proportion as there isn't much hole between the earlier year execution
and the business hole.
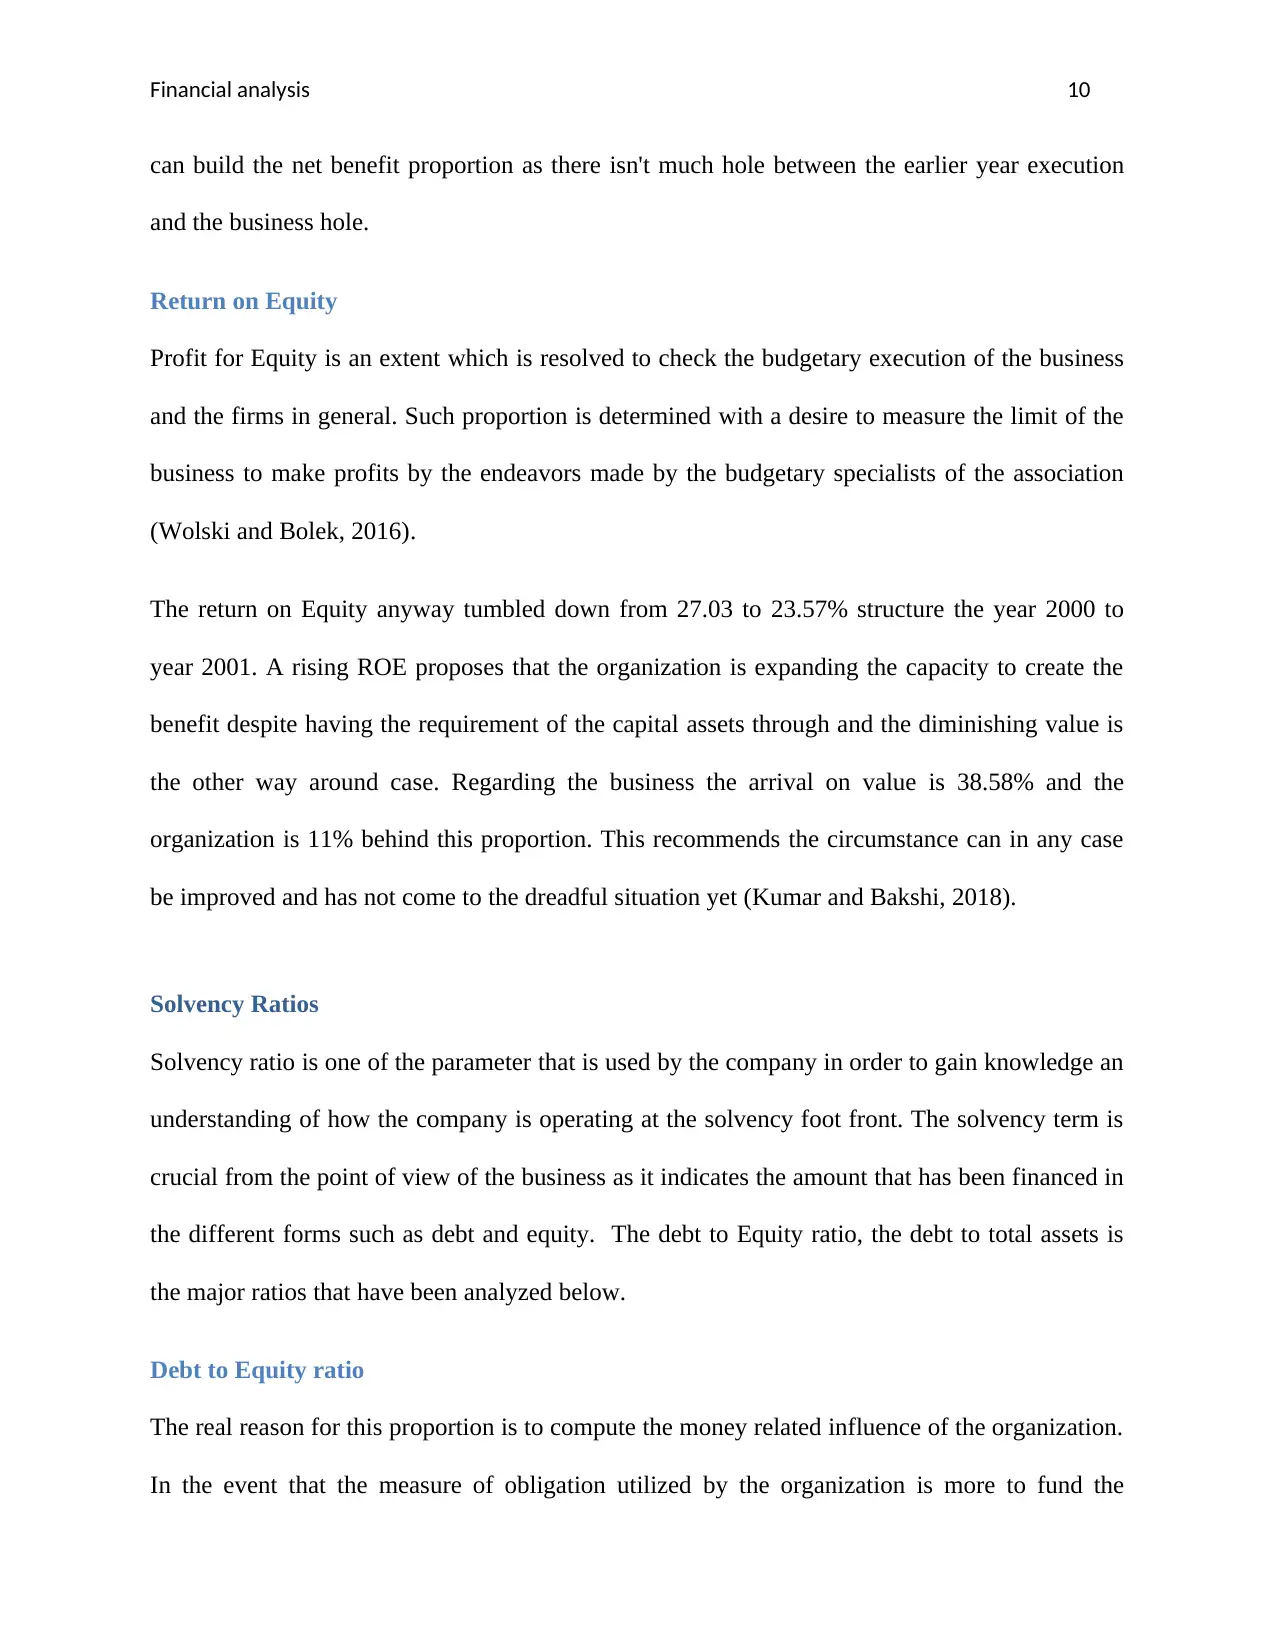
Return on Equity
Profit for Equity is an extent which is resolved to check the budgetary execution of the business
and the firms in general. Such proportion is determined with a desire to measure the limit of the
business to make profits by the endeavors made by the budgetary specialists of the association
(Wolski and Bolek, 2016).
The return on Equity anyway tumbled down from 27.03 to 23.57% structure the year 2000 to
year 2001. A rising ROE proposes that the organization is expanding the capacity to create the
benefit despite having the requirement of the capital assets through and the diminishing value is
the other way around case. Regarding the business the arrival on value is 38.58% and the
organization is 11% behind this proportion. This recommends the circumstance can in any case
be improved and has not come to the dreadful situation yet (Kumar and Bakshi, 2018).
Solvency Ratios
Solvency ratio is one of the parameter that is used by the company in order to gain knowledge an
understanding of how the company is operating at the solvency foot front. The solvency term is
crucial from the point of view of the business as it indicates the amount that has been financed in
the different forms such as debt and equity. The debt to Equity ratio, the debt to total assets is
the major ratios that have been analyzed below.
Debt to Equity ratio
The real reason for this proportion is to compute the money related influence of the organization.
In the event that the measure of obligation utilized by the organization is more to fund the
can build the net benefit proportion as there isn't much hole between the earlier year execution
and the business hole.
Return on Equity
Profit for Equity is an extent which is resolved to check the budgetary execution of the business
and the firms in general. Such proportion is determined with a desire to measure the limit of the
business to make profits by the endeavors made by the budgetary specialists of the association
(Wolski and Bolek, 2016).
The return on Equity anyway tumbled down from 27.03 to 23.57% structure the year 2000 to
year 2001. A rising ROE proposes that the organization is expanding the capacity to create the
benefit despite having the requirement of the capital assets through and the diminishing value is
the other way around case. Regarding the business the arrival on value is 38.58% and the
organization is 11% behind this proportion. This recommends the circumstance can in any case
be improved and has not come to the dreadful situation yet (Kumar and Bakshi, 2018).
Solvency Ratios
Solvency ratio is one of the parameter that is used by the company in order to gain knowledge an
understanding of how the company is operating at the solvency foot front. The solvency term is
crucial from the point of view of the business as it indicates the amount that has been financed in
the different forms such as debt and equity. The debt to Equity ratio, the debt to total assets is
the major ratios that have been analyzed below.
Debt to Equity ratio
The real reason for this proportion is to compute the money related influence of the organization.
In the event that the measure of obligation utilized by the organization is more to fund the
Paraphrase This Document
Need a fresh take? Get an instant paraphrase of this document with our AI Paraphraser
Financial analysis 11
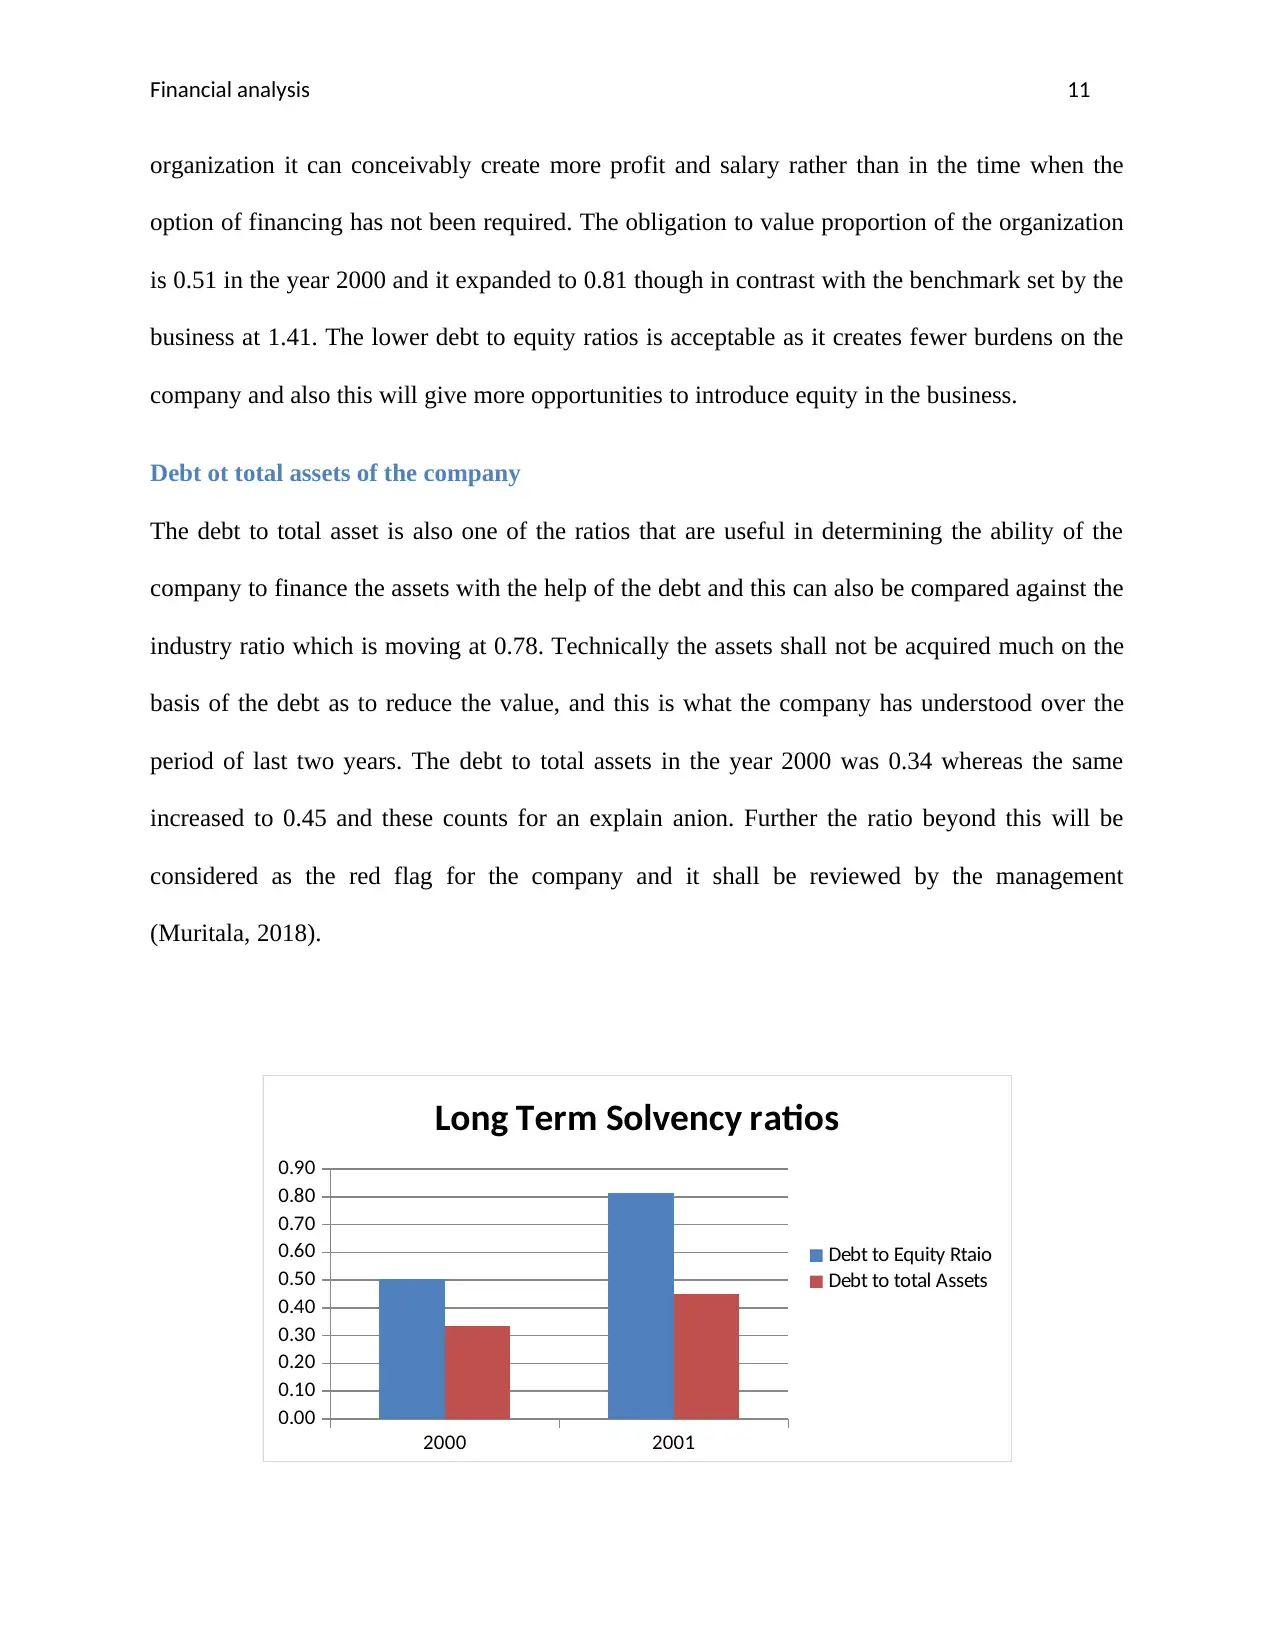
organization it can conceivably create more profit and salary rather than in the time when the
option of financing has not been required. The obligation to value proportion of the organization
is 0.51 in the year 2000 and it expanded to 0.81 though in contrast with the benchmark set by the
business at 1.41. The lower debt to equity ratios is acceptable as it creates fewer burdens on the
company and also this will give more opportunities to introduce equity in the business.
Debt ot total assets of the company
The debt to total asset is also one of the ratios that are useful in determining the ability of the
company to finance the assets with the help of the debt and this can also be compared against the
industry ratio which is moving at 0.78. Technically the assets shall not be acquired much on the
basis of the debt as to reduce the value, and this is what the company has understood over the
period of last two years. The debt to total assets in the year 2000 was 0.34 whereas the same
increased to 0.45 and these counts for an explain anion. Further the ratio beyond this will be
considered as the red flag for the company and it shall be reviewed by the management
(Muritala, 2018).
2000 2001
0.00
0.10
0.20
0.30
0.40
0.50
0.60
0.70
0.80
0.90
Long Term Solvency ratios
Debt to Equity Rtaio
Debt to total Assets
Financial analysis 12
(Source: By Author)
Efficiency Ratios
These are the proportions which help in discovering the organization's capacity of how well the
company can collect the cash from the debtors and the inventory of the firm. If one has to
measure the efficiency of the business the activity ratios are the most recommended ratios one as
it gives the outlook of the inventory turnover ratio, the accounts receivable as well as the
accounts payables ratios.
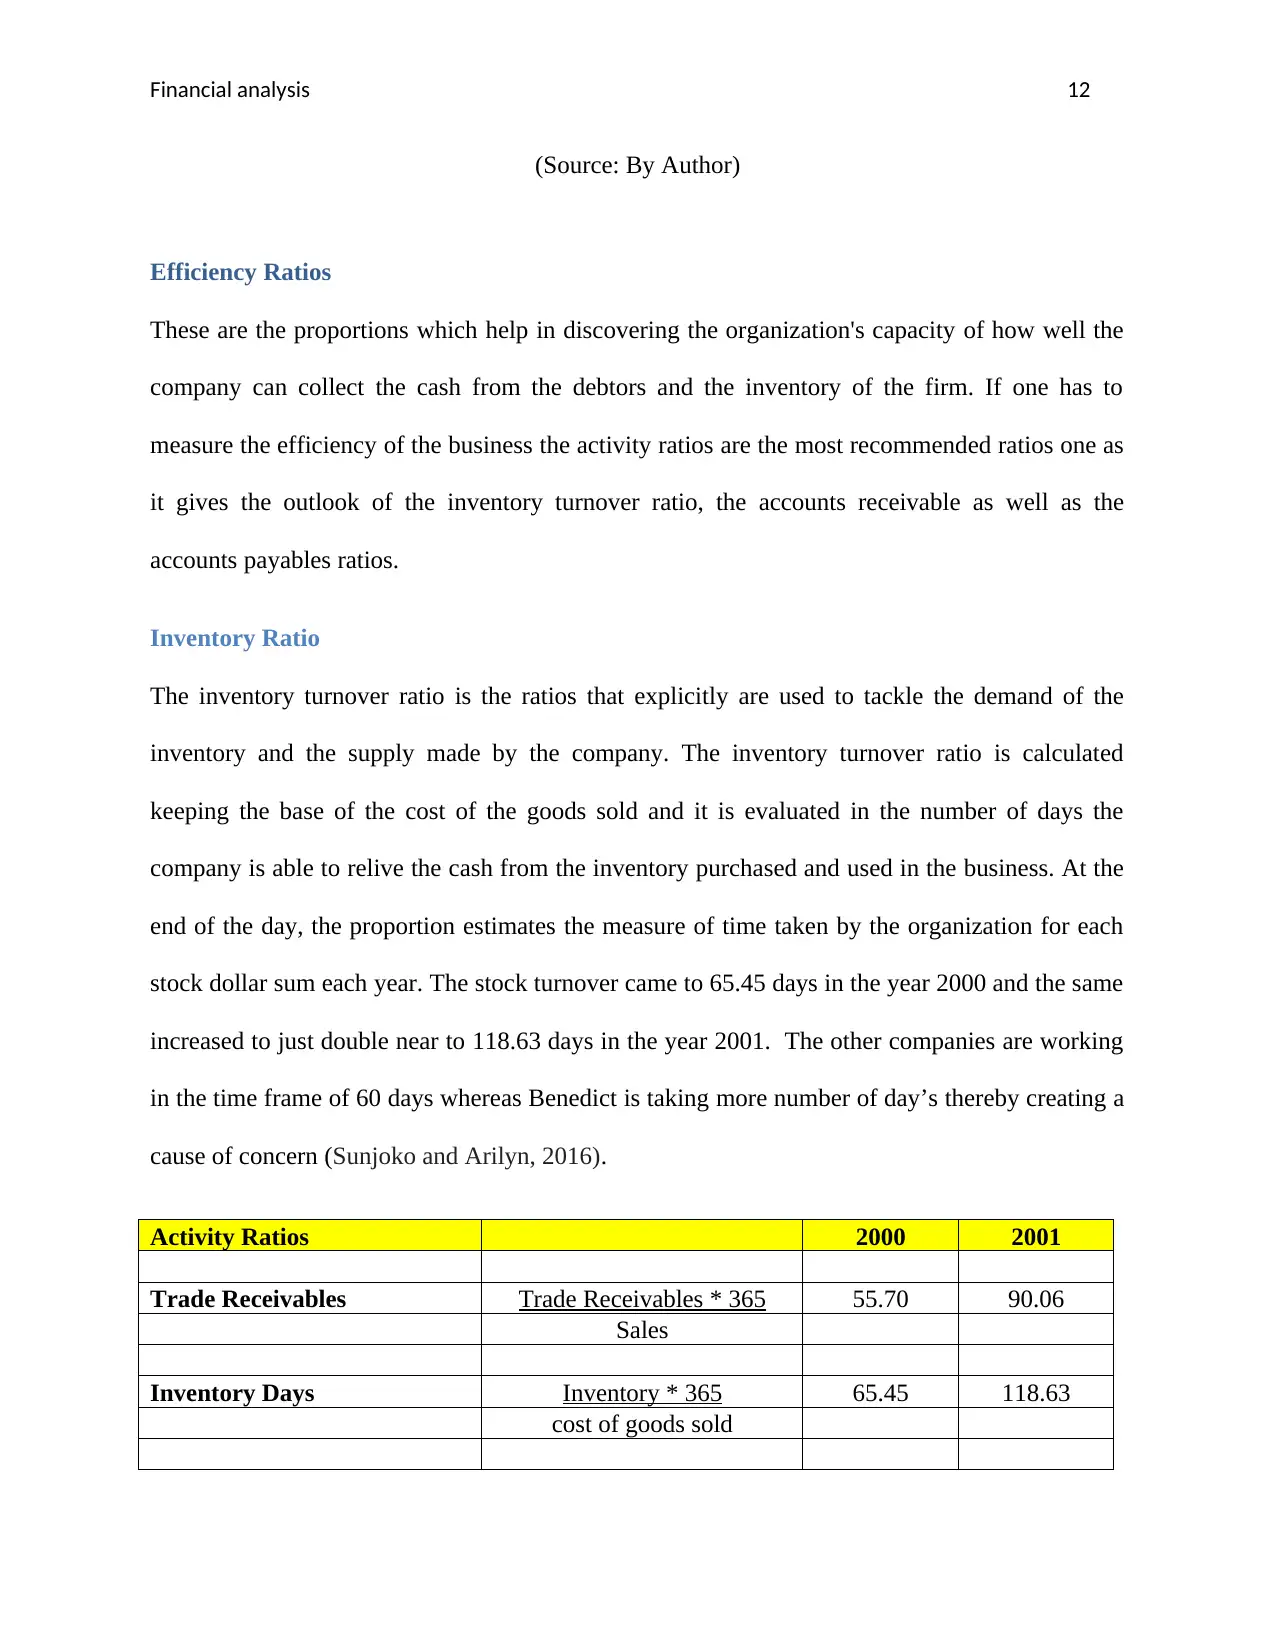
Inventory Ratio
The inventory turnover ratio is the ratios that explicitly are used to tackle the demand of the
inventory and the supply made by the company. The inventory turnover ratio is calculated
keeping the base of the cost of the goods sold and it is evaluated in the number of days the
company is able to relive the cash from the inventory purchased and used in the business. At the
end of the day, the proportion estimates the measure of time taken by the organization for each
stock dollar sum each year. The stock turnover came to 65.45 days in the year 2000 and the same
increased to just double near to 118.63 days in the year 2001. The other companies are working
in the time frame of 60 days whereas Benedict is taking more number of day’s thereby creating a
cause of concern (Sunjoko and Arilyn, 2016).
Activity Ratios 2000 2001
Trade Receivables Trade Receivables * 365 55.70 90.06
Sales
Inventory Days Inventory * 365 65.45 118.63
cost of goods sold
(Source: By Author)
Efficiency Ratios
These are the proportions which help in discovering the organization's capacity of how well the
company can collect the cash from the debtors and the inventory of the firm. If one has to
measure the efficiency of the business the activity ratios are the most recommended ratios one as
it gives the outlook of the inventory turnover ratio, the accounts receivable as well as the
accounts payables ratios.
Inventory Ratio
The inventory turnover ratio is the ratios that explicitly are used to tackle the demand of the
inventory and the supply made by the company. The inventory turnover ratio is calculated
keeping the base of the cost of the goods sold and it is evaluated in the number of days the
company is able to relive the cash from the inventory purchased and used in the business. At the
end of the day, the proportion estimates the measure of time taken by the organization for each
stock dollar sum each year. The stock turnover came to 65.45 days in the year 2000 and the same
increased to just double near to 118.63 days in the year 2001. The other companies are working
in the time frame of 60 days whereas Benedict is taking more number of day’s thereby creating a
cause of concern (Sunjoko and Arilyn, 2016).
Activity Ratios 2000 2001
Trade Receivables Trade Receivables * 365 55.70 90.06
Sales
Inventory Days Inventory * 365 65.45 118.63
cost of goods sold
⊘ This is a preview!⊘
Do you want full access?
Subscribe today to unlock all pages.
Trusted by 1+ million students worldwide
1 out of 16
Related Documents


Your All-in-One AI-Powered Toolkit for Academic Success.
+13062052269
info@desklib.com
Available 24*7 on WhatsApp / Email
![[object Object]](/_next/static/media/star-bottom.7253800d.svg)
Unlock your academic potential
Copyright © 2020–2026 A2Z Services. All Rights Reserved. Developed and managed by ZUCOL.