BM533 - Demand and Supply Analysis: Tesco's Business Economics Model
VerifiedAdded on 2023/06/15
|8
|1947
|117
AI Summary
This coursework provides an analysis of demand and supply within Tesco, a British multinational grocery retailer. It explains the fundamental concepts of the law of demand and the law of supply, using diagrams to illustrate the movement along demand and supply curves. The analysis covers how price changes affect quantity demanded and supplied, considering the concept of ceteris paribus. The coursework also explains the shifts in demand and supply curves due to factors other than price. The study concludes that understanding demand and supply dynamics is critical for Tesco's growth and success. Desklib offers a platform for students to access similar solved assignments and past papers.
Coursework
Paraphrase This Document
Need a fresh take? Get an instant paraphrase of this document with our AI Paraphraser
TABLE OF CONTENTS
INTRODUCTION ..........................................................................................................................3
MAIN BODY...................................................................................................................................3
TASK 1............................................................................................................................................3
Demand Law and Demand Curve Movement.............................................................................3
Demand Law and Demand Curve Movement.............................................................................5
CONCLUSION................................................................................................................................7
REFERENCES................................................................................................................................8
INTRODUCTION
Demand and Supply analysis for a business essential as they have a very important
relation which helps in the determination of the prices and quantities for the most goods and
services which are available in the market. In this project the chosen organization for the
analysation of demand and supply are considered to be Tesco. Tesco is British Multinational
groceries retailer which deals with different types of products and commodities. The law of
demand and supply will be explained with the help of diagram for showing the movement along
their curves.
MAIN BODY
TASK 1
Demand Law and Demand Curve Movement
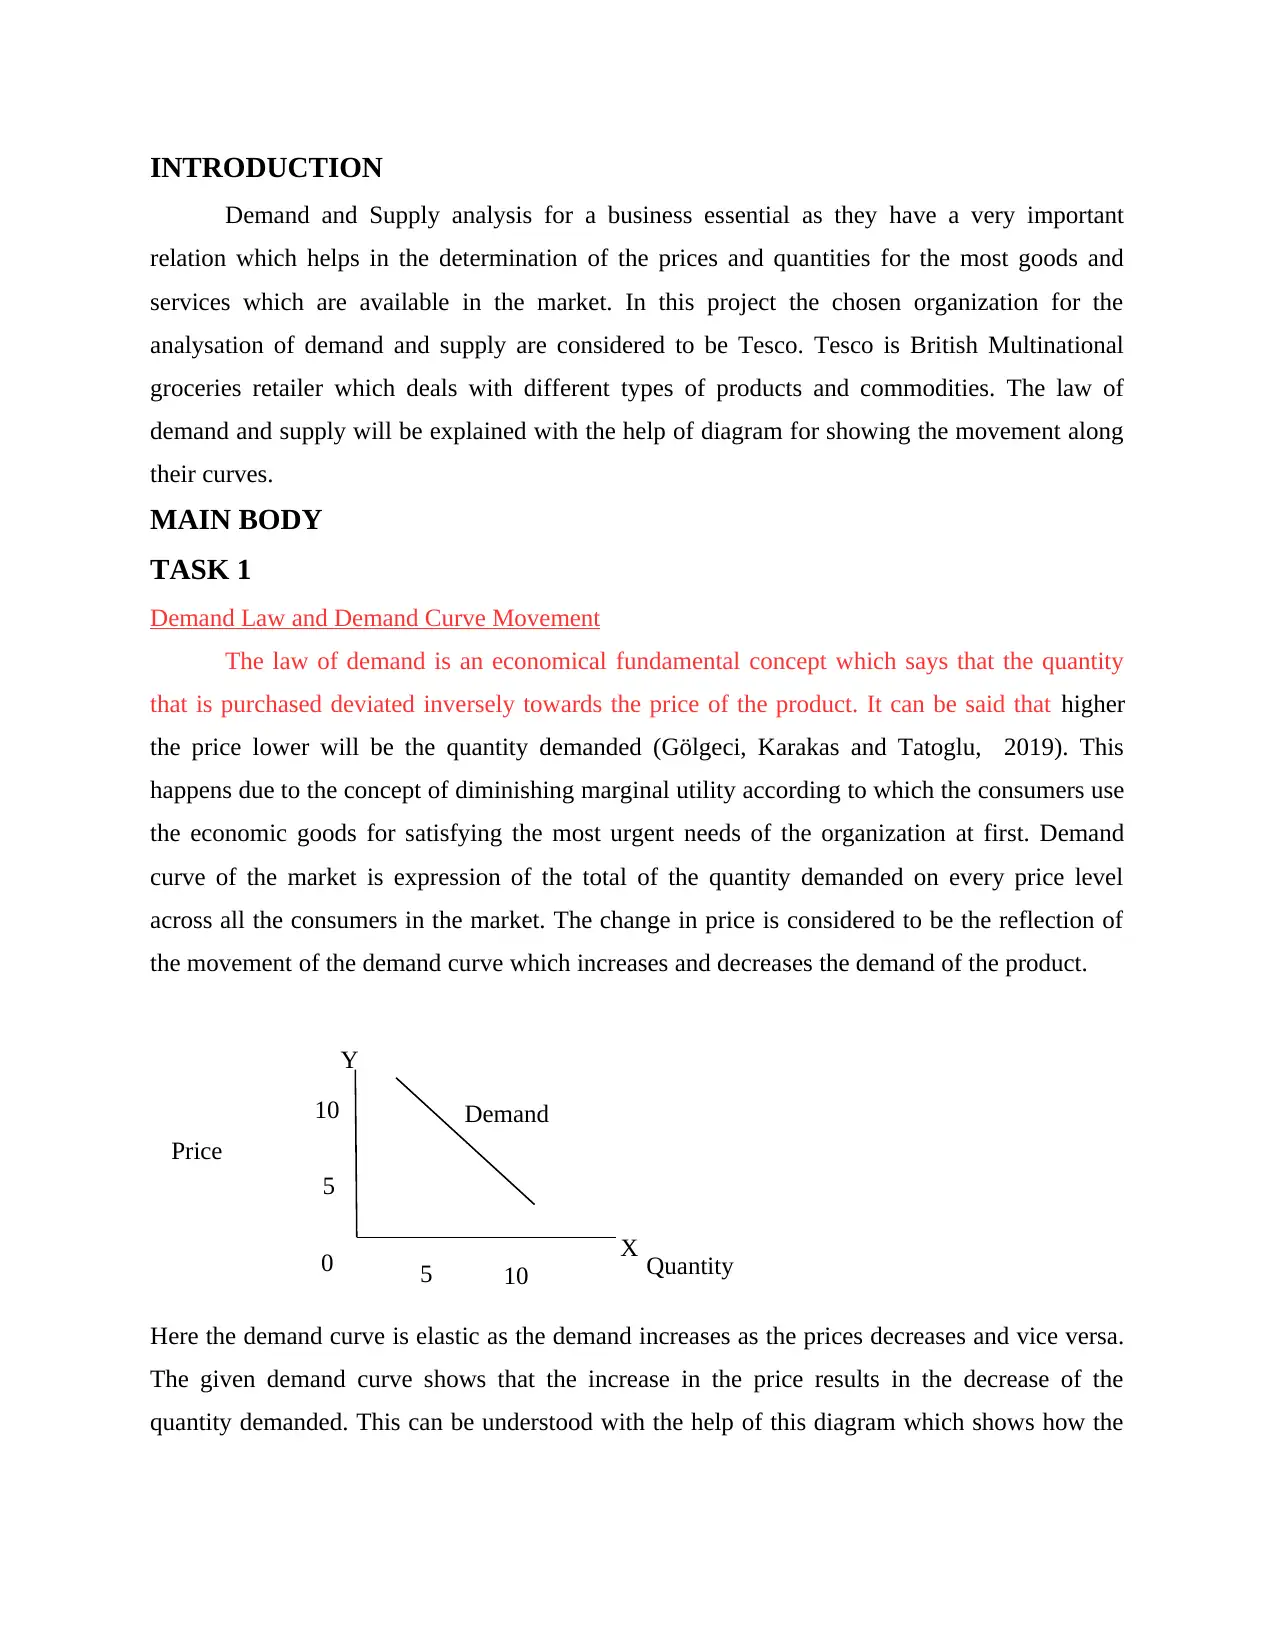
The law of demand is an economical fundamental concept which says that the quantity
that is purchased deviated inversely towards the price of the product. It can be said that higher
the price lower will be the quantity demanded (Gölgeci, Karakas and Tatoglu, 2019). This
happens due to the concept of diminishing marginal utility according to which the consumers use
the economic goods for satisfying the most urgent needs of the organization at first. Demand
curve of the market is expression of the total of the quantity demanded on every price level
across all the consumers in the market. The change in price is considered to be the reflection of
the movement of the demand curve which increases and decreases the demand of the product.
Here the demand curve is elastic as the demand increases as the prices decreases and vice versa.
The given demand curve shows that the increase in the price results in the decrease of the
quantity demanded. This can be understood with the help of this diagram which shows how the
10
5
0 10
Price
Quantity5
Y
X
Demand
Demand and Supply analysis for a business essential as they have a very important
relation which helps in the determination of the prices and quantities for the most goods and
services which are available in the market. In this project the chosen organization for the
analysation of demand and supply are considered to be Tesco. Tesco is British Multinational
groceries retailer which deals with different types of products and commodities. The law of
demand and supply will be explained with the help of diagram for showing the movement along
their curves.
MAIN BODY
TASK 1
Demand Law and Demand Curve Movement
The law of demand is an economical fundamental concept which says that the quantity
that is purchased deviated inversely towards the price of the product. It can be said that higher
the price lower will be the quantity demanded (Gölgeci, Karakas and Tatoglu, 2019). This
happens due to the concept of diminishing marginal utility according to which the consumers use
the economic goods for satisfying the most urgent needs of the organization at first. Demand
curve of the market is expression of the total of the quantity demanded on every price level
across all the consumers in the market. The change in price is considered to be the reflection of
the movement of the demand curve which increases and decreases the demand of the product.
Here the demand curve is elastic as the demand increases as the prices decreases and vice versa.
The given demand curve shows that the increase in the price results in the decrease of the
quantity demanded. This can be understood with the help of this diagram which shows how the
10
5
0 10
Price
Quantity5
Y
X
Demand
⊘ This is a preview!⊘
Do you want full access?
Subscribe today to unlock all pages.
Trusted by 1+ million students worldwide
price when rises over the Y axis the quantity demanded decreases whilst most of the other factors
are continuant.
Demand curve is the visual representation bond between the price of the goods and
services and the amount which is required for the give time period (Liu and et.al., 2019). The
demand curve will be moving downwards starting from its left to its right and express the law of
demand. In this the price of the give commodity increases as the quantity of the demanded
decreases whilst all other factors remains equal. All types of business have a certain type of
demand curve which is the factor that affects the demand and also creates and impact which is
seen through the observation of the changes in the demand curve (Sturm and et.al., 2021).
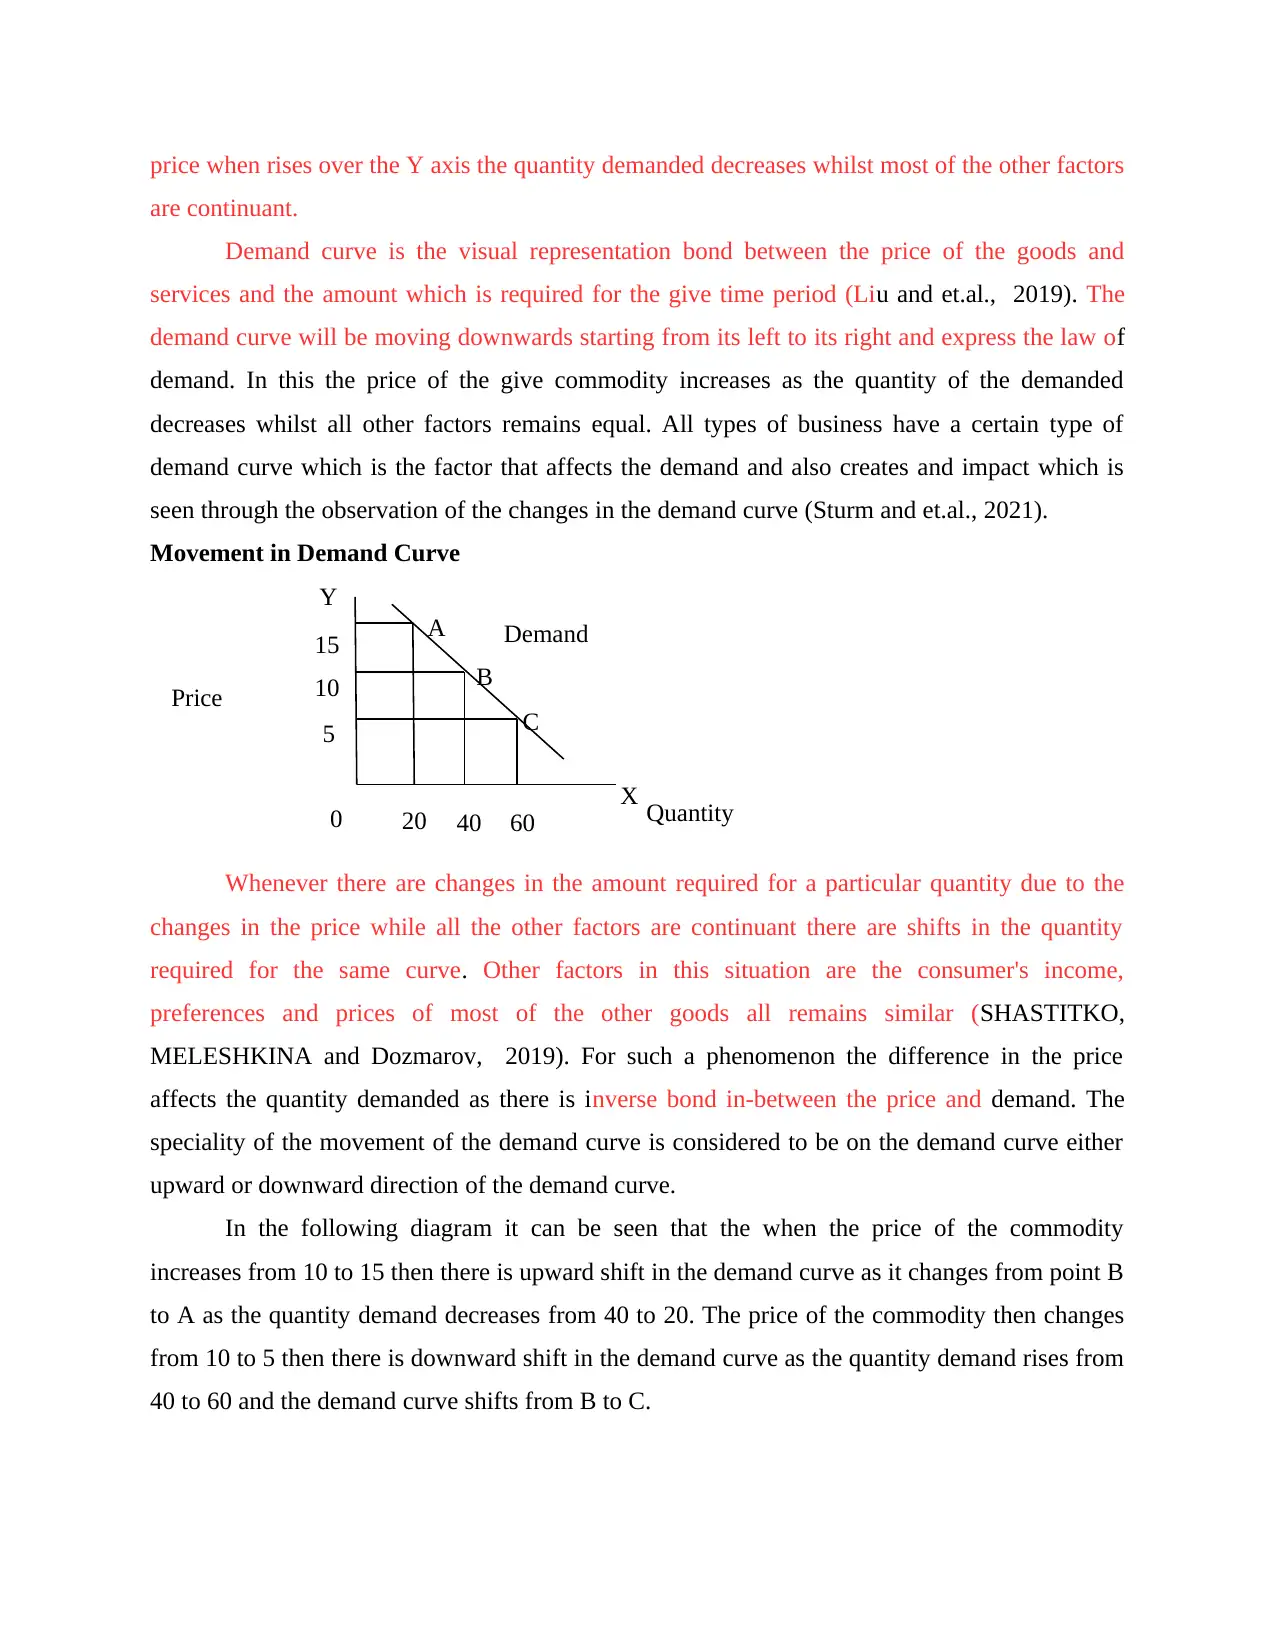
Movement in Demand Curve
Whenever there are changes in the amount required for a particular quantity due to the
changes in the price while all the other factors are continuant there are shifts in the quantity
required for the same curve. Other factors in this situation are the consumer's income,
preferences and prices of most of the other goods all remains similar (SHASTITKO,
MELESHKINA and Dozmarov, 2019). For such a phenomenon the difference in the price
affects the quantity demanded as there is inverse bond in-between the price and demand. The
speciality of the movement of the demand curve is considered to be on the demand curve either
upward or downward direction of the demand curve.
In the following diagram it can be seen that the when the price of the commodity
increases from 10 to 15 then there is upward shift in the demand curve as it changes from point B
to A as the quantity demand decreases from 40 to 20. The price of the commodity then changes
from 10 to 5 then there is downward shift in the demand curve as the quantity demand rises from
40 to 60 and the demand curve shifts from B to C.
10
5
0 40
Price
Quantity20
X
Demand
Y
60
15
C
B
A
are continuant.
Demand curve is the visual representation bond between the price of the goods and
services and the amount which is required for the give time period (Liu and et.al., 2019). The
demand curve will be moving downwards starting from its left to its right and express the law of
demand. In this the price of the give commodity increases as the quantity of the demanded
decreases whilst all other factors remains equal. All types of business have a certain type of
demand curve which is the factor that affects the demand and also creates and impact which is
seen through the observation of the changes in the demand curve (Sturm and et.al., 2021).
Movement in Demand Curve
Whenever there are changes in the amount required for a particular quantity due to the
changes in the price while all the other factors are continuant there are shifts in the quantity
required for the same curve. Other factors in this situation are the consumer's income,
preferences and prices of most of the other goods all remains similar (SHASTITKO,
MELESHKINA and Dozmarov, 2019). For such a phenomenon the difference in the price
affects the quantity demanded as there is inverse bond in-between the price and demand. The
speciality of the movement of the demand curve is considered to be on the demand curve either
upward or downward direction of the demand curve.
In the following diagram it can be seen that the when the price of the commodity
increases from 10 to 15 then there is upward shift in the demand curve as it changes from point B
to A as the quantity demand decreases from 40 to 20. The price of the commodity then changes
from 10 to 5 then there is downward shift in the demand curve as the quantity demand rises from
40 to 60 and the demand curve shifts from B to C.
10
5
0 40
Price
Quantity20
X
Demand
Y
60
15
C
B
A
Paraphrase This Document
Need a fresh take? Get an instant paraphrase of this document with our AI Paraphraser
Therefore, it can be said that the difference in the price with all the other factors staying
same can move the demand curve upwards or downwards.
Demand Law and Demand Curve Movement
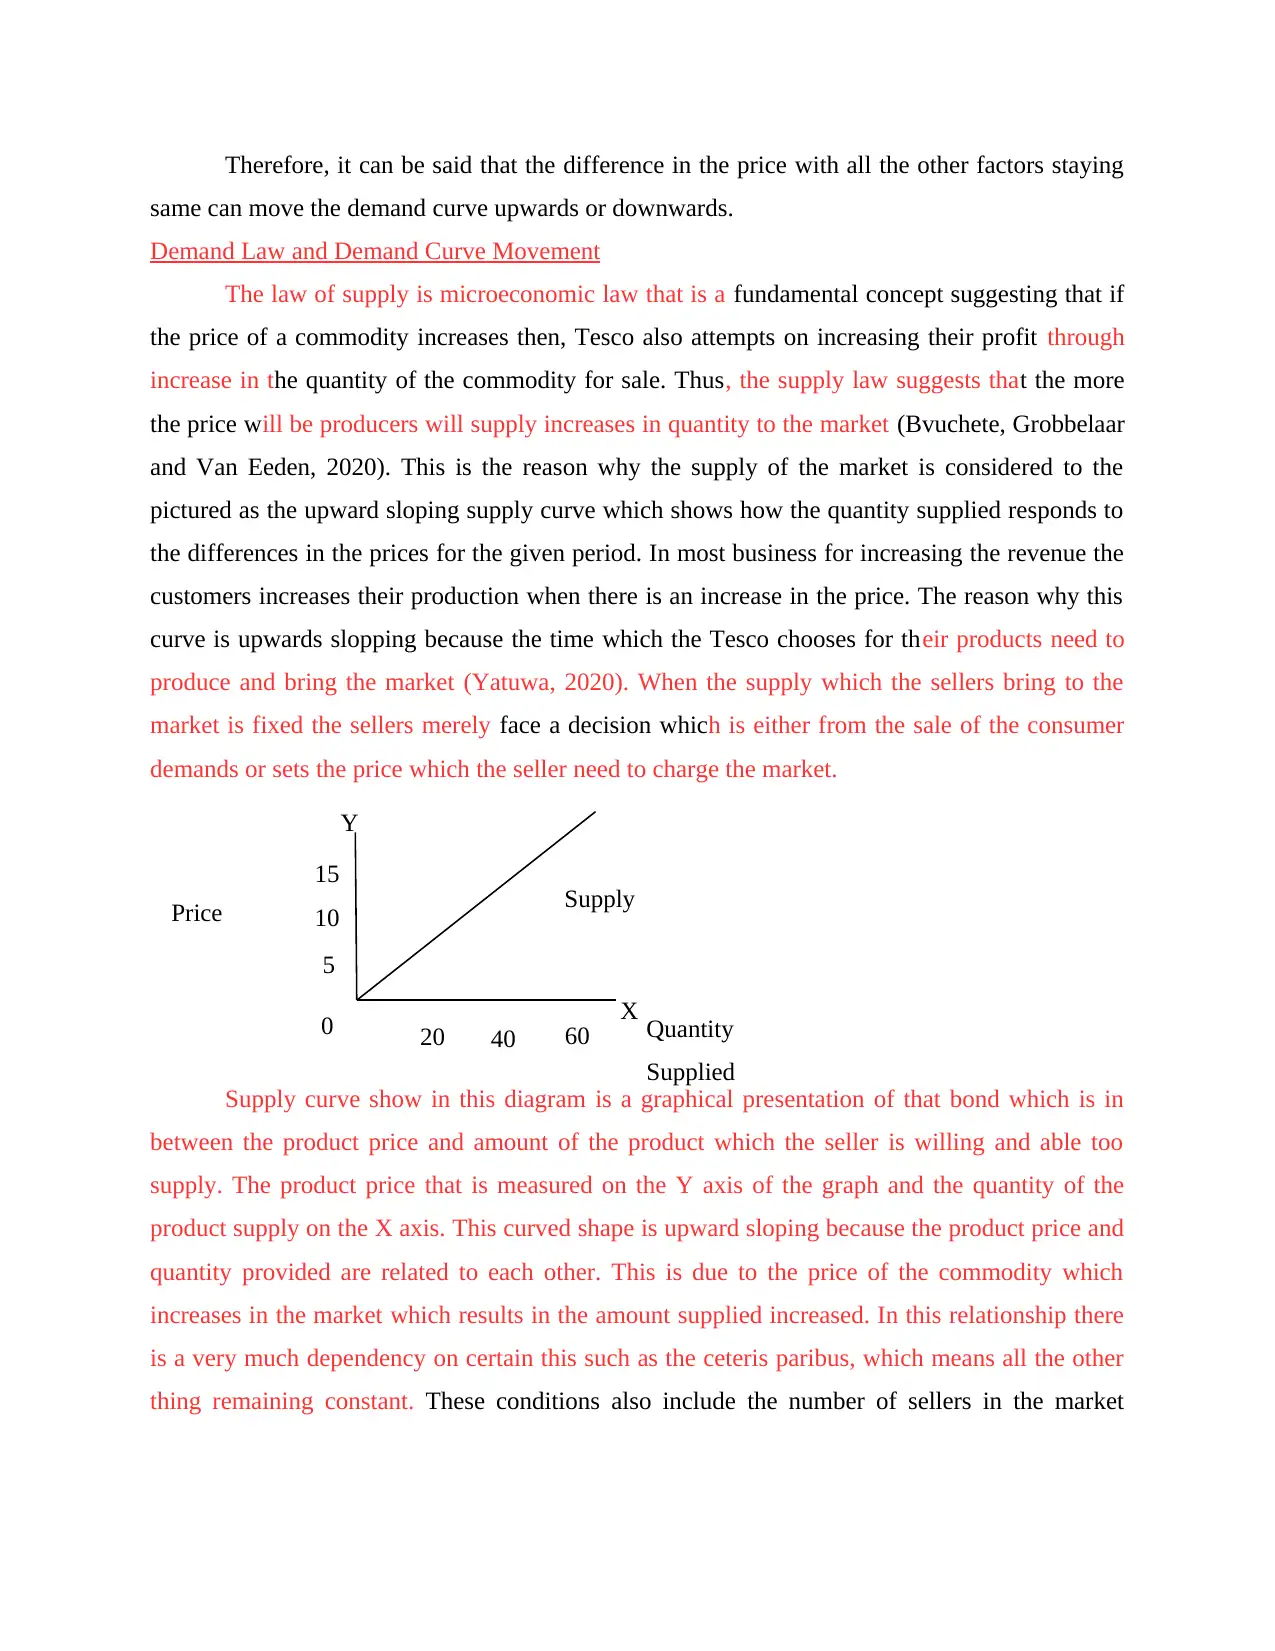
The law of supply is microeconomic law that is a fundamental concept suggesting that if
the price of a commodity increases then, Tesco also attempts on increasing their profit through
increase in the quantity of the commodity for sale. Thus, the supply law suggests that the more
the price will be producers will supply increases in quantity to the market (Bvuchete, Grobbelaar
and Van Eeden, 2020). This is the reason why the supply of the market is considered to the
pictured as the upward sloping supply curve which shows how the quantity supplied responds to
the differences in the prices for the given period. In most business for increasing the revenue the
customers increases their production when there is an increase in the price. The reason why this
curve is upwards slopping because the time which the Tesco chooses for their products need to
produce and bring the market (Yatuwa, 2020). When the supply which the sellers bring to the
market is fixed the sellers merely face a decision which is either from the sale of the consumer
demands or sets the price which the seller need to charge the market.
Supply curve show in this diagram is a graphical presentation of that bond which is in
between the product price and amount of the product which the seller is willing and able too
supply. The product price that is measured on the Y axis of the graph and the quantity of the
product supply on the X axis. This curved shape is upward sloping because the product price and
quantity provided are related to each other. This is due to the price of the commodity which
increases in the market which results in the amount supplied increased. In this relationship there
is a very much dependency on certain this such as the ceteris paribus, which means all the other
thing remaining constant. These conditions also include the number of sellers in the market
10
5
0 40
Price
Quantity
Supplied
20
Y
X
Supply
60
15
same can move the demand curve upwards or downwards.
Demand Law and Demand Curve Movement
The law of supply is microeconomic law that is a fundamental concept suggesting that if
the price of a commodity increases then, Tesco also attempts on increasing their profit through
increase in the quantity of the commodity for sale. Thus, the supply law suggests that the more
the price will be producers will supply increases in quantity to the market (Bvuchete, Grobbelaar
and Van Eeden, 2020). This is the reason why the supply of the market is considered to the
pictured as the upward sloping supply curve which shows how the quantity supplied responds to
the differences in the prices for the given period. In most business for increasing the revenue the
customers increases their production when there is an increase in the price. The reason why this
curve is upwards slopping because the time which the Tesco chooses for their products need to
produce and bring the market (Yatuwa, 2020). When the supply which the sellers bring to the
market is fixed the sellers merely face a decision which is either from the sale of the consumer
demands or sets the price which the seller need to charge the market.
Supply curve show in this diagram is a graphical presentation of that bond which is in
between the product price and amount of the product which the seller is willing and able too
supply. The product price that is measured on the Y axis of the graph and the quantity of the
product supply on the X axis. This curved shape is upward sloping because the product price and
quantity provided are related to each other. This is due to the price of the commodity which
increases in the market which results in the amount supplied increased. In this relationship there
is a very much dependency on certain this such as the ceteris paribus, which means all the other
thing remaining constant. These conditions also include the number of sellers in the market
10
5
0 40
Price
Quantity
Supplied
20
Y
X
Supply
60
15
which is the state of technology, level of production costs and the prices of other related
products. If there was a deviation in all the conditions there would be a shift in the supply curve.
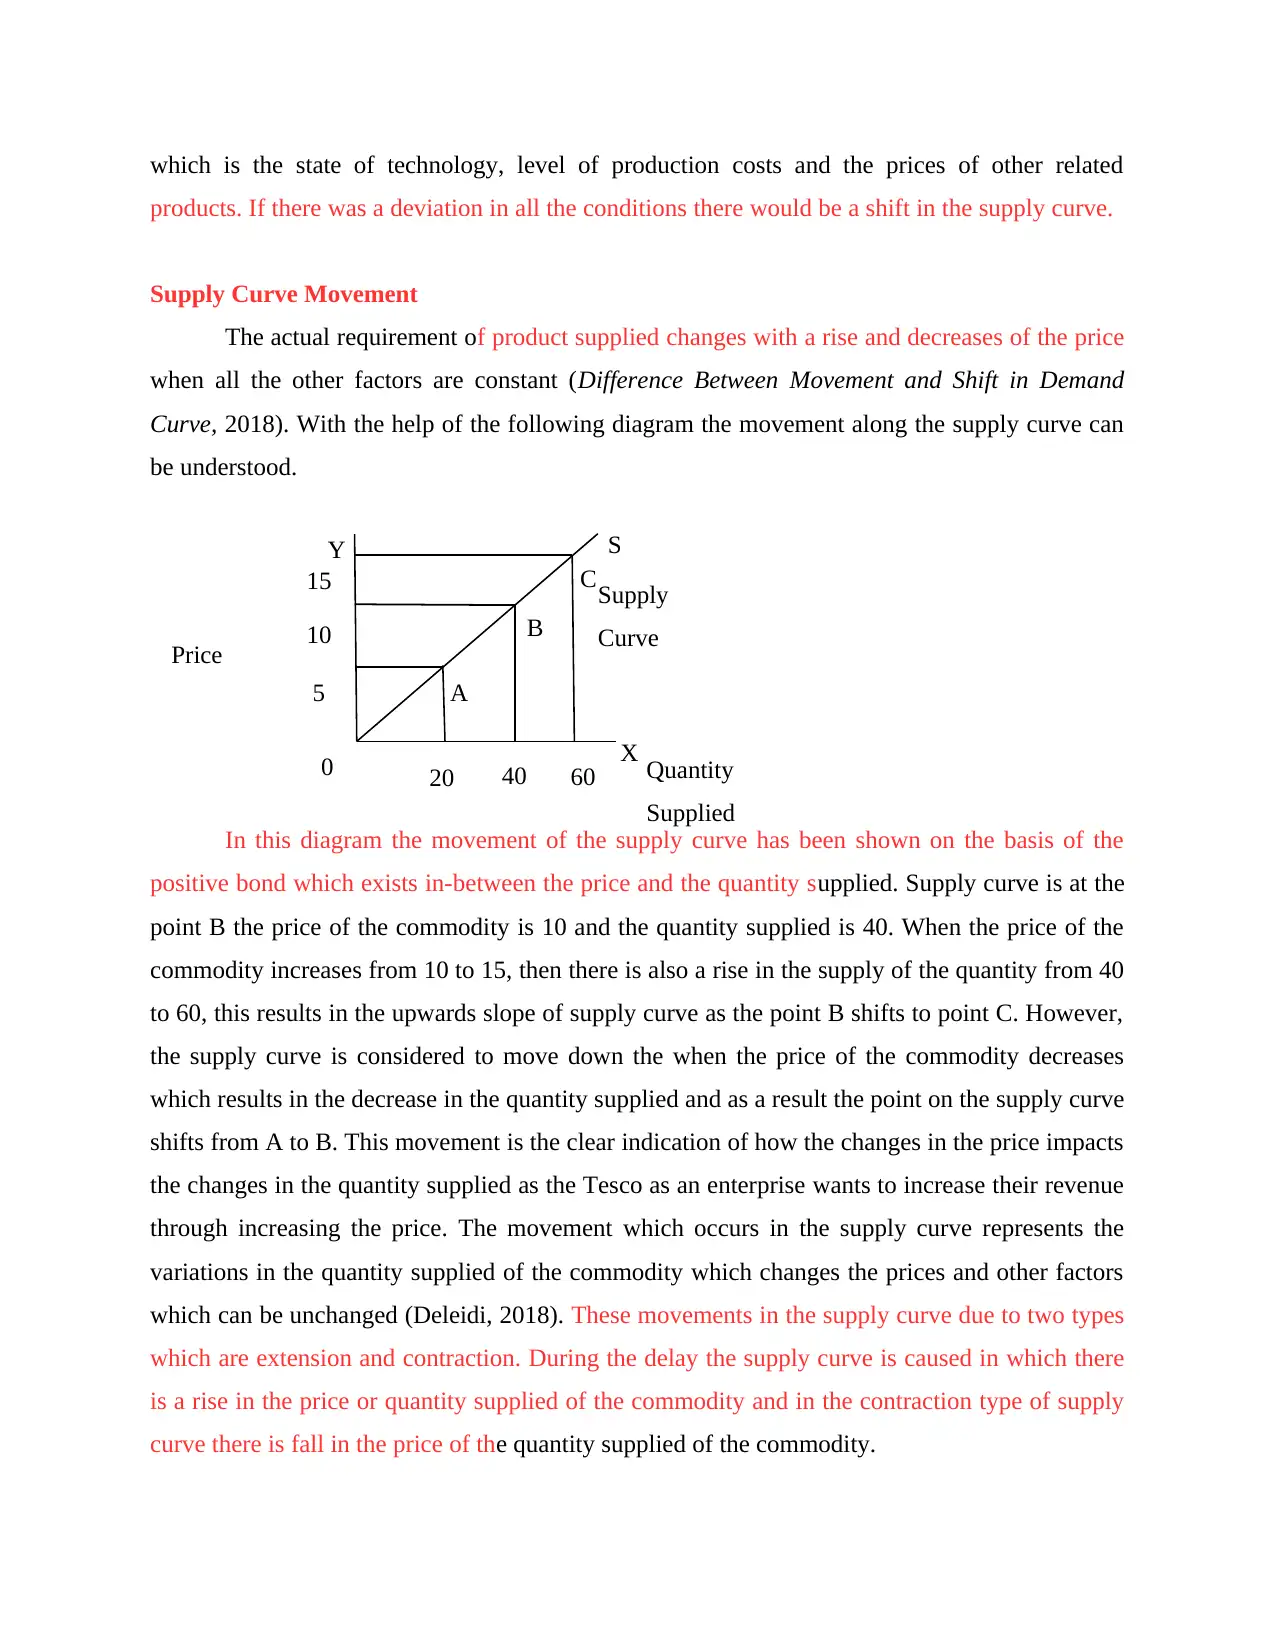
Supply Curve Movement
The actual requirement of product supplied changes with a rise and decreases of the price
when all the other factors are constant (Difference Between Movement and Shift in Demand
Curve, 2018). With the help of the following diagram the movement along the supply curve can
be understood.
In this diagram the movement of the supply curve has been shown on the basis of the
positive bond which exists in-between the price and the quantity supplied. Supply curve is at the
point B the price of the commodity is 10 and the quantity supplied is 40. When the price of the
commodity increases from 10 to 15, then there is also a rise in the supply of the quantity from 40
to 60, this results in the upwards slope of supply curve as the point B shifts to point C. However,
the supply curve is considered to move down the when the price of the commodity decreases
which results in the decrease in the quantity supplied and as a result the point on the supply curve
shifts from A to B. This movement is the clear indication of how the changes in the price impacts
the changes in the quantity supplied as the Tesco as an enterprise wants to increase their revenue
through increasing the price. The movement which occurs in the supply curve represents the
variations in the quantity supplied of the commodity which changes the prices and other factors
which can be unchanged (Deleidi, 2018). These movements in the supply curve due to two types
which are extension and contraction. During the delay the supply curve is caused in which there
is a rise in the price or quantity supplied of the commodity and in the contraction type of supply
curve there is fall in the price of the quantity supplied of the commodity.
10
5
0 40
Price
Quantity
Supplied
20
X
Supply
Curve
60
15
Y
A
B
C
S
products. If there was a deviation in all the conditions there would be a shift in the supply curve.
Supply Curve Movement
The actual requirement of product supplied changes with a rise and decreases of the price
when all the other factors are constant (Difference Between Movement and Shift in Demand
Curve, 2018). With the help of the following diagram the movement along the supply curve can
be understood.
In this diagram the movement of the supply curve has been shown on the basis of the
positive bond which exists in-between the price and the quantity supplied. Supply curve is at the
point B the price of the commodity is 10 and the quantity supplied is 40. When the price of the
commodity increases from 10 to 15, then there is also a rise in the supply of the quantity from 40
to 60, this results in the upwards slope of supply curve as the point B shifts to point C. However,
the supply curve is considered to move down the when the price of the commodity decreases
which results in the decrease in the quantity supplied and as a result the point on the supply curve
shifts from A to B. This movement is the clear indication of how the changes in the price impacts
the changes in the quantity supplied as the Tesco as an enterprise wants to increase their revenue
through increasing the price. The movement which occurs in the supply curve represents the
variations in the quantity supplied of the commodity which changes the prices and other factors
which can be unchanged (Deleidi, 2018). These movements in the supply curve due to two types
which are extension and contraction. During the delay the supply curve is caused in which there
is a rise in the price or quantity supplied of the commodity and in the contraction type of supply
curve there is fall in the price of the quantity supplied of the commodity.
10
5
0 40
Price
Quantity
Supplied
20
X
Supply
Curve
60
15
Y
A
B
C
S
⊘ This is a preview!⊘
Do you want full access?
Subscribe today to unlock all pages.
Trusted by 1+ million students worldwide
CONCLUSION
With the help of this project it can be concluded that the supply and demand both are
fundamentals to Tesco's businesses as it is very essential for them to understand their concept as
it is successful in the determination of the growth and success of the Tesco. In this there has been
a critical analysation of the different micro economic concepts for this organization on how its
demand and supply changes when the conditions are at ceteris paribus. This project explained the
law of demand and also the movement which was caused in the law of demand due to the
changes in the price impacting quantity demanded inversely. In this project the law of supply
was also explained with the help of diagrams along with its movement which was caused due to
the positive relations between the price and quantity supplied.
Paraphrase This Document
Need a fresh take? Get an instant paraphrase of this document with our AI Paraphraser
REFERENCES
Books and Journals
Bvuchete, M., Grobbelaar, S.S. and Van Eeden, J., 2020. Best practices for demand-driven
supply chain management in public healthcare sector: a systematic literature review.
South African Journal of Industrial Engineering. 31(2). pp.11-27.
Deleidi, M., 2018. Post Keynesian endogenous money theory: A theoretical and empirical
investigation of the credit demand schedule. Journal of Post Keynesian Economics.
41(2). pp.185-209.
Gölgeci, I., Karakas, F. and Tatoglu, E., 2019. Understanding demand and supply paradoxes and
their role in business-to-business firms. Industrial Marketing Management. 76. pp.169-
180.
Liu, Z., and et.al., 2019. Optimization of fuzzy demand distribution supply chain using modified
sequence quadratic programming approach. Journal of Intelligent & Fuzzy Systems.
36(6). pp.6167-6180.
SHASTITKO, A.E., MELESHKINA, A.I. and Dozmarov, K.V., 2019. Error risks under antitrust
law enforcement: Effects of demand and supply shocks. Upravlenets. 10(3). pp.2-3.
Sturm, S., and et.al., 2021. Empirical research on the relationships between demand-and supply-
side risk management practices and their impact on business performance. Supply Chain
Management: An International Journal.
Yatuwa, S., 2020. Assessment of factors influencing demand and supply management on
pharmaceutical supply chain performance in Tanzania: A case of Medical Store
Department in Dar es Salaam region (Doctoral dissertation, Mzumbe University).
Online
Difference Between Movement and Shift in Demand Curve, 2018[Online]. Available through:
<https://keydifferences.com/difference-between-movement-and-shift-in-demand-
curve.html#:~:text=Movement%20along%20the%20demand%20curve,movement
%20of%20the%20demand%20curve.>
1 out of 8
Related Documents

Your All-in-One AI-Powered Toolkit for Academic Success.
+13062052269
info@desklib.com
Available 24*7 on WhatsApp / Email
![[object Object]](/_next/static/media/star-bottom.7253800d.svg)
Unlock your academic potential
Copyright © 2020–2026 A2Z Services. All Rights Reserved. Developed and managed by ZUCOL.