Corporate Finance: Analysis of Tesco's Capital Structure and WACC
VerifiedAdded on 2020/01/23
|17
|5254
|1246
Report
AI Summary
This report delves into the capital structure of Tesco, a major UK-based retail company, examining its weighted average cost of capital (WACC) and relevant financial theories. The analysis begins with an introduction to WACC and a discussion of key capital structure theories, including trade-off, pecking order, and Modigliani-Miller theories, to identify the most suitable theory for Tesco. The report then calculates Tesco's WACC using data from Yahoo Finance and annual reports, interpreting the results and discussing the firm's capital structure policy. The study also provides an introductory overview of Tesco's standing in the industry, including its challenges, strategies, and competitive landscape, comparing it with competitors such as Sainsbury's and Morrison's. The report concludes with a comparison of WACC across the three firms, providing a comprehensive financial analysis of Tesco's capital structure and its implications.
CORPORATE FINANCE
Paraphrase This Document
Need a fresh take? Get an instant paraphrase of this document with our AI Paraphraser
TABLE OF CONTENTS
INTRODUCTION...........................................................................................................................3
Part 1: Critical main theories of the capital structure .....................................................................3
Part 2: Introductory report on the Tesco and its standing in the industry........................................6
Part 3: Comparison of WACC of all three firms...........................................................................11
CONCLUSION .............................................................................................................................14
REFERENCES..............................................................................................................................15
INDEX OF TABLES
Table 1: Calculation of cost of equity..............................................................................................7
Table 2: Capital structure of the Tesco............................................................................................7
Table 3: Calculation of WACC........................................................................................................7
Table 4: Calculation of cost of equity..............................................................................................8
Table 5: Capital structure of the firm...............................................................................................8
Table 6: Calculation of WACC........................................................................................................8
Table 7: Calculation of cost of equity.............................................................................................8
Table 8: Capital structure of the firm...............................................................................................9
Table 9: Calculation of WACC........................................................................................................9
Table 10: Gearing ratio calculation..................................................................................................9
Table 11: Gearing ratio and WACC................................................................................................9
Table 12: WACC of all three firms...............................................................................................11
Table 13: WACC of Tesco............................................................................................................12
Table 14: WACC of Morrison......................................................................................................12
Table 15: Change in capital structure............................................................................................13
ILLUSTRATION INDEX
Illustration 1: Chart plotting of gearing ratio and WACC.............................................................10
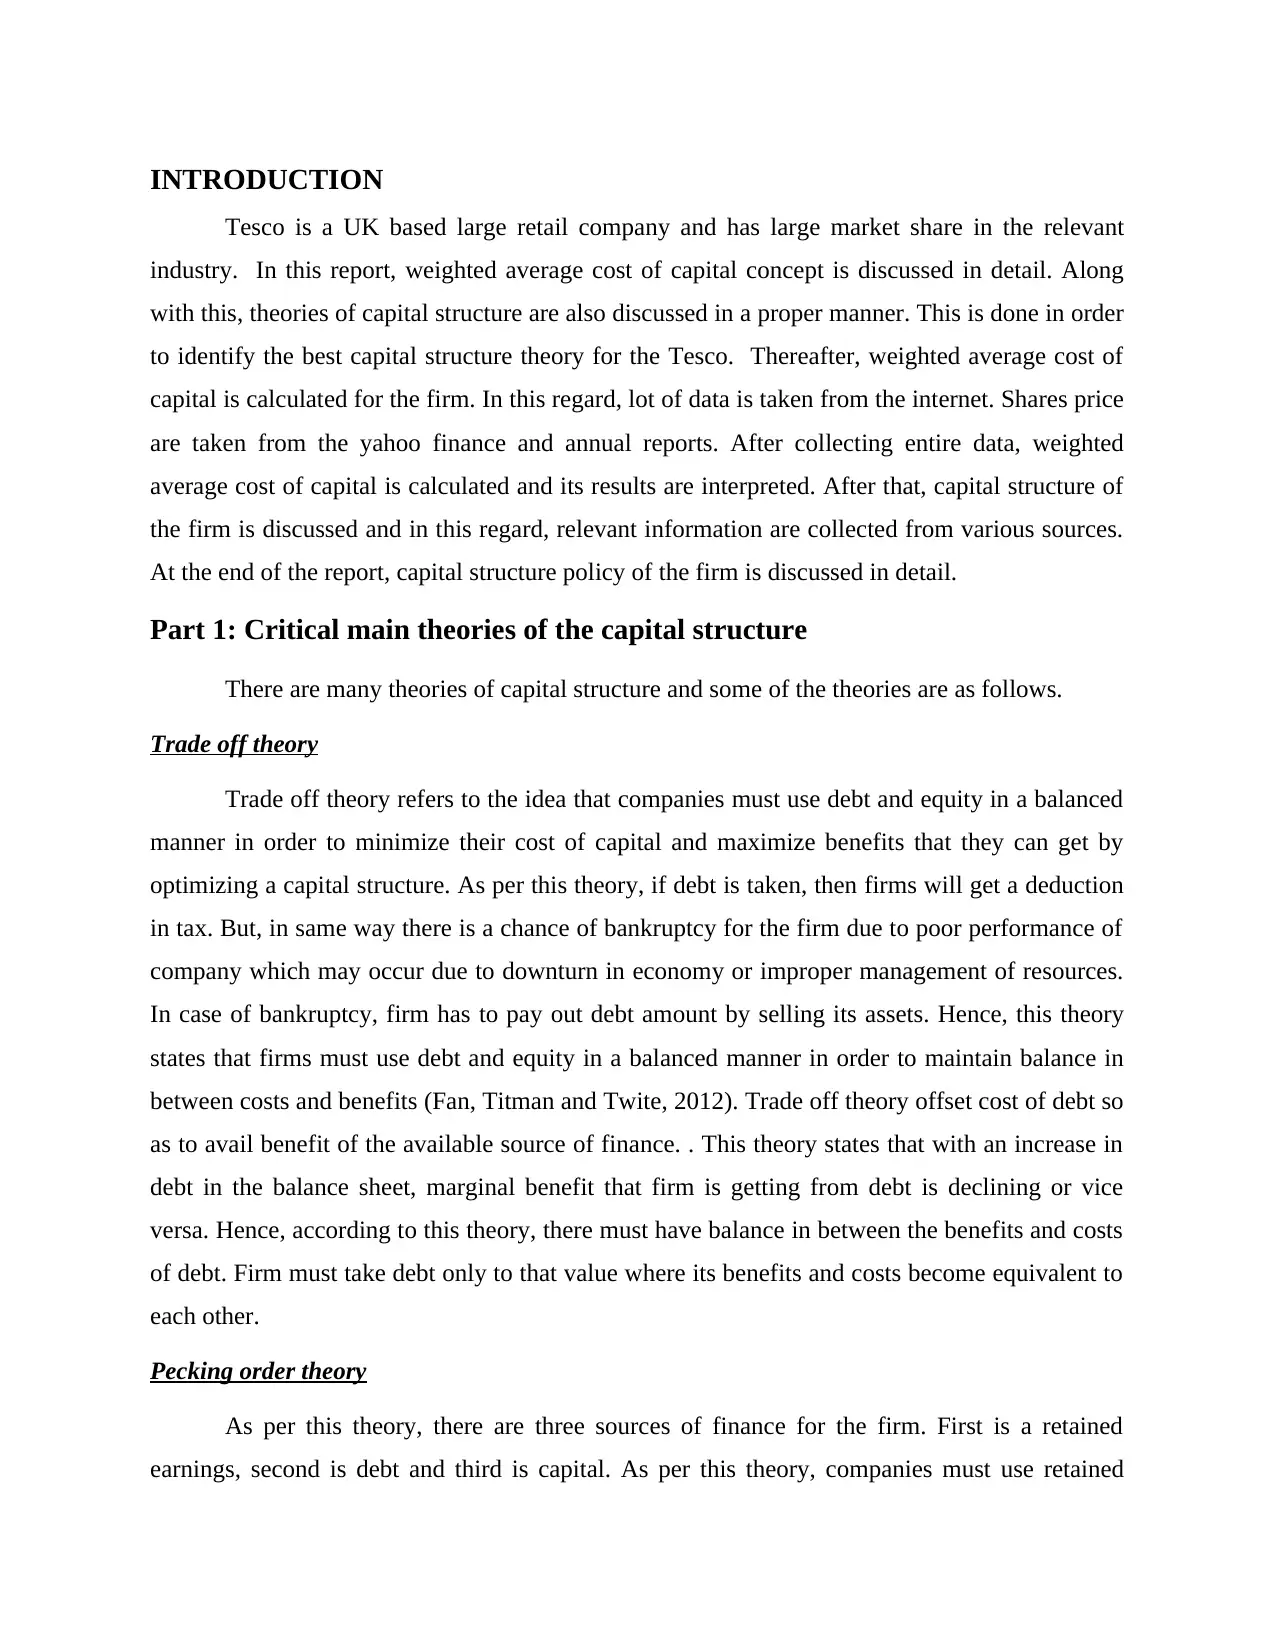
INTRODUCTION
Tesco is a UK based large retail company and has large market share in the relevant
industry. In this report, weighted average cost of capital concept is discussed in detail. Along
with this, theories of capital structure are also discussed in a proper manner. This is done in order
to identify the best capital structure theory for the Tesco. Thereafter, weighted average cost of
capital is calculated for the firm. In this regard, lot of data is taken from the internet. Shares price
are taken from the yahoo finance and annual reports. After collecting entire data, weighted
average cost of capital is calculated and its results are interpreted. After that, capital structure of
the firm is discussed and in this regard, relevant information are collected from various sources.
At the end of the report, capital structure policy of the firm is discussed in detail.
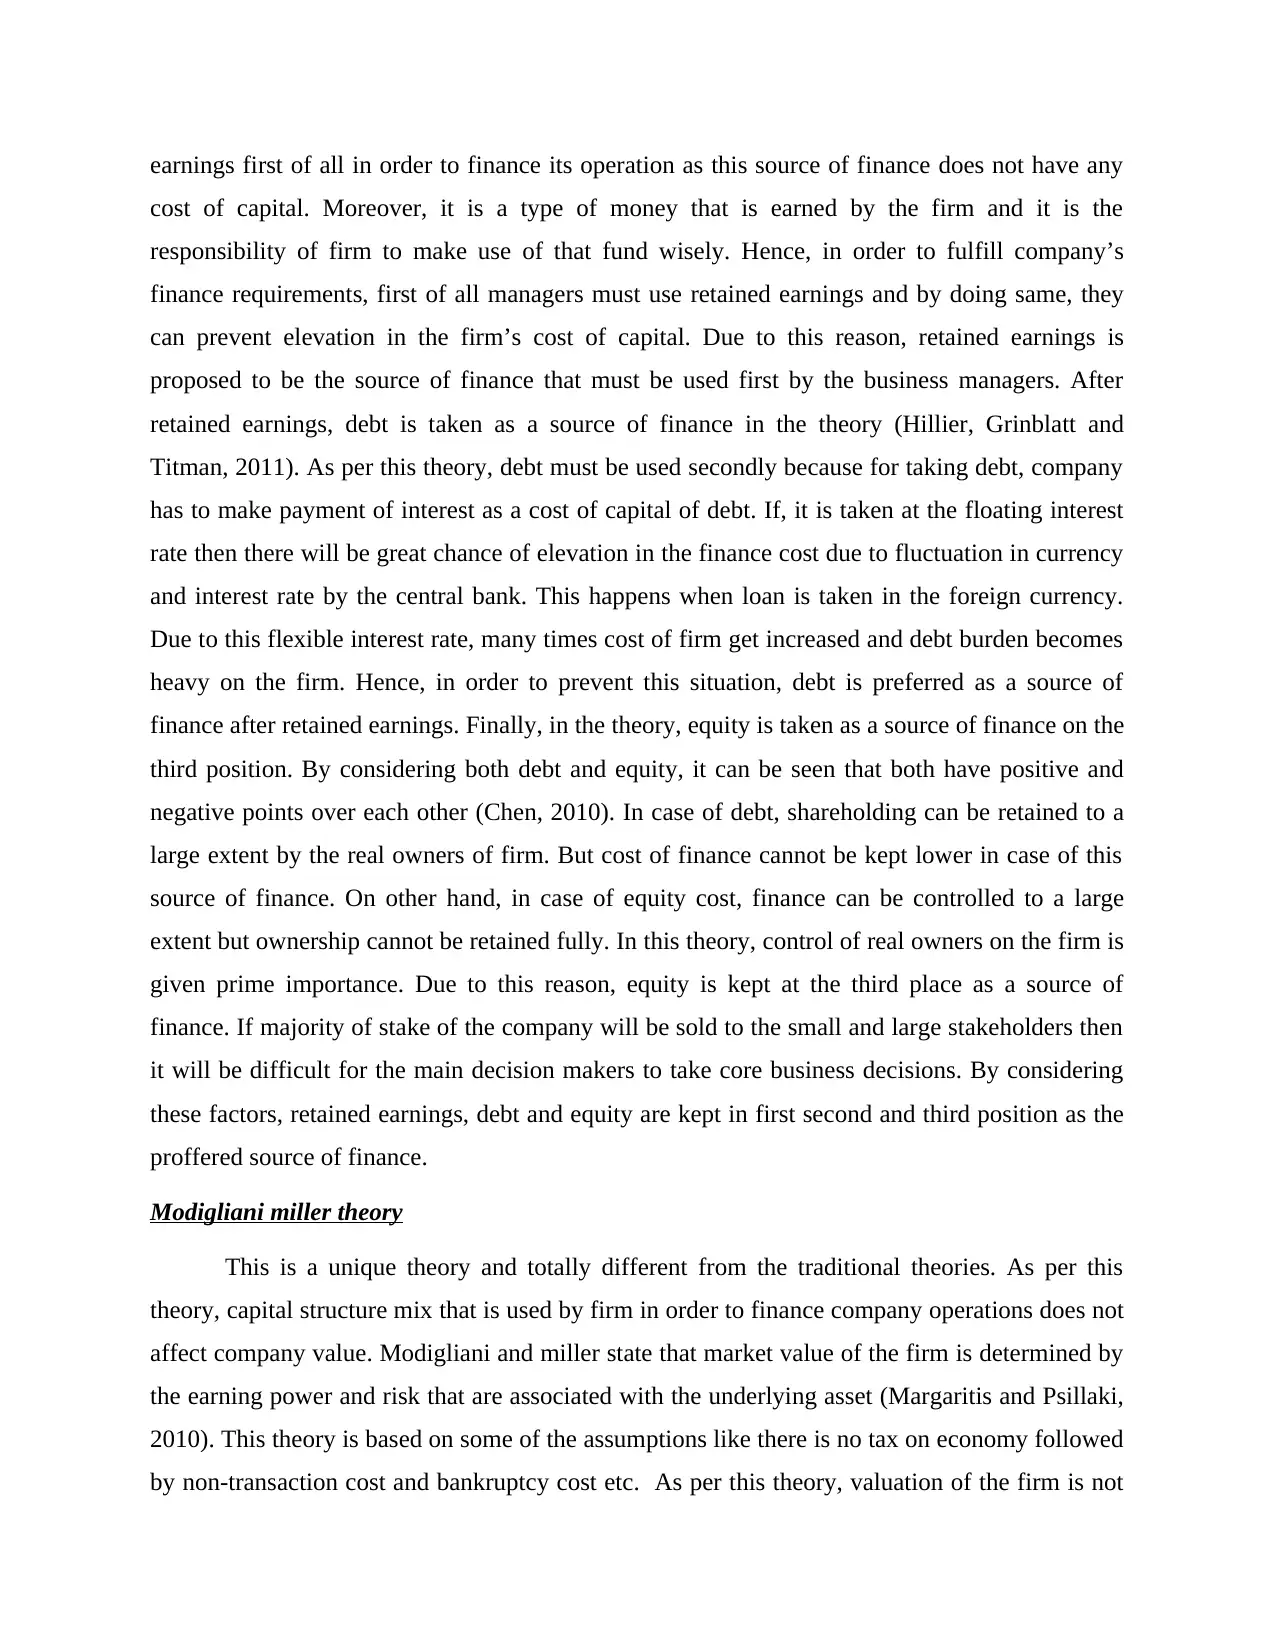
Part 1: Critical main theories of the capital structure
There are many theories of capital structure and some of the theories are as follows.
Trade off theory
Trade off theory refers to the idea that companies must use debt and equity in a balanced
manner in order to minimize their cost of capital and maximize benefits that they can get by
optimizing a capital structure. As per this theory, if debt is taken, then firms will get a deduction
in tax. But, in same way there is a chance of bankruptcy for the firm due to poor performance of
company which may occur due to downturn in economy or improper management of resources.
In case of bankruptcy, firm has to pay out debt amount by selling its assets. Hence, this theory
states that firms must use debt and equity in a balanced manner in order to maintain balance in
between costs and benefits (Fan, Titman and Twite, 2012). Trade off theory offset cost of debt so
as to avail benefit of the available source of finance. . This theory states that with an increase in
debt in the balance sheet, marginal benefit that firm is getting from debt is declining or vice
versa. Hence, according to this theory, there must have balance in between the benefits and costs
of debt. Firm must take debt only to that value where its benefits and costs become equivalent to
each other.
Pecking order theory
As per this theory, there are three sources of finance for the firm. First is a retained
earnings, second is debt and third is capital. As per this theory, companies must use retained
Tesco is a UK based large retail company and has large market share in the relevant
industry. In this report, weighted average cost of capital concept is discussed in detail. Along
with this, theories of capital structure are also discussed in a proper manner. This is done in order
to identify the best capital structure theory for the Tesco. Thereafter, weighted average cost of
capital is calculated for the firm. In this regard, lot of data is taken from the internet. Shares price
are taken from the yahoo finance and annual reports. After collecting entire data, weighted
average cost of capital is calculated and its results are interpreted. After that, capital structure of
the firm is discussed and in this regard, relevant information are collected from various sources.
At the end of the report, capital structure policy of the firm is discussed in detail.
Part 1: Critical main theories of the capital structure
There are many theories of capital structure and some of the theories are as follows.
Trade off theory
Trade off theory refers to the idea that companies must use debt and equity in a balanced
manner in order to minimize their cost of capital and maximize benefits that they can get by
optimizing a capital structure. As per this theory, if debt is taken, then firms will get a deduction
in tax. But, in same way there is a chance of bankruptcy for the firm due to poor performance of
company which may occur due to downturn in economy or improper management of resources.
In case of bankruptcy, firm has to pay out debt amount by selling its assets. Hence, this theory
states that firms must use debt and equity in a balanced manner in order to maintain balance in
between costs and benefits (Fan, Titman and Twite, 2012). Trade off theory offset cost of debt so
as to avail benefit of the available source of finance. . This theory states that with an increase in
debt in the balance sheet, marginal benefit that firm is getting from debt is declining or vice
versa. Hence, according to this theory, there must have balance in between the benefits and costs
of debt. Firm must take debt only to that value where its benefits and costs become equivalent to
each other.
Pecking order theory
As per this theory, there are three sources of finance for the firm. First is a retained
earnings, second is debt and third is capital. As per this theory, companies must use retained
⊘ This is a preview!⊘
Do you want full access?
Subscribe today to unlock all pages.
Trusted by 1+ million students worldwide
earnings first of all in order to finance its operation as this source of finance does not have any
cost of capital. Moreover, it is a type of money that is earned by the firm and it is the
responsibility of firm to make use of that fund wisely. Hence, in order to fulfill company’s
finance requirements, first of all managers must use retained earnings and by doing same, they
can prevent elevation in the firm’s cost of capital. Due to this reason, retained earnings is
proposed to be the source of finance that must be used first by the business managers. After
retained earnings, debt is taken as a source of finance in the theory (Hillier, Grinblatt and
Titman, 2011). As per this theory, debt must be used secondly because for taking debt, company
has to make payment of interest as a cost of capital of debt. If, it is taken at the floating interest
rate then there will be great chance of elevation in the finance cost due to fluctuation in currency
and interest rate by the central bank. This happens when loan is taken in the foreign currency.
Due to this flexible interest rate, many times cost of firm get increased and debt burden becomes
heavy on the firm. Hence, in order to prevent this situation, debt is preferred as a source of
finance after retained earnings. Finally, in the theory, equity is taken as a source of finance on the
third position. By considering both debt and equity, it can be seen that both have positive and
negative points over each other (Chen, 2010). In case of debt, shareholding can be retained to a
large extent by the real owners of firm. But cost of finance cannot be kept lower in case of this
source of finance. On other hand, in case of equity cost, finance can be controlled to a large
extent but ownership cannot be retained fully. In this theory, control of real owners on the firm is
given prime importance. Due to this reason, equity is kept at the third place as a source of
finance. If majority of stake of the company will be sold to the small and large stakeholders then
it will be difficult for the main decision makers to take core business decisions. By considering
these factors, retained earnings, debt and equity are kept in first second and third position as the
proffered source of finance.
Modigliani miller theory
This is a unique theory and totally different from the traditional theories. As per this
theory, capital structure mix that is used by firm in order to finance company operations does not
affect company value. Modigliani and miller state that market value of the firm is determined by
the earning power and risk that are associated with the underlying asset (Margaritis and Psillaki,
2010). This theory is based on some of the assumptions like there is no tax on economy followed
by non-transaction cost and bankruptcy cost etc. As per this theory, valuation of the firm is not
Paraphrase This Document
Need a fresh take? Get an instant paraphrase of this document with our AI Paraphraser
related to the capital structure of the firm. However, market value of the firm is affected by its
future growth prospects and not affected by the risk involved in the investment. This theory also
states that market value of firm is depended on the capital structure of firm. If, company will
have a good growth prospect then its market value will be higher and stock price will also rise or
vice -verse. It can be said that this theory is discussed about the relevance of capital structure to
the market value of firm. It does not discuss about the firm capital structure. This happens
because it assumes that there is no tax and no debt benefits in the economy. Due to this reason, it
does not assume the importance of capital structure mix from the firm point of view. Modigliani
and miller theory assumes that firm’s growth depends on the future business decisions.
Moreover, capital structure is assumed to play no role in the growth of the organization (Berk,
Stanton and Zechner, 2010). Due to this reason, it can be said that capital structure must not be
used for the company’s valuation.
If, we compare all these theories with each other then it can be seen that these are
different from each other. Trade off theory is focusing only on debt in order to optimize capital
structure and maintain balance between cost and benefits of debt. Whereas, on the other hand, in
case of pecking theory importance is given to all the sources of finance and in which order they
must be used is clearly determined. Third is the theory of Modigliani and Miller which states that
there is no importance of capital structure for the firm and it does not affect firm value. All these
theories are varied from each other. In the today era, importance of any source of finance cannot
be undermined. In first theory, focus is given only on debt which is its major weakness.
However, it is true that most of the companies take debt in order to finance their operations.
They take debt by looking at their future needs. The organization cannot limit its exposure to
funds due to risk associated with the same. In order to grow business sharply, firm need lots of
finance and need to ignore risk (Matsa, 2010). Secondly, in this theory, retained earnings are not
considered at all which a major loophole of this theory is. If, we compare this theory with
peeking theory then it can be seen that in second theory, all the sources of finance are considered
and on the basis of risks associated with them, sequence of these sources is determined. Hence, it
can be said that peeking theory acts as a guide for the finance managers. This theory talks about
the use of financial sources by minimizing risk and financing company’s operations in an easy
manner (Cook and Tang, 2010). Third is the theory of Modigliani and Miller which is focused on
moving at different direction by assuming unrealistic things. It assumes that there will be no tax
and transaction cost in business that is not possible in the real world. Hence, capital structure
concept cannot be ignored in order to minimize risk and finance cost associated with different
source of finance. Due to this reason, it can be said that this theory does not stand in the practical
world relative to the traditional theories. Hence, on the basis on entire discussion, it is concluded
that peeking theory is best for companies from the point of view of cost and risk minimization.
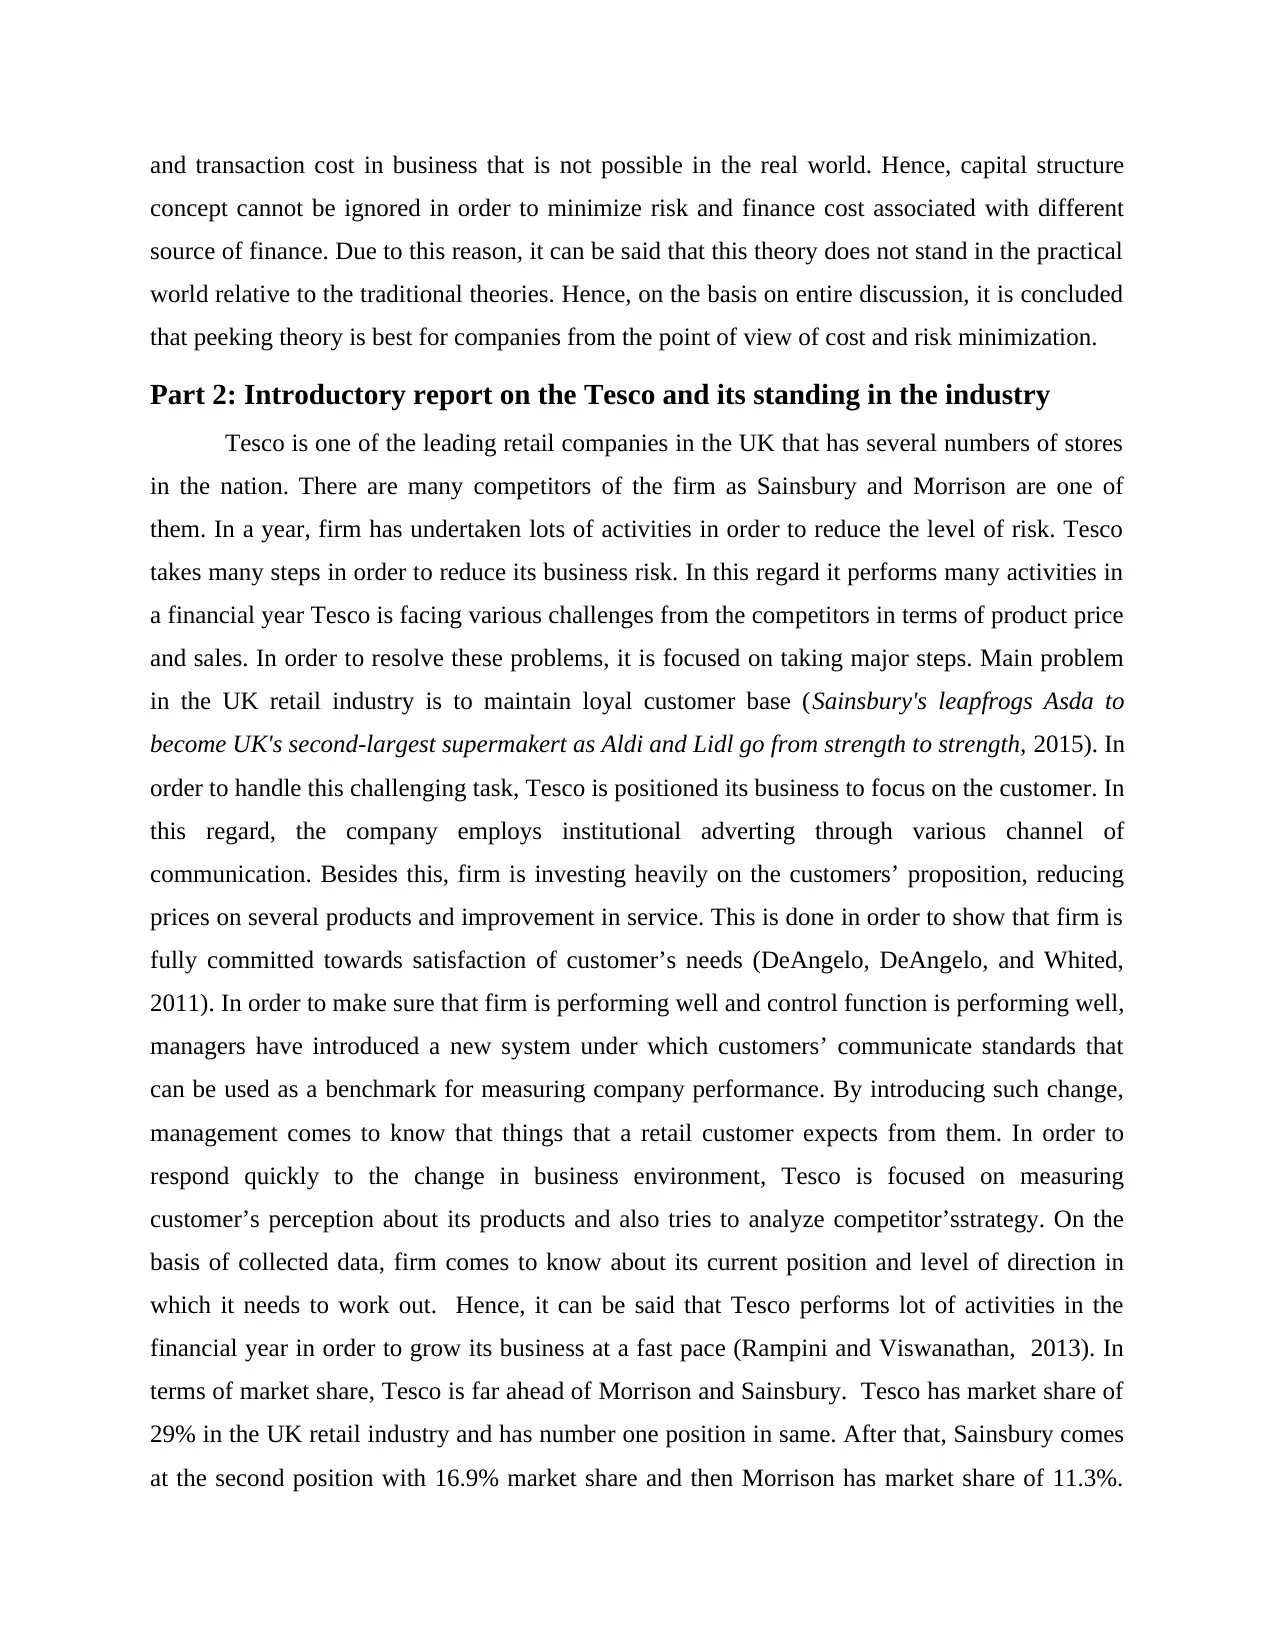
Part 2: Introductory report on the Tesco and its standing in the industry
Tesco is one of the leading retail companies in the UK that has several numbers of stores
in the nation. There are many competitors of the firm as Sainsbury and Morrison are one of
them. In a year, firm has undertaken lots of activities in order to reduce the level of risk. Tesco
takes many steps in order to reduce its business risk. In this regard it performs many activities in
a financial year Tesco is facing various challenges from the competitors in terms of product price
and sales. In order to resolve these problems, it is focused on taking major steps. Main problem
in the UK retail industry is to maintain loyal customer base (Sainsbury's leapfrogs Asda to
become UK's second-largest supermakert as Aldi and Lidl go from strength to strength, 2015). In
order to handle this challenging task, Tesco is positioned its business to focus on the customer. In
this regard, the company employs institutional adverting through various channel of
communication. Besides this, firm is investing heavily on the customers’ proposition, reducing
prices on several products and improvement in service. This is done in order to show that firm is
fully committed towards satisfaction of customer’s needs (DeAngelo, DeAngelo, and Whited,
2011). In order to make sure that firm is performing well and control function is performing well,
managers have introduced a new system under which customers’ communicate standards that
can be used as a benchmark for measuring company performance. By introducing such change,
management comes to know that things that a retail customer expects from them. In order to
respond quickly to the change in business environment, Tesco is focused on measuring
customer’s perception about its products and also tries to analyze competitor’sstrategy. On the
basis of collected data, firm comes to know about its current position and level of direction in
which it needs to work out. Hence, it can be said that Tesco performs lot of activities in the
financial year in order to grow its business at a fast pace (Rampini and Viswanathan, 2013). In
terms of market share, Tesco is far ahead of Morrison and Sainsbury. Tesco has market share of
29% in the UK retail industry and has number one position in same. After that, Sainsbury comes
at the second position with 16.9% market share and then Morrison has market share of 11.3%.
concept cannot be ignored in order to minimize risk and finance cost associated with different
source of finance. Due to this reason, it can be said that this theory does not stand in the practical
world relative to the traditional theories. Hence, on the basis on entire discussion, it is concluded
that peeking theory is best for companies from the point of view of cost and risk minimization.
Part 2: Introductory report on the Tesco and its standing in the industry
Tesco is one of the leading retail companies in the UK that has several numbers of stores
in the nation. There are many competitors of the firm as Sainsbury and Morrison are one of
them. In a year, firm has undertaken lots of activities in order to reduce the level of risk. Tesco
takes many steps in order to reduce its business risk. In this regard it performs many activities in
a financial year Tesco is facing various challenges from the competitors in terms of product price
and sales. In order to resolve these problems, it is focused on taking major steps. Main problem
in the UK retail industry is to maintain loyal customer base (Sainsbury's leapfrogs Asda to
become UK's second-largest supermakert as Aldi and Lidl go from strength to strength, 2015). In
order to handle this challenging task, Tesco is positioned its business to focus on the customer. In
this regard, the company employs institutional adverting through various channel of
communication. Besides this, firm is investing heavily on the customers’ proposition, reducing
prices on several products and improvement in service. This is done in order to show that firm is
fully committed towards satisfaction of customer’s needs (DeAngelo, DeAngelo, and Whited,
2011). In order to make sure that firm is performing well and control function is performing well,
managers have introduced a new system under which customers’ communicate standards that
can be used as a benchmark for measuring company performance. By introducing such change,
management comes to know that things that a retail customer expects from them. In order to
respond quickly to the change in business environment, Tesco is focused on measuring
customer’s perception about its products and also tries to analyze competitor’sstrategy. On the
basis of collected data, firm comes to know about its current position and level of direction in
which it needs to work out. Hence, it can be said that Tesco performs lot of activities in the
financial year in order to grow its business at a fast pace (Rampini and Viswanathan, 2013). In
terms of market share, Tesco is far ahead of Morrison and Sainsbury. Tesco has market share of
29% in the UK retail industry and has number one position in same. After that, Sainsbury comes
at the second position with 16.9% market share and then Morrison has market share of 11.3%.
⊘ This is a preview!⊘
Do you want full access?
Subscribe today to unlock all pages.
Trusted by 1+ million students worldwide
Thus, on the basis of figures, it can be said that Tesco is giving stiff competition to its
competitors and has good position in the market as compare to its competitors. In terms of
market share, Sainsbury and Morriosn do not stand anywhere in front of Tesco. Hence, it can be
said, Tesco is performing well than its competitors.
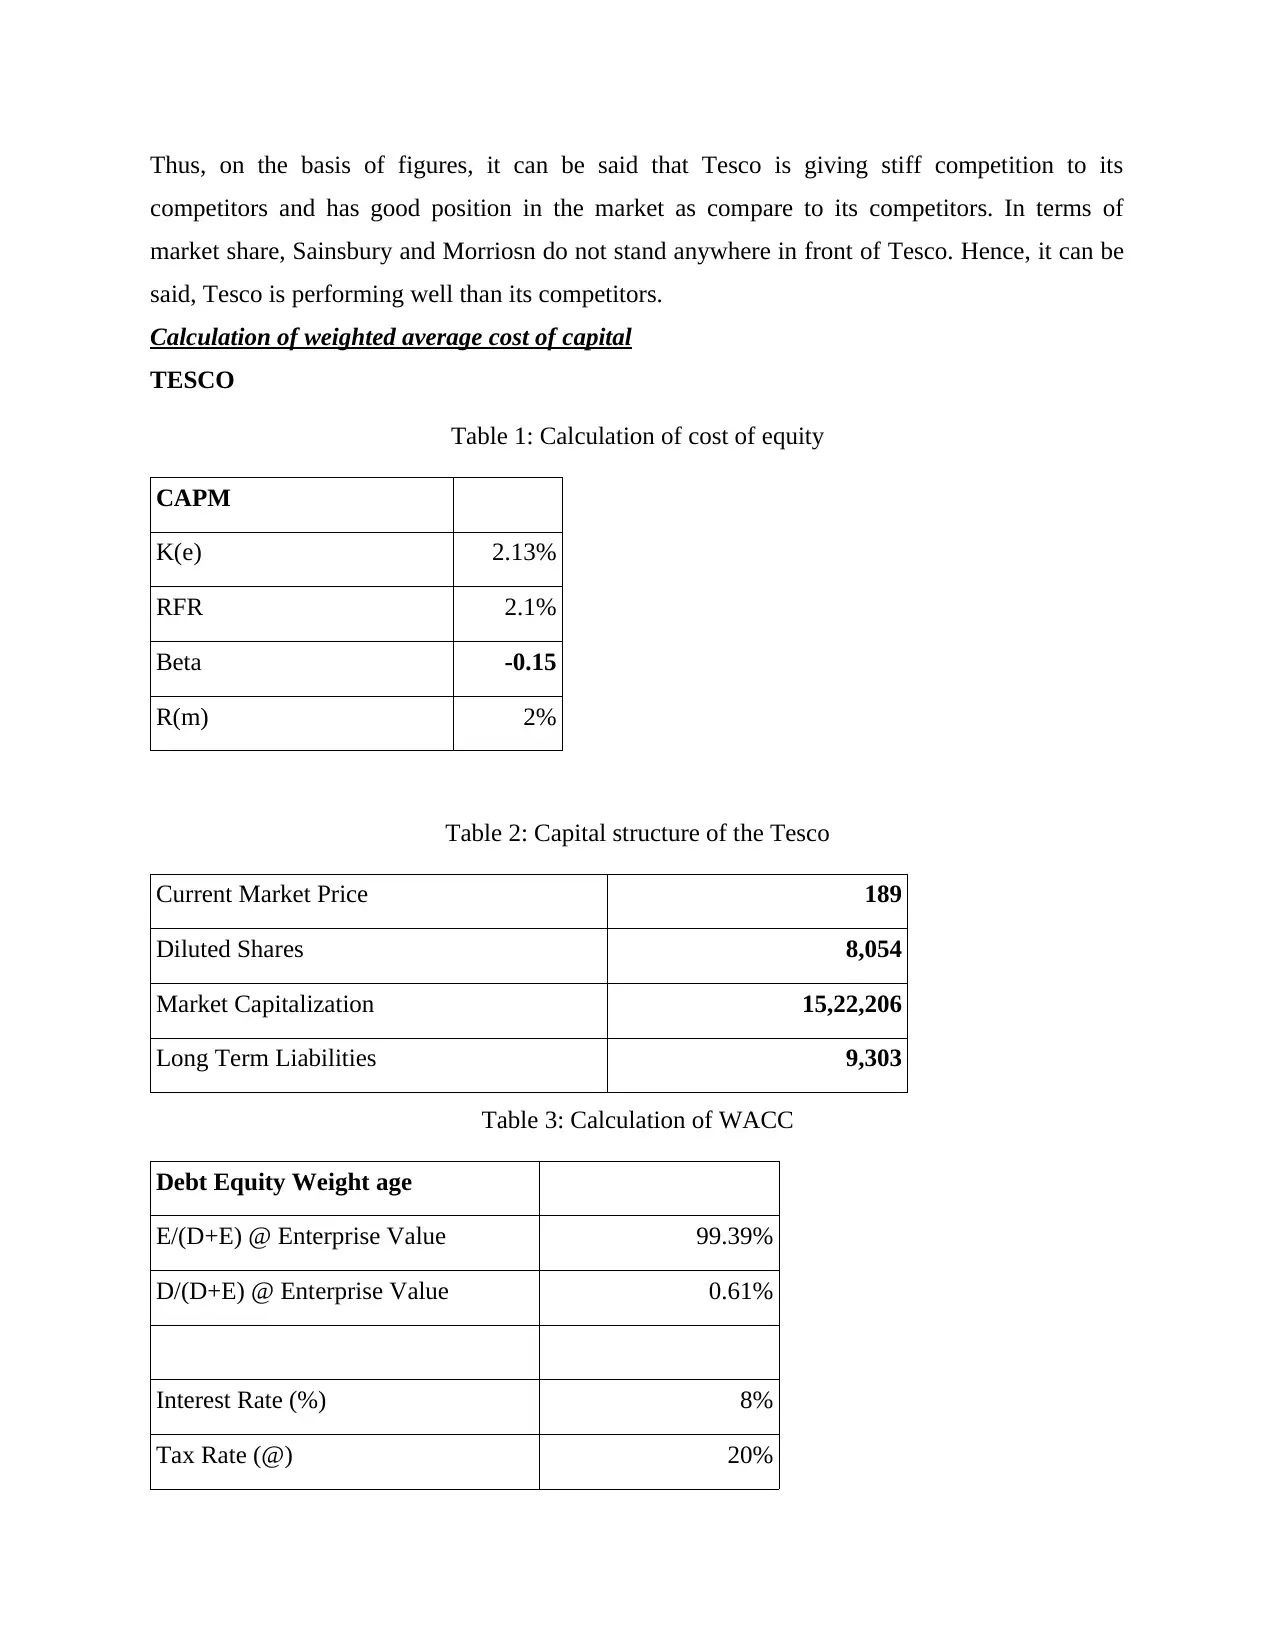
Calculation of weighted average cost of capital
TESCO
Table 1: Calculation of cost of equity
CAPM
K(e) 2.13%
RFR 2.1%
Beta -0.15
R(m) 2%
Table 2: Capital structure of the Tesco
Current Market Price 189
Diluted Shares 8,054
Market Capitalization 15,22,206
Long Term Liabilities 9,303
Table 3: Calculation of WACC
Debt Equity Weight age
E/(D+E) @ Enterprise Value 99.39%
D/(D+E) @ Enterprise Value 0.61%
Interest Rate (%) 8%
Tax Rate (@) 20%
competitors and has good position in the market as compare to its competitors. In terms of
market share, Sainsbury and Morriosn do not stand anywhere in front of Tesco. Hence, it can be
said, Tesco is performing well than its competitors.
Calculation of weighted average cost of capital
TESCO
Table 1: Calculation of cost of equity
CAPM
K(e) 2.13%
RFR 2.1%
Beta -0.15
R(m) 2%
Table 2: Capital structure of the Tesco
Current Market Price 189
Diluted Shares 8,054
Market Capitalization 15,22,206
Long Term Liabilities 9,303
Table 3: Calculation of WACC
Debt Equity Weight age
E/(D+E) @ Enterprise Value 99.39%
D/(D+E) @ Enterprise Value 0.61%
Interest Rate (%) 8%
Tax Rate (@) 20%
Paraphrase This Document
Need a fresh take? Get an instant paraphrase of this document with our AI Paraphraser
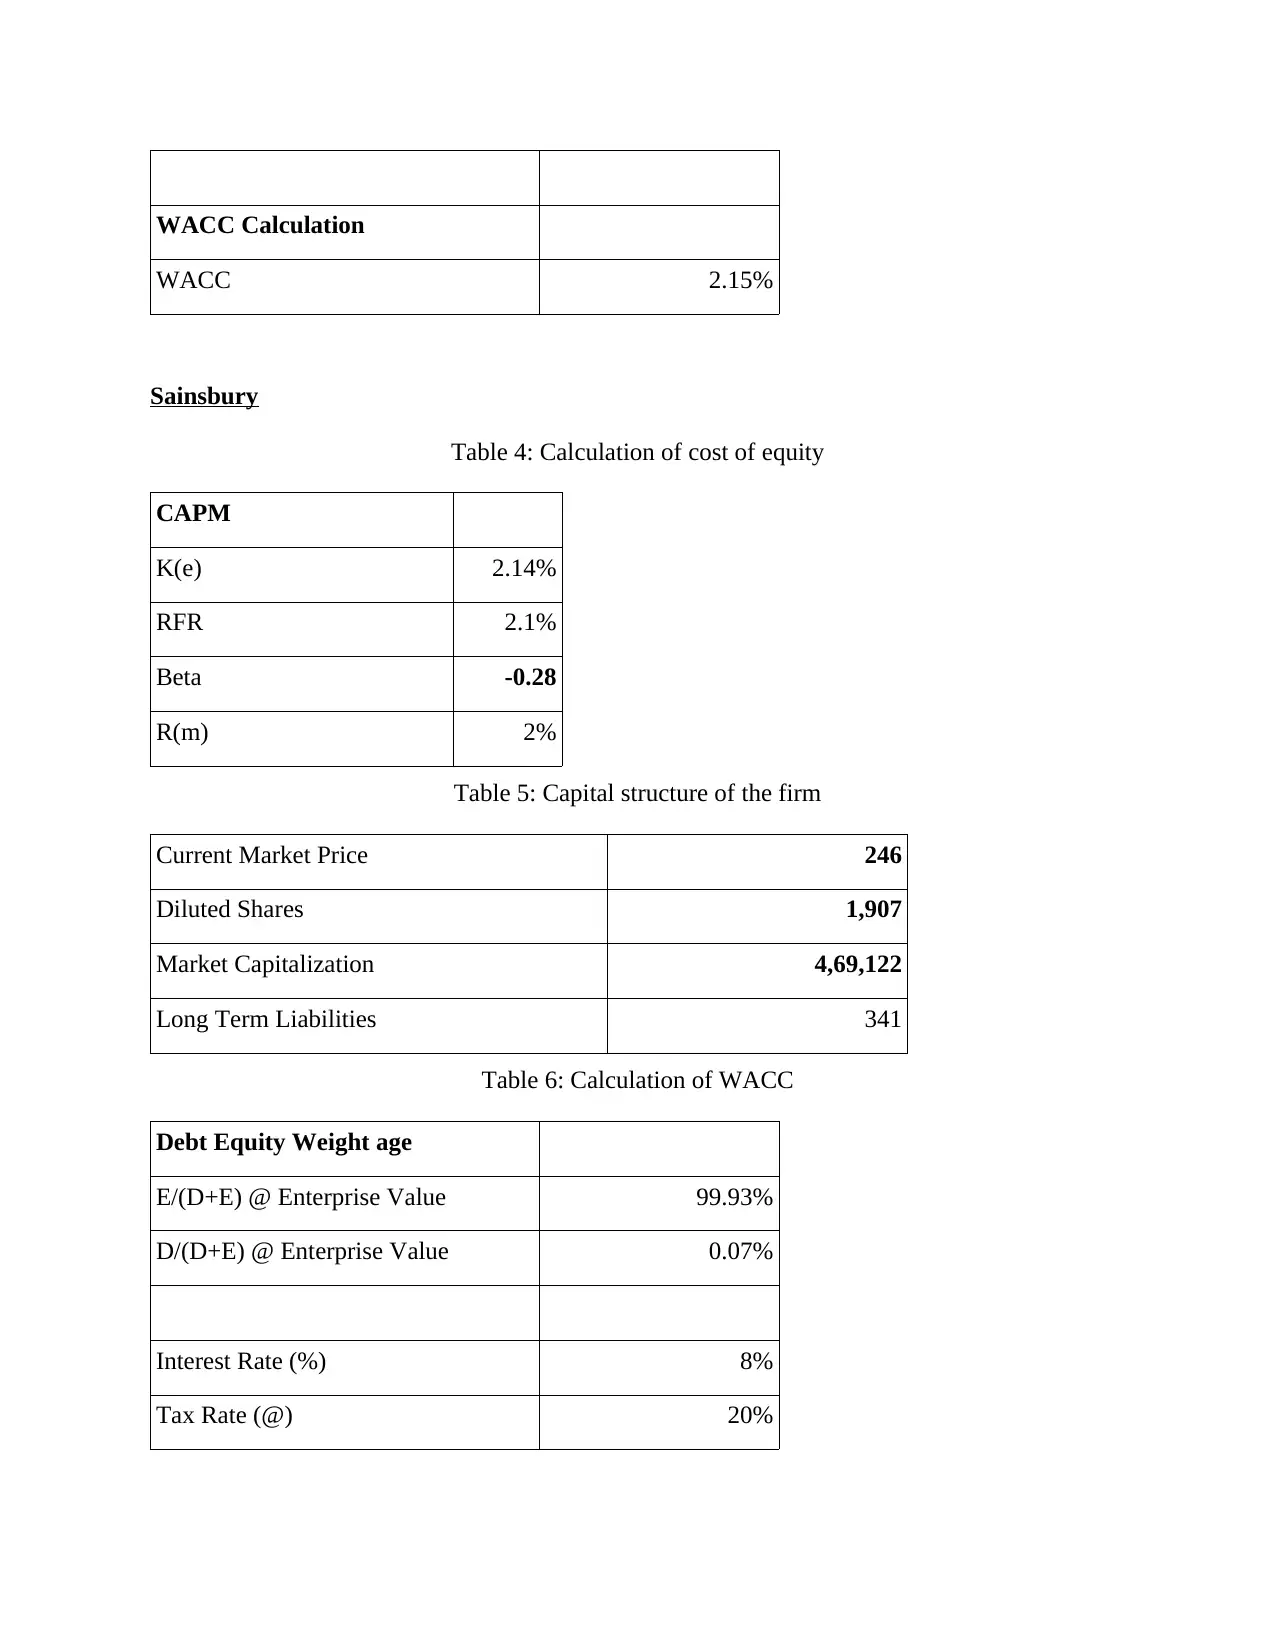
WACC Calculation
WACC 2.15%
Sainsbury
Table 4: Calculation of cost of equity
CAPM
K(e) 2.14%
RFR 2.1%
Beta -0.28
R(m) 2%
Table 5: Capital structure of the firm
Current Market Price 246
Diluted Shares 1,907
Market Capitalization 4,69,122
Long Term Liabilities 341
Table 6: Calculation of WACC
Debt Equity Weight age
E/(D+E) @ Enterprise Value 99.93%
D/(D+E) @ Enterprise Value 0.07%
Interest Rate (%) 8%
Tax Rate (@) 20%
WACC Calculation
WACC 2.14%
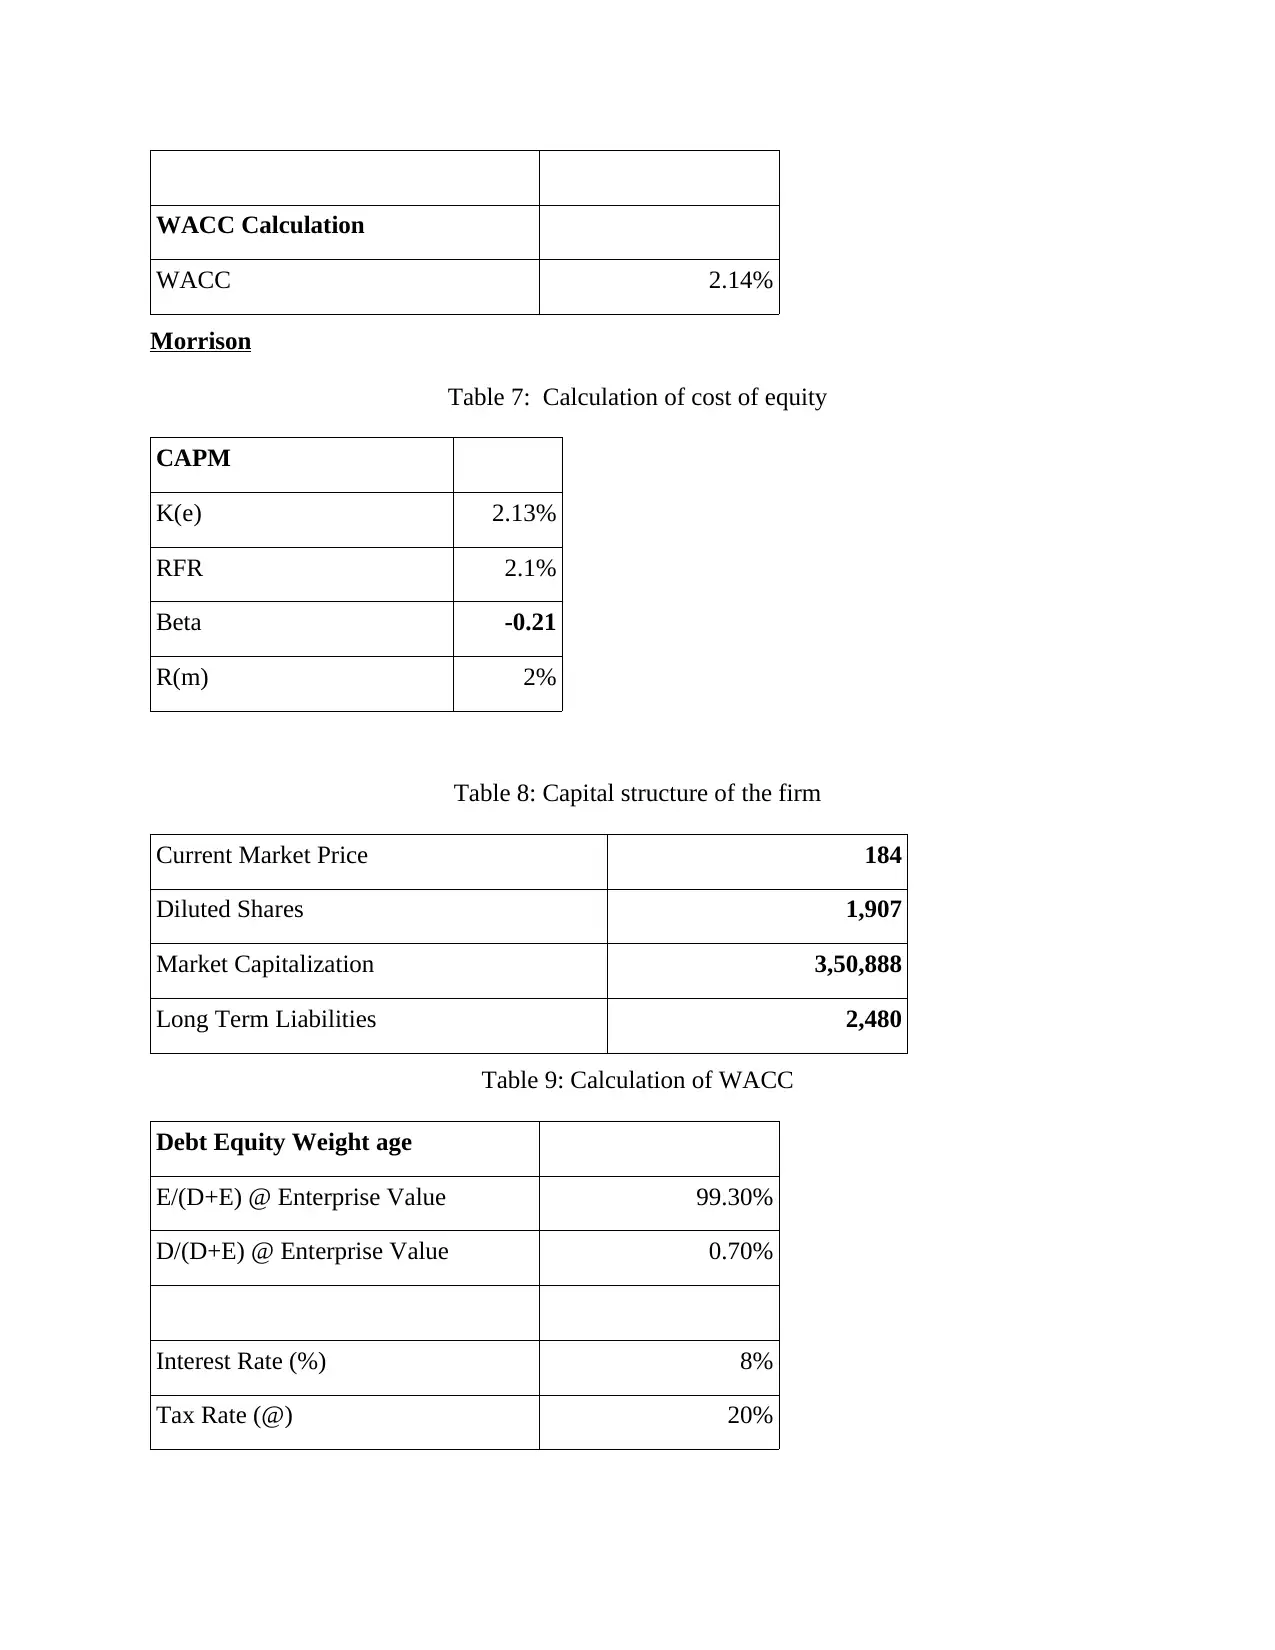
Morrison
Table 7: Calculation of cost of equity
CAPM
K(e) 2.13%
RFR 2.1%
Beta -0.21
R(m) 2%
Table 8: Capital structure of the firm
Current Market Price 184
Diluted Shares 1,907
Market Capitalization 3,50,888
Long Term Liabilities 2,480
Table 9: Calculation of WACC
Debt Equity Weight age
E/(D+E) @ Enterprise Value 99.30%
D/(D+E) @ Enterprise Value 0.70%
Interest Rate (%) 8%
Tax Rate (@) 20%
WACC 2.14%
Morrison
Table 7: Calculation of cost of equity
CAPM
K(e) 2.13%
RFR 2.1%
Beta -0.21
R(m) 2%
Table 8: Capital structure of the firm
Current Market Price 184
Diluted Shares 1,907
Market Capitalization 3,50,888
Long Term Liabilities 2,480
Table 9: Calculation of WACC
Debt Equity Weight age
E/(D+E) @ Enterprise Value 99.30%
D/(D+E) @ Enterprise Value 0.70%
Interest Rate (%) 8%
Tax Rate (@) 20%
⊘ This is a preview!⊘
Do you want full access?
Subscribe today to unlock all pages.
Trusted by 1+ million students worldwide
WACC Calculation
WACC 2.16%
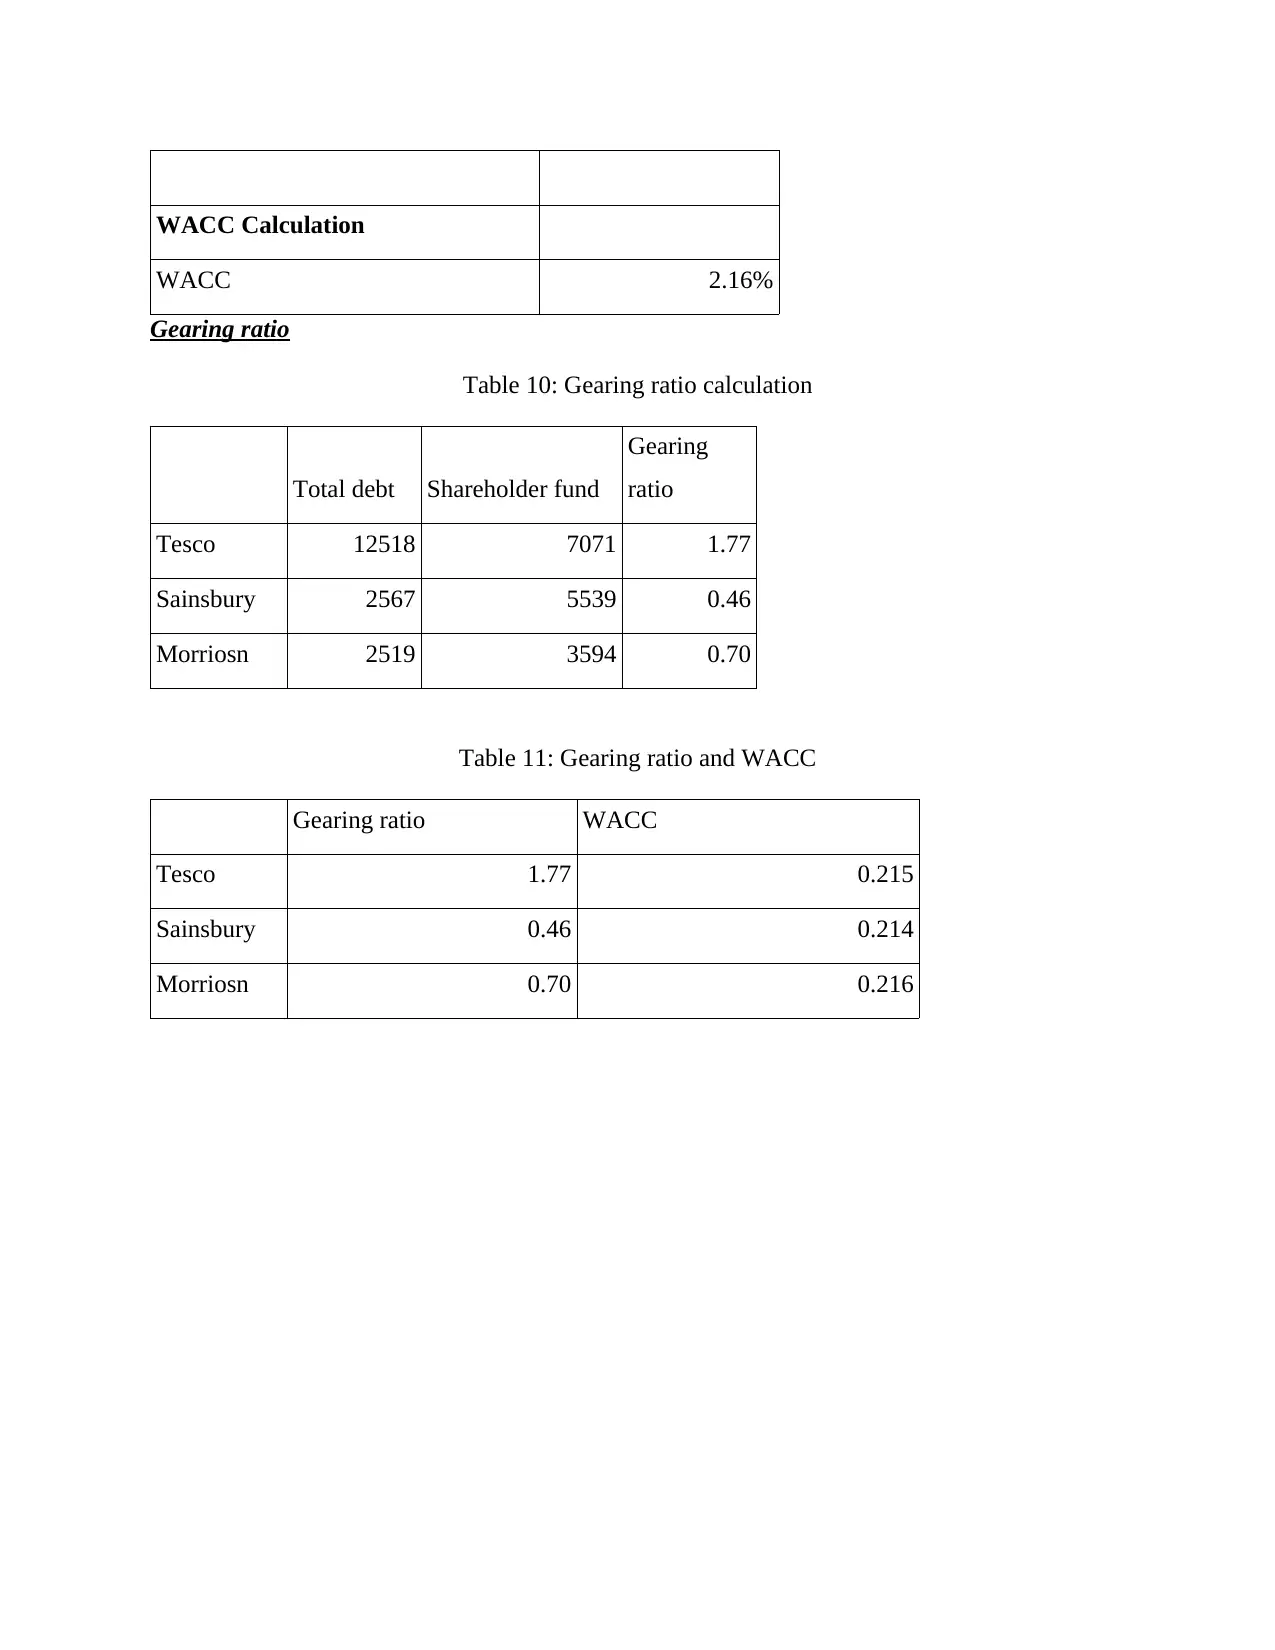
Gearing ratio
Table 10: Gearing ratio calculation
Total debt Shareholder fund
Gearing
ratio
Tesco 12518 7071 1.77
Sainsbury 2567 5539 0.46
Morriosn 2519 3594 0.70
Table 11: Gearing ratio and WACC
Gearing ratio WACC
Tesco 1.77 0.215
Sainsbury 0.46 0.214
Morriosn 0.70 0.216
WACC 2.16%
Gearing ratio
Table 10: Gearing ratio calculation
Total debt Shareholder fund
Gearing
ratio
Tesco 12518 7071 1.77
Sainsbury 2567 5539 0.46
Morriosn 2519 3594 0.70
Table 11: Gearing ratio and WACC
Gearing ratio WACC
Tesco 1.77 0.215
Sainsbury 0.46 0.214
Morriosn 0.70 0.216
Paraphrase This Document
Need a fresh take? Get an instant paraphrase of this document with our AI Paraphraser
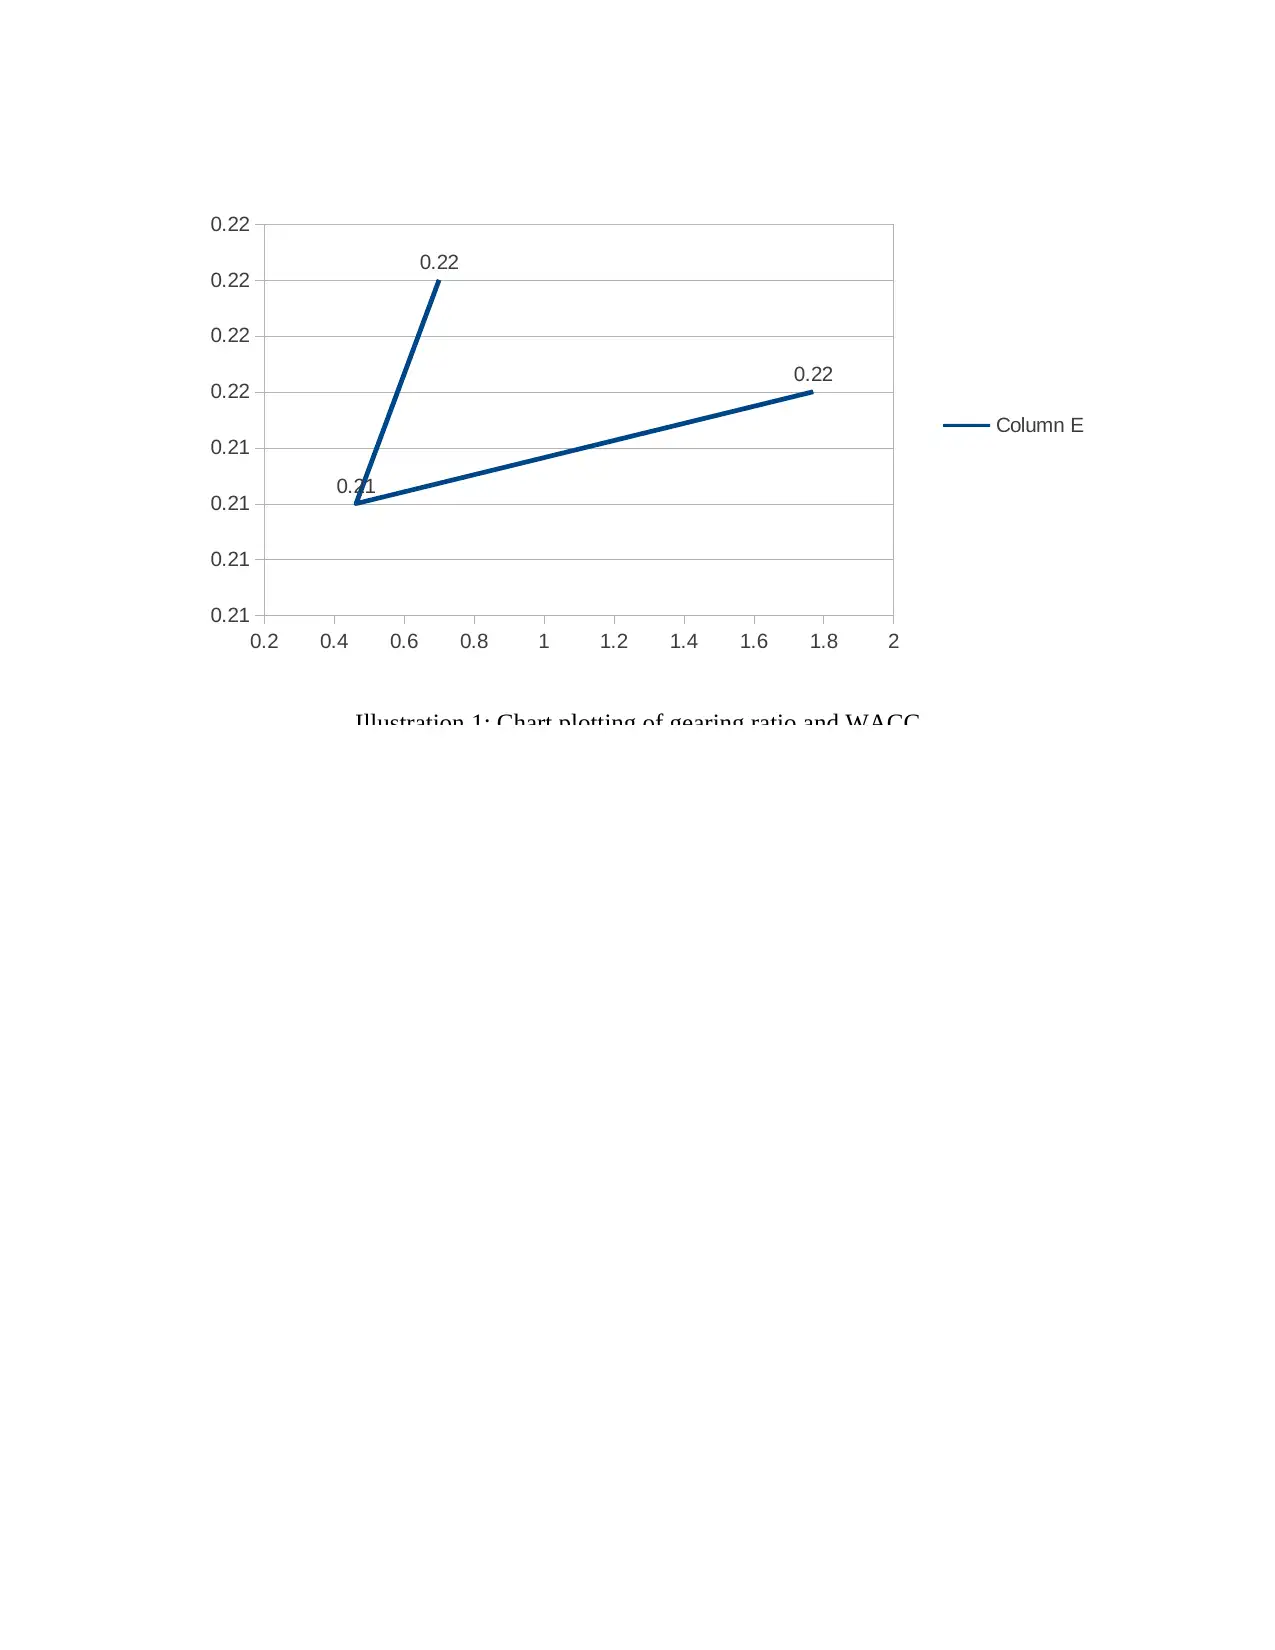
0.2 0.4 0.6 0.8 1 1.2 1.4 1.6 1.8 2
0.21
0.21
0.21
0.21
0.22
0.22
0.22
0.22
0.22
0.21
0.22
Column E
Illustration 1: Chart plotting of gearing ratio and WACC
0.21
0.21
0.21
0.21
0.22
0.22
0.22
0.22
0.22
0.21
0.22
Column E
Illustration 1: Chart plotting of gearing ratio and WACC
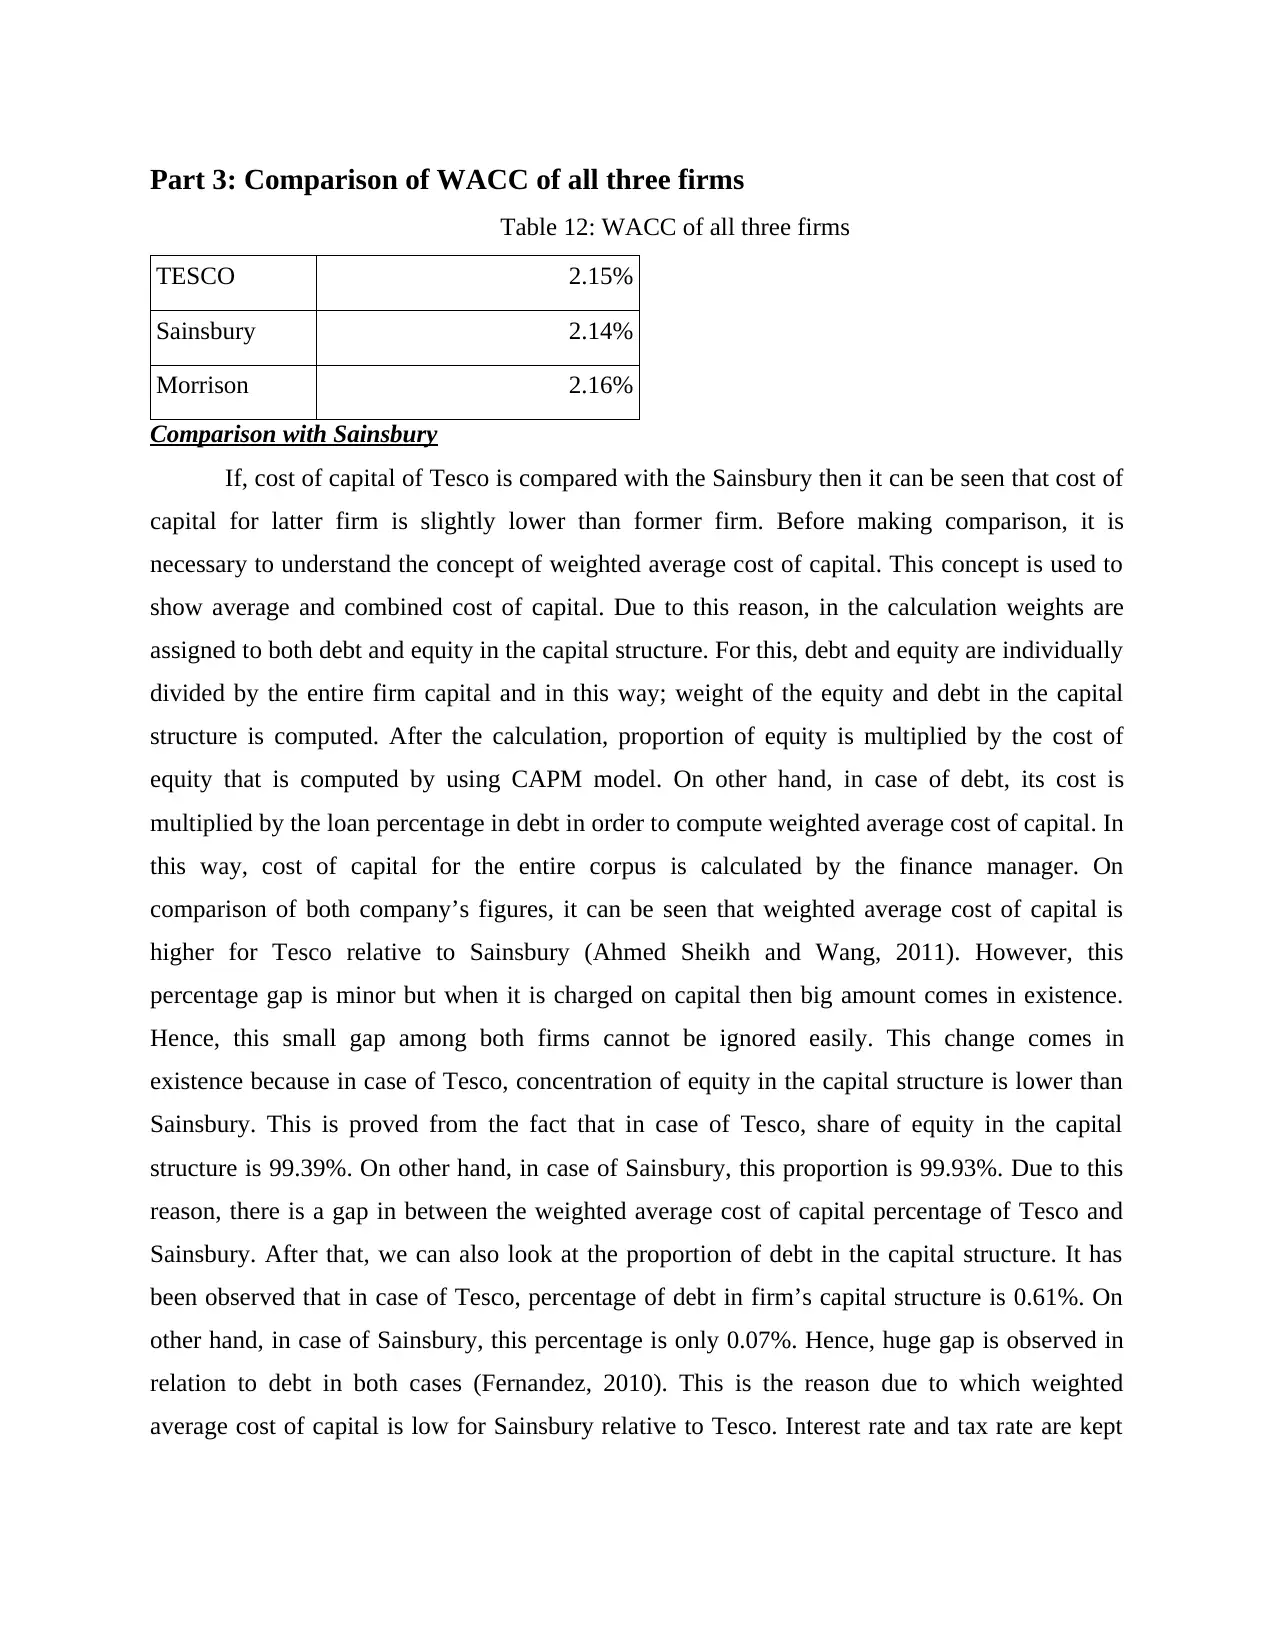
Part 3: Comparison of WACC of all three firms
Table 12: WACC of all three firms
TESCO 2.15%
Sainsbury 2.14%
Morrison 2.16%
Comparison with Sainsbury
If, cost of capital of Tesco is compared with the Sainsbury then it can be seen that cost of
capital for latter firm is slightly lower than former firm. Before making comparison, it is
necessary to understand the concept of weighted average cost of capital. This concept is used to
show average and combined cost of capital. Due to this reason, in the calculation weights are
assigned to both debt and equity in the capital structure. For this, debt and equity are individually
divided by the entire firm capital and in this way; weight of the equity and debt in the capital
structure is computed. After the calculation, proportion of equity is multiplied by the cost of
equity that is computed by using CAPM model. On other hand, in case of debt, its cost is
multiplied by the loan percentage in debt in order to compute weighted average cost of capital. In
this way, cost of capital for the entire corpus is calculated by the finance manager. On
comparison of both company’s figures, it can be seen that weighted average cost of capital is
higher for Tesco relative to Sainsbury (Ahmed Sheikh and Wang, 2011). However, this
percentage gap is minor but when it is charged on capital then big amount comes in existence.
Hence, this small gap among both firms cannot be ignored easily. This change comes in
existence because in case of Tesco, concentration of equity in the capital structure is lower than
Sainsbury. This is proved from the fact that in case of Tesco, share of equity in the capital
structure is 99.39%. On other hand, in case of Sainsbury, this proportion is 99.93%. Due to this
reason, there is a gap in between the weighted average cost of capital percentage of Tesco and
Sainsbury. After that, we can also look at the proportion of debt in the capital structure. It has
been observed that in case of Tesco, percentage of debt in firm’s capital structure is 0.61%. On
other hand, in case of Sainsbury, this percentage is only 0.07%. Hence, huge gap is observed in
relation to debt in both cases (Fernandez, 2010). This is the reason due to which weighted
average cost of capital is low for Sainsbury relative to Tesco. Interest rate and tax rate are kept
⊘ This is a preview!⊘
Do you want full access?
Subscribe today to unlock all pages.
Trusted by 1+ million students worldwide
1 out of 17
Related Documents


Your All-in-One AI-Powered Toolkit for Academic Success.
+13062052269
info@desklib.com
Available 24*7 on WhatsApp / Email
![[object Object]](/_next/static/media/star-bottom.7253800d.svg)
Unlock your academic potential
Copyright © 2020–2026 A2Z Services. All Rights Reserved. Developed and managed by ZUCOL.