Business Economics Report: Analyzing Demand and Supply for Tesco Plc

Verified

Added on  2023/01/13

|9
|1744
|57
Report
AI Summary
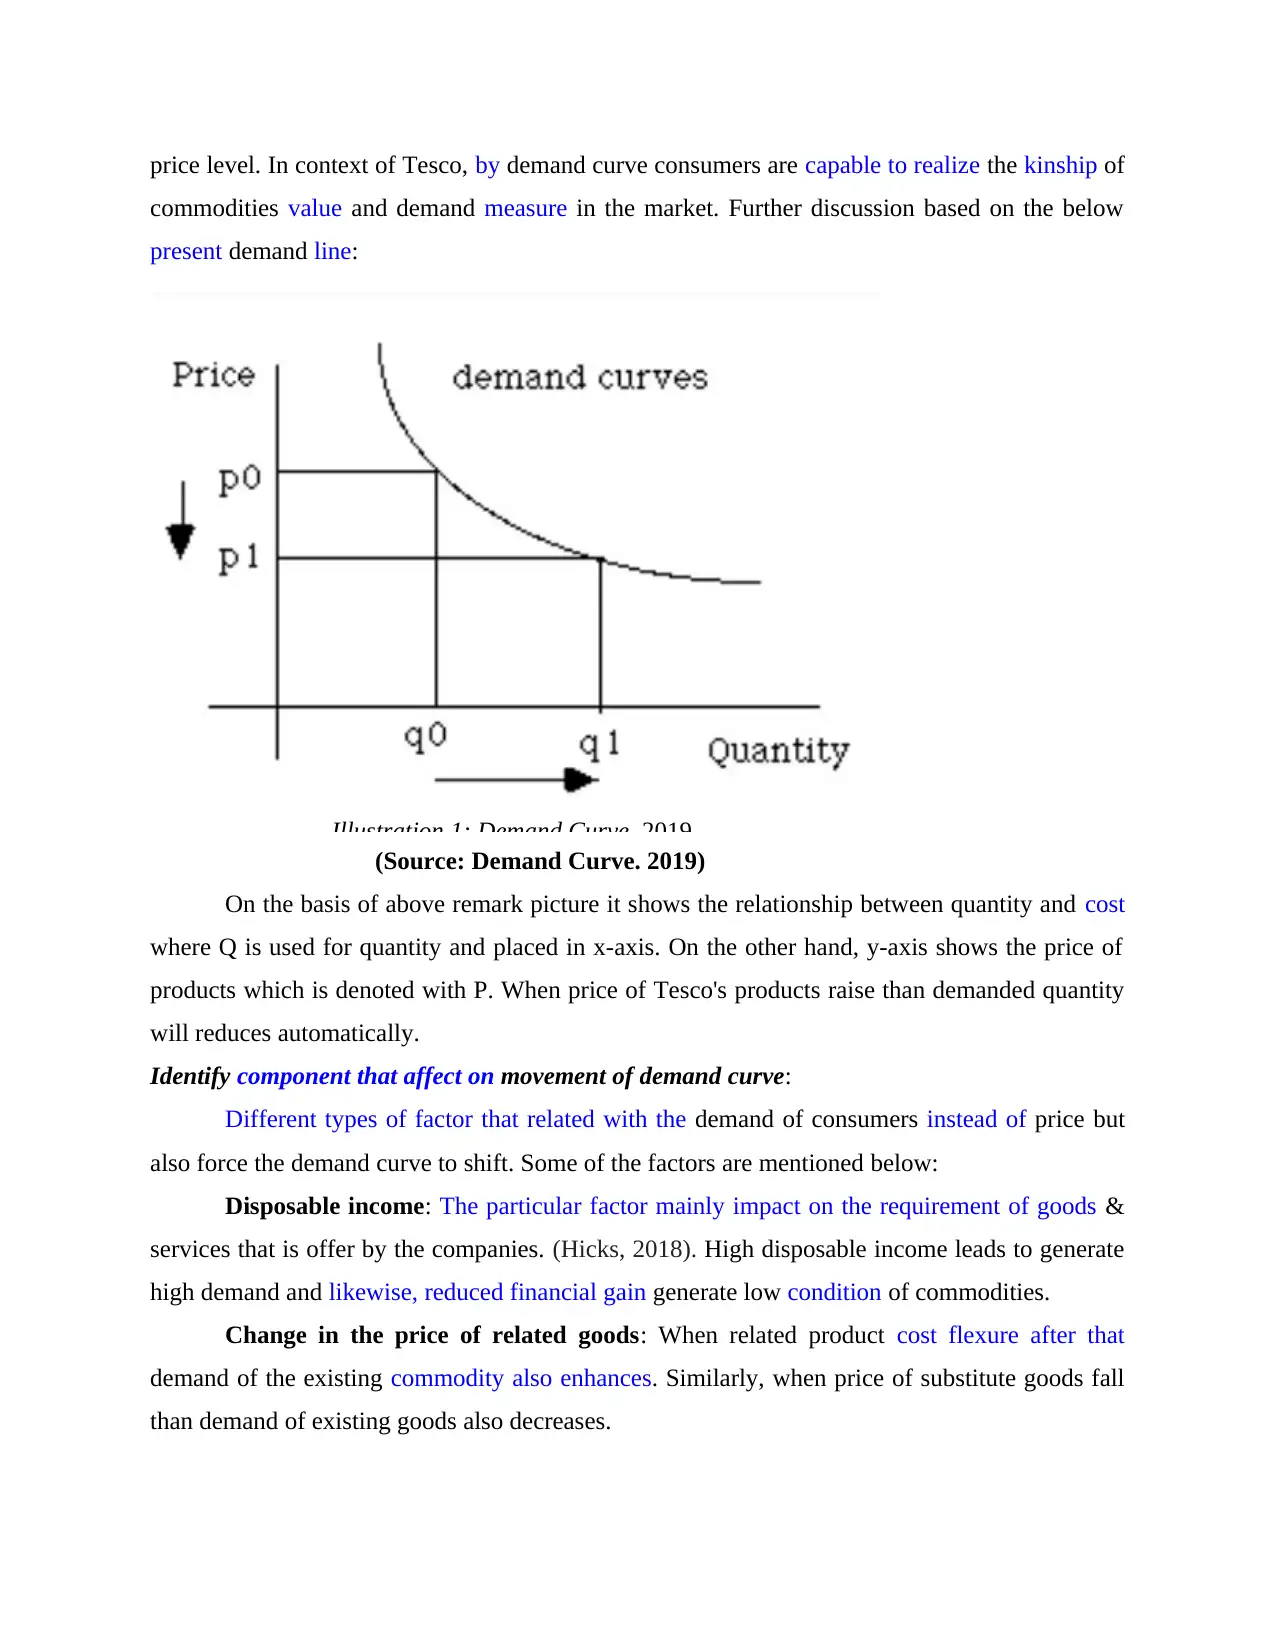
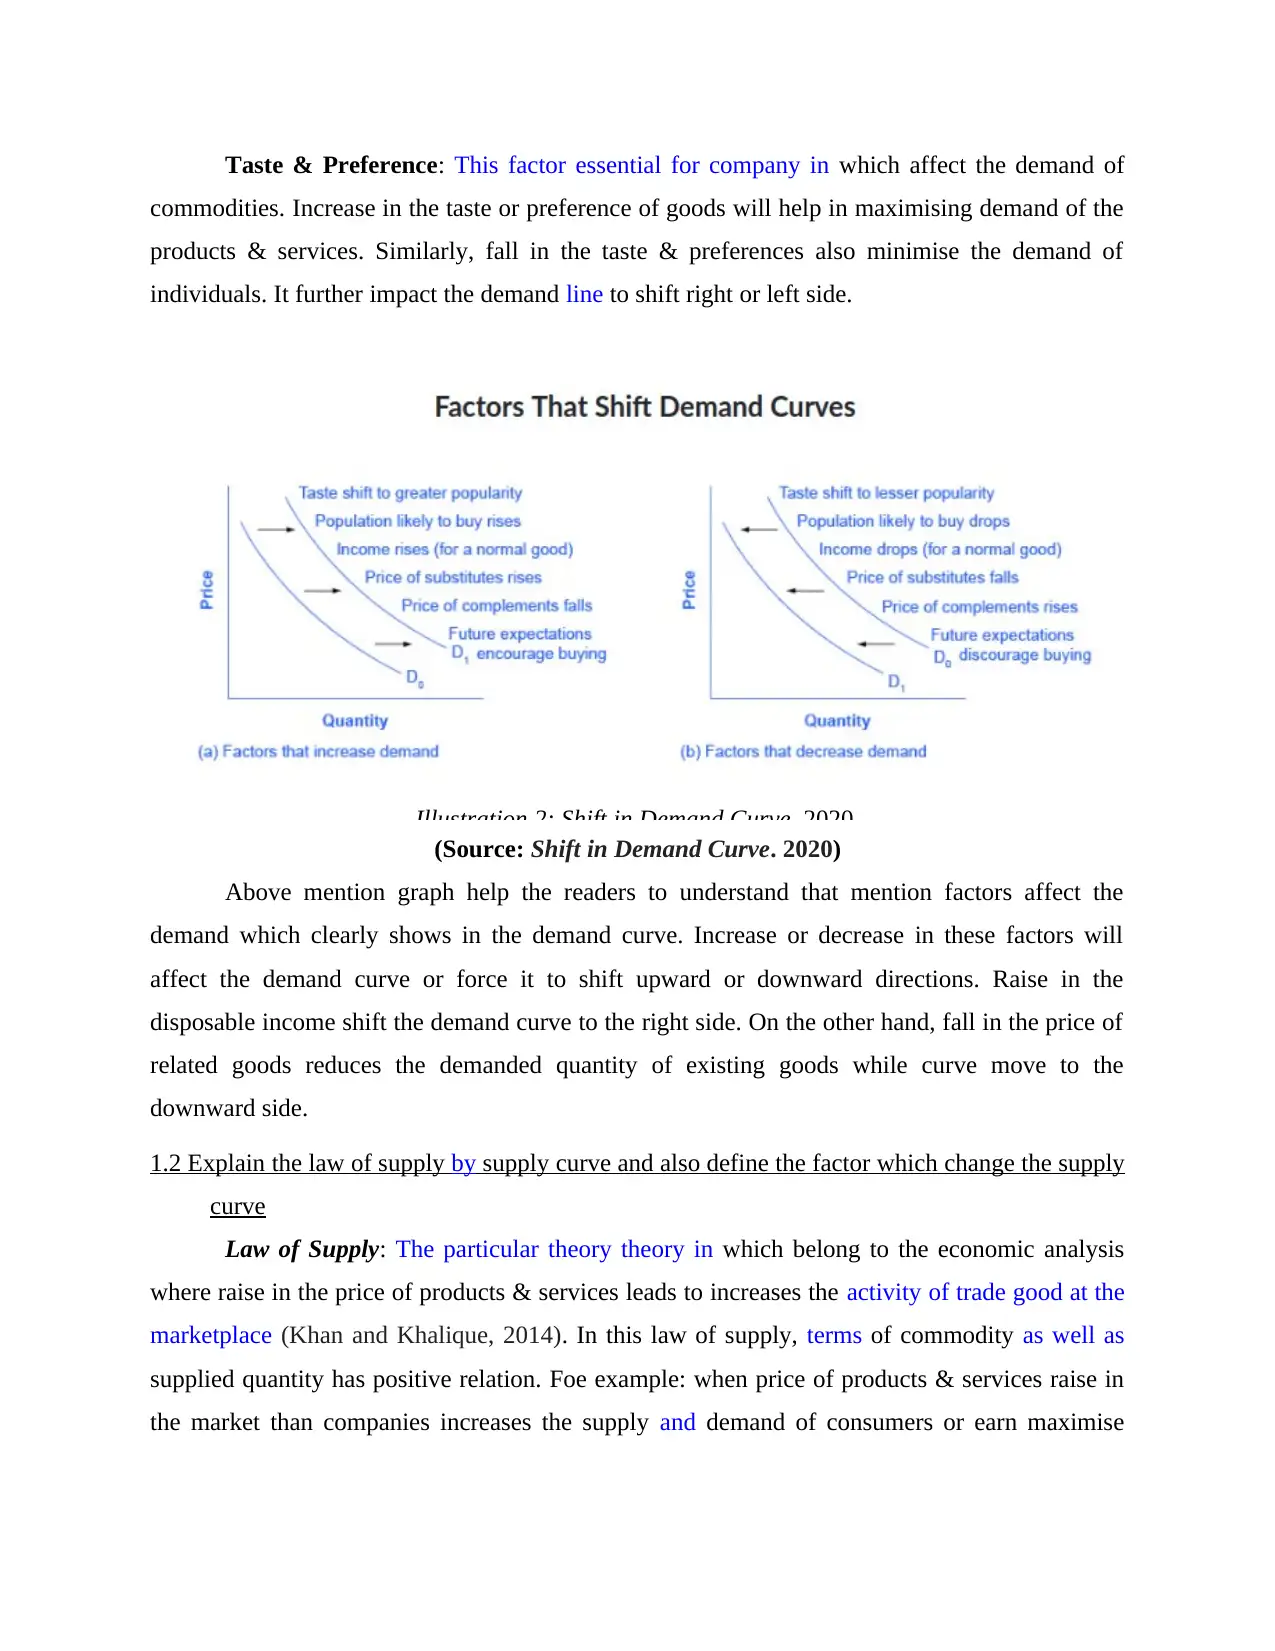
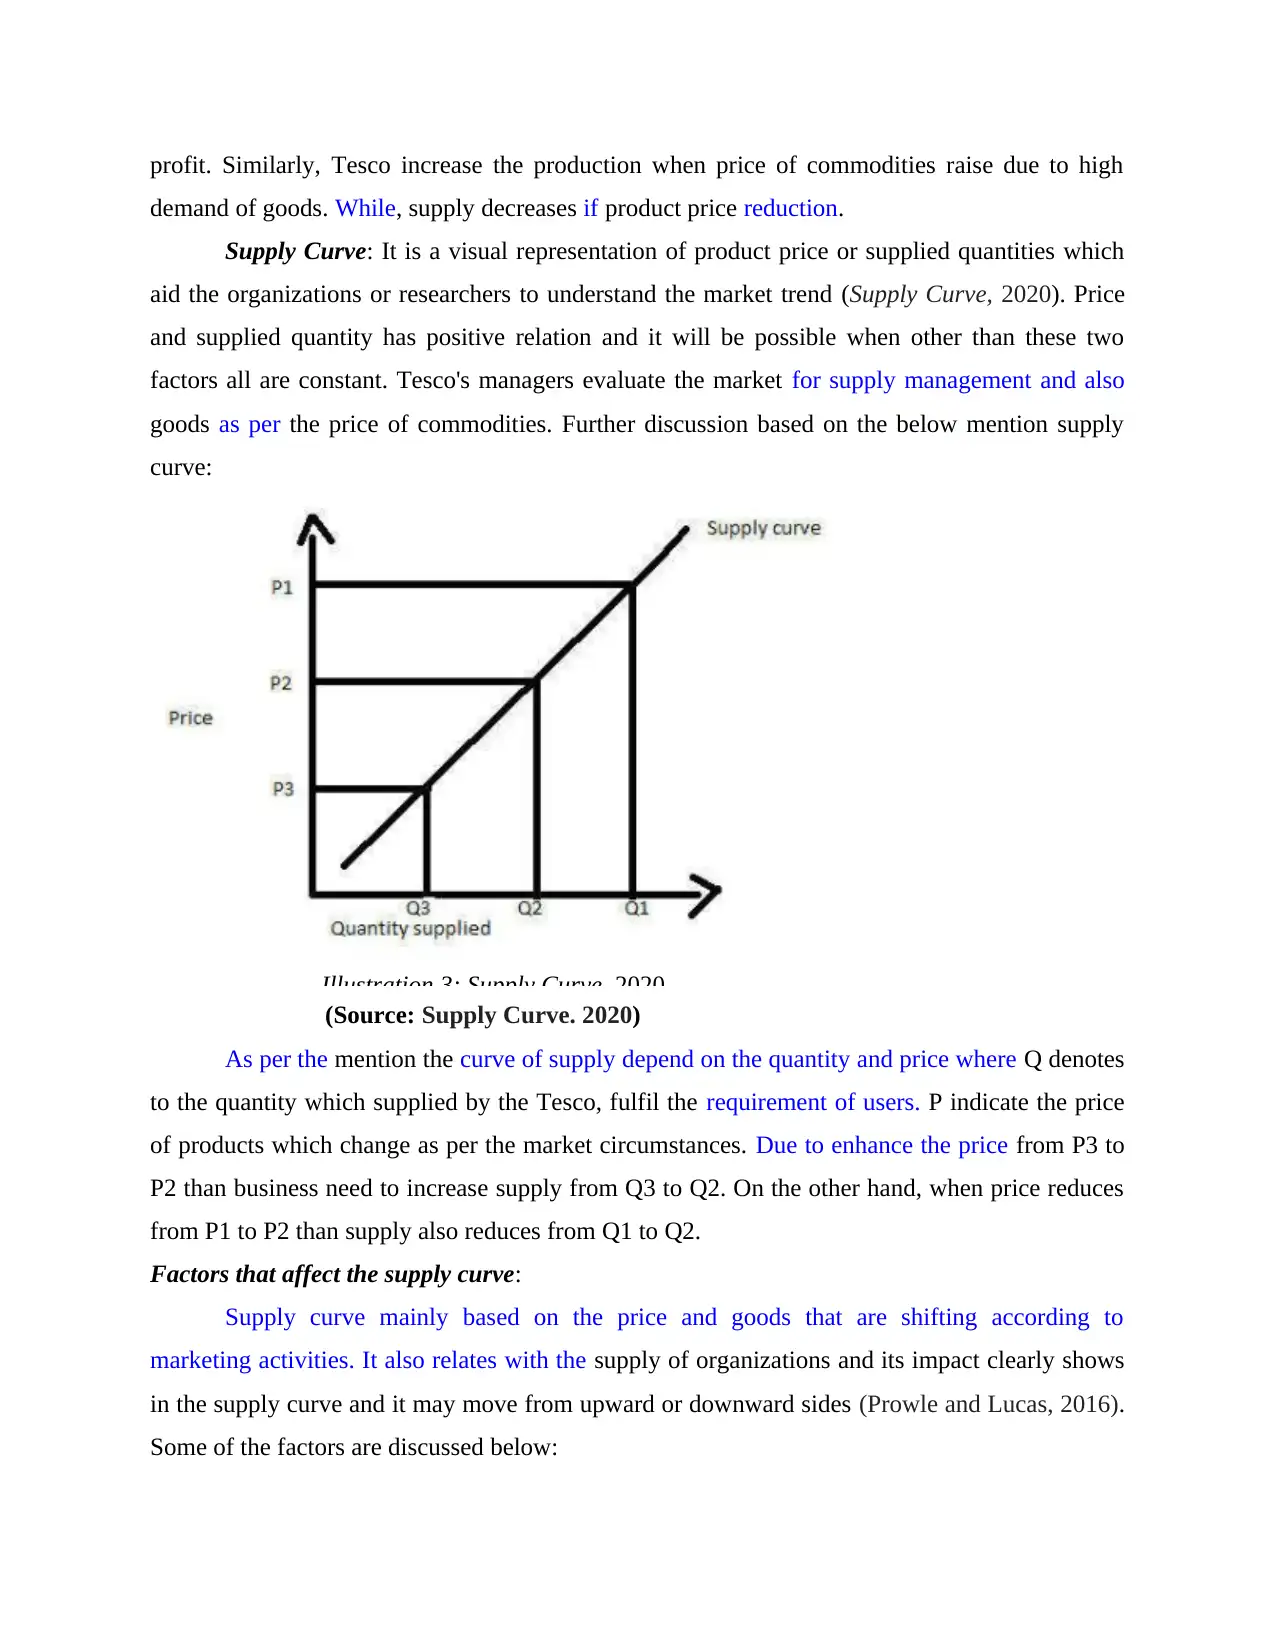
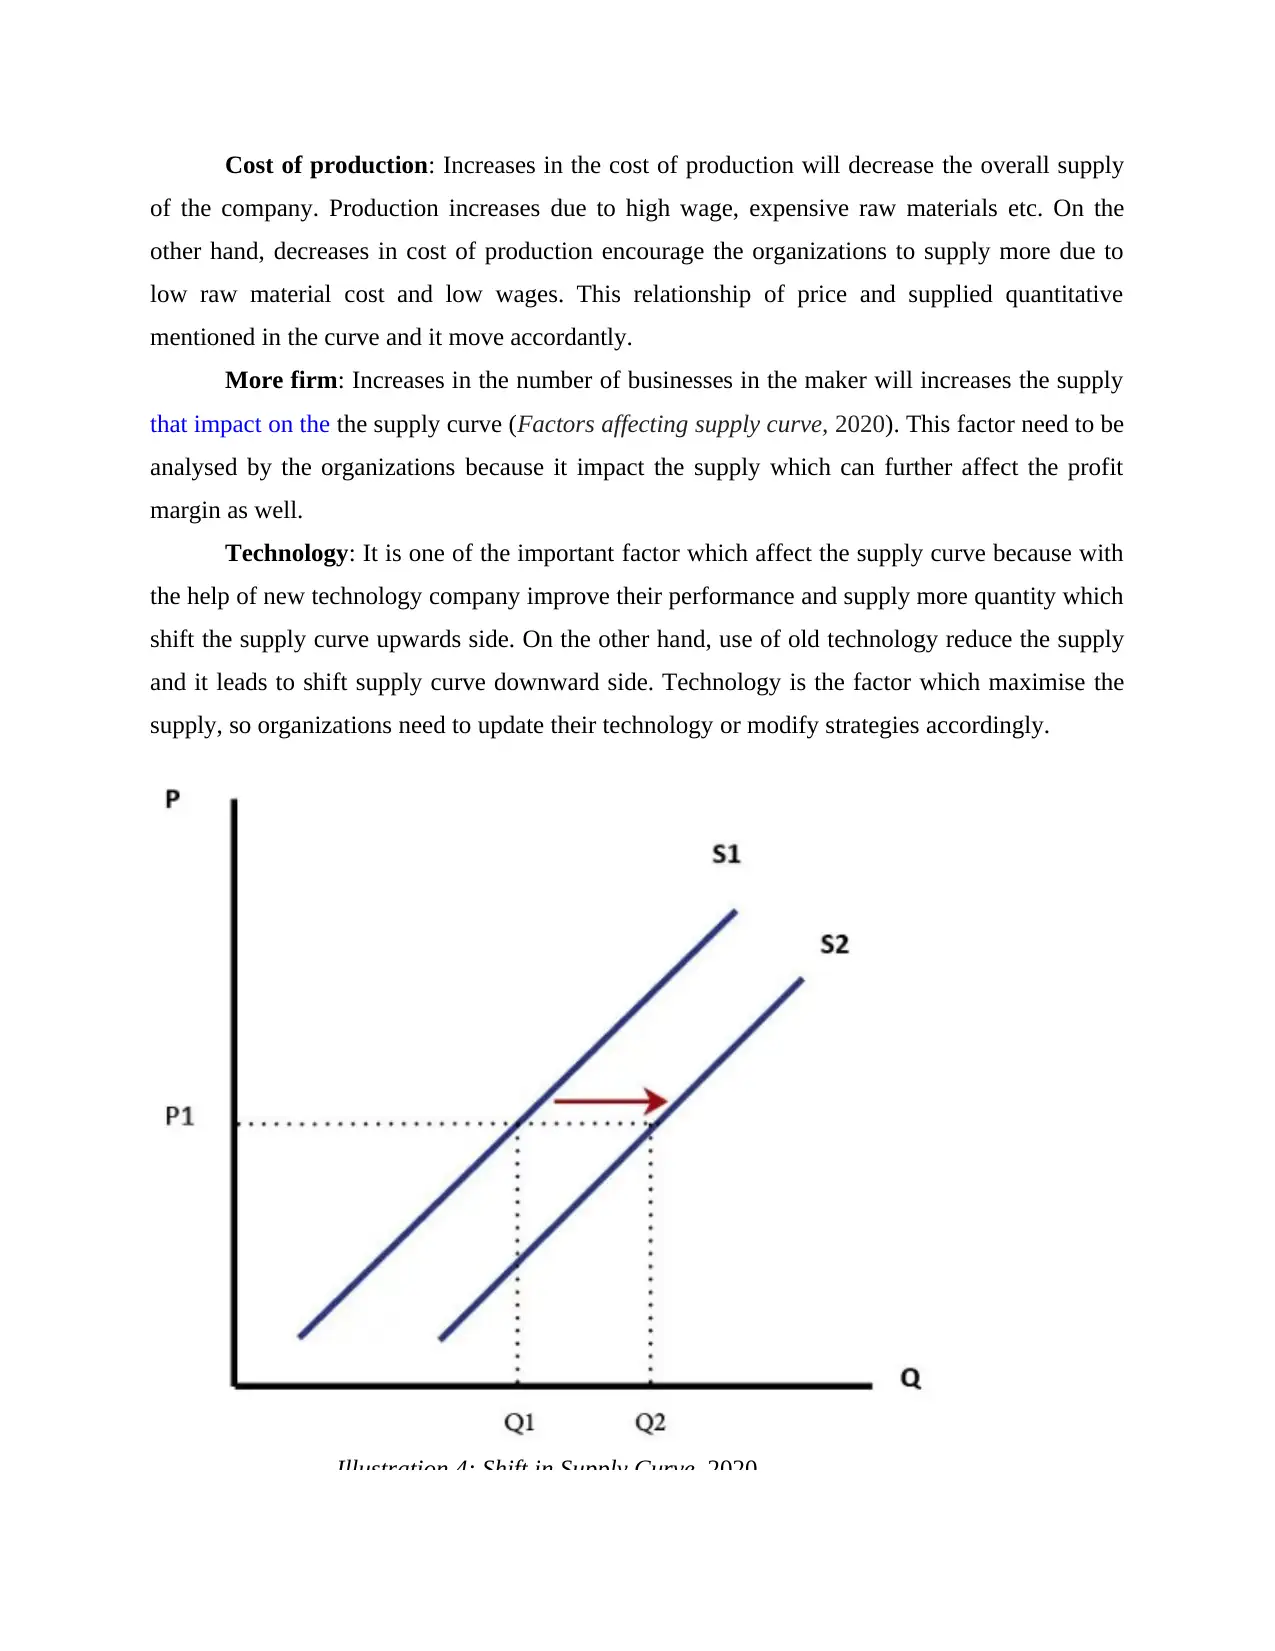
This report provides an analysis of contemporary business economics, focusing on the application of demand and supply theories to Tesco Plc, a UK-based retail company. The report begins by explaining the law of demand, its inverse relationship between price and quantity demanded, and the factors that shift the demand curve, such as disposable income, prices of related goods, and taste preferences. It then examines the law of supply, its positive relationship between price and quantity supplied, and factors influencing the supply curve, including production costs, the number of firms, and technology. The report utilizes demand and supply curves to visually represent these relationships and discusses how Tesco's management can use these economic principles for effective market analysis and strategic decision-making. Finally, the report concludes by emphasizing the importance of market analysis based on demand and supply theories for understanding market trends and meeting consumer expectations. The report provides a comprehensive overview of how these economic principles apply to a real-world business context.
Document Page
Contemporary
Business Economics
tabler-icon-diamond-filled.svg

Secure Best Marks with AI Grader

Need help grading? Try our AI Grader for instant feedback on your assignments.
Document Page
Document Page
INTRODUCTION
Contemporary business economics include the various issues which affect the business
operations and further affect the demand of goods & services which organizations offer. Due to
economic issues, businesses struggle the most that also affect the productivity as well as
profitability (Amankwah-Amoah and Wang, 2019). For the better understanding of demand or
supply concept, this project report select the Tesco Plc which is UK based retail company. This
report based on the economic theories such as law of demand or supply of demand. Relation
between the price or quantity represent with the help of demand curve and which factors affect
the most to shift the entire curve. On the other hand, this report discussed about the law of
supply, supply curve and identify factors which affect the supply curve. With the help of demand
and supply theory, individuals as well as researchers able to understand that how market
response and what are the factors rather price which influence the demand of consumers and well
as supply of organizations.
MAIN BODY
TASK 1
1.1 Explain the law of demand along with demand curve and the factors which impact the
demand curve to change
Law of Demand: It is one of the fundamental factor of economy which help the
organizations to understand the demand of their products. This law shows the relations between
price of product and the demanded quantity. Price and quantity of goods has inverse relationship
because when price increases than demand of goods reduces. Therefore, fall in the price will
maximise the demand (Coad, 2014). It is the natural human behaviour which consumers follow
at the time of taking buying decisions. In context of organizations, when price of Tesco's
products raise than demand will fall and similarly when price reduces than demand will increase.
Research & development team of Tesco need to understand this economic theory and take
further actions or strategies accordingly.
Demand Curve: It is an visual representation which help the individual to understand the
how many units of commodities will be purchased at possible price. Demand curve represent the
relation among demanded quantity and price of goods & services (Demand Curve, 2019). It is
the table which indicate that how many products or service individual can acquire at different
Document Page
price level. In context of Tesco, by demand curve consumers are capable to realize the kinship of
commodities value and demand measure in the market. Further discussion based on the below
present demand line:
Illustration 1: Demand Curve, 2019.
(Source: Demand Curve. 2019)
On the basis of above remark picture it shows the relationship between quantity and cost
where Q is used for quantity and placed in x-axis. On the other hand, y-axis shows the price of
products which is denoted with P. When price of Tesco's products raise than demanded quantity
will reduces automatically.
Identify component that affect on movement of demand curve:
Different types of factor that related with the demand of consumers instead of price but
also force the demand curve to shift. Some of the factors are mentioned below:
Disposable income: The particular factor mainly impact on the requirement of goods &
services that is offer by the companies. (Hicks, 2018). High disposable income leads to generate
high demand and likewise, reduced financial gain generate low condition of commodities.
Change in the price of related goods: When related product cost flexure after that
demand of the existing commodity also enhances. Similarly, when price of substitute goods fall
than demand of existing goods also decreases.
tabler-icon-diamond-filled.svg

Secure Best Marks with AI Grader

Need help grading? Try our AI Grader for instant feedback on your assignments.
Document Page
Taste & Preference: This factor essential for company in which affect the demand of
commodities. Increase in the taste or preference of goods will help in maximising demand of the
products & services. Similarly, fall in the taste & preferences also minimise the demand of
individuals. It further impact the demand line to shift right or left side.
Illustration 2: Shift in Demand Curve, 2020.
(Source: Shift in Demand Curve. 2020)
Above mention graph help the readers to understand that mention factors affect the
demand which clearly shows in the demand curve. Increase or decrease in these factors will
affect the demand curve or force it to shift upward or downward directions. Raise in the
disposable income shift the demand curve to the right side. On the other hand, fall in the price of
related goods reduces the demanded quantity of existing goods while curve move to the
downward side.
1.2 Explain the law of supply by supply curve and also define the factor which change the supply
curve
Law of Supply: The particular theory theory in which belong to the economic analysis
where raise in the price of products & services leads to increases the activity of trade good at the
marketplace (Khan and Khalique, 2014). In this law of supply, terms of commodity as well as
supplied quantity has positive relation. Foe example: when price of products & services raise in
the market than companies increases the supply and demand of consumers or earn maximise
Document Page
profit. Similarly, Tesco increase the production when price of commodities raise due to high
demand of goods. While, supply decreases if product price reduction.
Supply Curve: It is a visual representation of product price or supplied quantities which
aid the organizations or researchers to understand the market trend (Supply Curve, 2020). Price
and supplied quantity has positive relation and it will be possible when other than these two
factors all are constant. Tesco's managers evaluate the market for supply management and also
goods as per the price of commodities. Further discussion based on the below mention supply
curve:
Illustration 3: Supply Curve, 2020.
(Source: Supply Curve. 2020)
As per the mention the curve of supply depend on the quantity and price where Q denotes
to the quantity which supplied by the Tesco, fulfil the requirement of users. P indicate the price
of products which change as per the market circumstances. Due to enhance the price from P3 to
P2 than business need to increase supply from Q3 to Q2. On the other hand, when price reduces
from P1 to P2 than supply also reduces from Q1 to Q2.
Factors that affect the supply curve:
Supply curve mainly based on the price and goods that are shifting according to
marketing activities. It also relates with the supply of organizations and its impact clearly shows
in the supply curve and it may move from upward or downward sides (Prowle and Lucas, 2016).
Some of the factors are discussed below:
Document Page
Cost of production: Increases in the cost of production will decrease the overall supply
of the company. Production increases due to high wage, expensive raw materials etc. On the
other hand, decreases in cost of production encourage the organizations to supply more due to
low raw material cost and low wages. This relationship of price and supplied quantitative
mentioned in the curve and it move accordantly.
More firm: Increases in the number of businesses in the maker will increases the supply
that impact on the the supply curve (Factors affecting supply curve, 2020). This factor need to be
analysed by the organizations because it impact the supply which can further affect the profit
margin as well.
Technology: It is one of the important factor which affect the supply curve because with
the help of new technology company improve their performance and supply more quantity which
shift the supply curve upwards side. On the other hand, use of old technology reduce the supply
and it leads to shift supply curve downward side. Technology is the factor which maximise the
supply, so organizations need to update their technology or modify strategies accordingly.
Illustration 4: Shift in Supply Curve, 2020.
tabler-icon-diamond-filled.svg

Paraphrase This Document

Need a fresh take? Get an instant paraphrase of this document with our AI Paraphraser
Document Page
(Source: Shift in Supply Curve, 2020)
Above mention graph shows that S is the supply curve, Q is the supplied quantity which
is situated at X- axis and P indicate the price of products and based on Y- axis. When Tesco
supply more products then supply curve shift from S1 to S2. On the other hand, when company
reduces their supply due to low price of products and another factors than curve move from S2 to
S1 side (Schaltegger and Burritt, 2017). Other than price different types of aspects impact on the
supply of items & services and shift the curve right or left side. Technology and cost of
production is one of the essential factor which affect the production of business which further
impact the productivity as well as profitability of the firm.
CONCLUSION
On the basis of above discussion, it has been observed that market analysis is very
essential for the organizations which are mainly based on the demand and supply theory that
apply by the business. It is the important elements which help the individuals or organizations to
understand the market trends. Before making any strategy companies need to identify that
business able to meet the consumers expectation or not. In the law of demand, price and
demanded quantity has negative relationship and different aspects impact on the demand but
only in long term duration. Therefore, all the short term aspects are remain constant instead of
price. Similarly, in law of supply different types of factor which influence the supply of goods &
services such as cost of production, technology, other firms etc. These factors also affect in the
long term duration, on the other side short term aspects are remaining constant instead of price of
commodity.
Document Page
REFERENCES
Books & Journals
chevron_up_icon
1 out of 9
circle_padding
hide_on_mobile
zoom_out_icon
logo.png

Your All-in-One AI-Powered Toolkit for Academic Success.

Available 24*7 on WhatsApp / Email

[object Object]