Report on the Financial Position and Performance of Tesco Company
VerifiedAdded on 2023/01/05
|16
|4359
|92
Report
AI Summary
This report provides a comprehensive financial analysis of Tesco, examining its financial position through various ratios. The introduction defines accounting for finance and its role in projecting an organization's financial standing, using Tesco as a case study. The main body delves into profitability (gross profit, net profit, EBITDA margins), efficiency, liquidity (current and quick ratios), and financial gearing ratios. The analysis spans four years, highlighting trends in each ratio to assess Tesco's financial health and operational effectiveness. The report discusses the implications of these ratios, such as the increasing gross and net profit margins, the return on assets, and the inventory turnover ratio. The reflection section likely covers the author's experience, and the conclusion summarizes the key findings. Finally, the references section lists the sources used in the analysis.
Accounting and finance
Paraphrase This Document
Need a fresh take? Get an instant paraphrase of this document with our AI Paraphraser
TABLE OF CONTENTS
INTRODUCTION...........................................................................................................................3
MAIN BODY..................................................................................................................................3
Financial position assessment......................................................................................................3
REFLECTION...........................................................................................................................11
CONCLUSION..............................................................................................................................13
REFERENCES..............................................................................................................................14
INTRODUCTION
Accounting for finance is defined as identifying the financial transactions of the
organisation that can meet all the needs and requirements of the stakeholders. This is about to
project the exact financial position of organisation. This report is based on the case study of
Tesco Company in respect to its financial position. The organisation was established in the year
1919 by the founder Jack Cohen. Headquarter of the company is located in London, United
Kingdom. Company is currently operating at approximately 6800 business locations at a global
level. This project would assess the financial position of the company in market. Henceforth, this
report would emphasis over different ratios that can reflect the financial position of the
organisation. On the basis of the analysis of the ratios the financial stability of the company will
be measured and analysed. Furthermore, this project would also reflect the experience of the
assessor in order to complete the project and assessing about the financial position of the
organisation.
MAIN BODY
Financial position assessment
Financial position is denoted as the current financial situation of the company in order to
achieve the overall objectives behind the business functions. Ratio analysis is denoted as on the
basis of various rations financial position of the organisation can be identified easily. This
project how effective the organisation is capable of meeting the needs and requirements of the
financial situation of the organisation. Tesco Company is one of the fastest growing
organisations in the retail sector at a global level. Following is the projection of the financial
situation of organisation based on different ratios comprises with profitability ratio, efficiencies
ratio, liquidity ratio and financial gearing ratios.
Gross profit ratio (GPR)
Gross profit ration denote the gross profitability of the organisation. This ratio denote the
actual outcome company could generate against the trading activities undertaken by organisation
(Marsha, N. and Murtaqi, 2017). Gross profit is the net profitability company could entertain
again the trade it has done with customers.
GPR = Gross profit / sale * 100
This ratio compares the gross profitability of the company with the sales of the
organisation.
3
⊘ This is a preview!⊘
Do you want full access?
Subscribe today to unlock all pages.
Trusted by 1+ million students worldwide
2016 = 2020 / 53933 * 100
= 3.75%
2017 = 1966 / 55917 * 100
= 3.52%
2018 = 2995 / 57493 * 100
= 5.21%
2019 = 4514/ 63911 * 100
= 7.06%
The gross profit ratio of past four years is denoting the increasing trend in the
profitability of the Tesco Company. Its important for the organisation to entertain the increasing
trend in the gross profitability of the organisation. The increasing trend in the gross profit
margins denotes that Tesco Company is channelizing its business operations and functions in
right direction. The approaches of the company in doing business operations are effective and
favourable in respect to the business and retail market. Gross profit is the true indicator of the
trading situation and condition of organisation as it denote the revenue generated out of the
trading operations company has undertaken. In the last four financial year the gross profitability
has improved allot and the last year profit margin reported as 7.06% as compare to the fourth
previous year which register the profitability as 3.75%. Profitability of the company is
approximately double
Net Profit Ratio
Net profit denotes the net income of the company. This is the net outcome company
could generate in the respective financial year against the business operations undertaken. The
exact profitability of the organisation is denoted with the net profit company has entertained in
the respective financial year (Zorn and et.al., 2018). Net profitability projects the actual
outcomes against the business operations entertained by the Tesco Company. This is the actual
revenue company is generating against the business operations undertaken by organisation.
NPR = Net profit / sales * 100
2016 = 256 / 53933 * 100
= .474%
2017 = 58 / 55917 * 100
= .103%
4
Paraphrase This Document
Need a fresh take? Get an instant paraphrase of this document with our AI Paraphraser
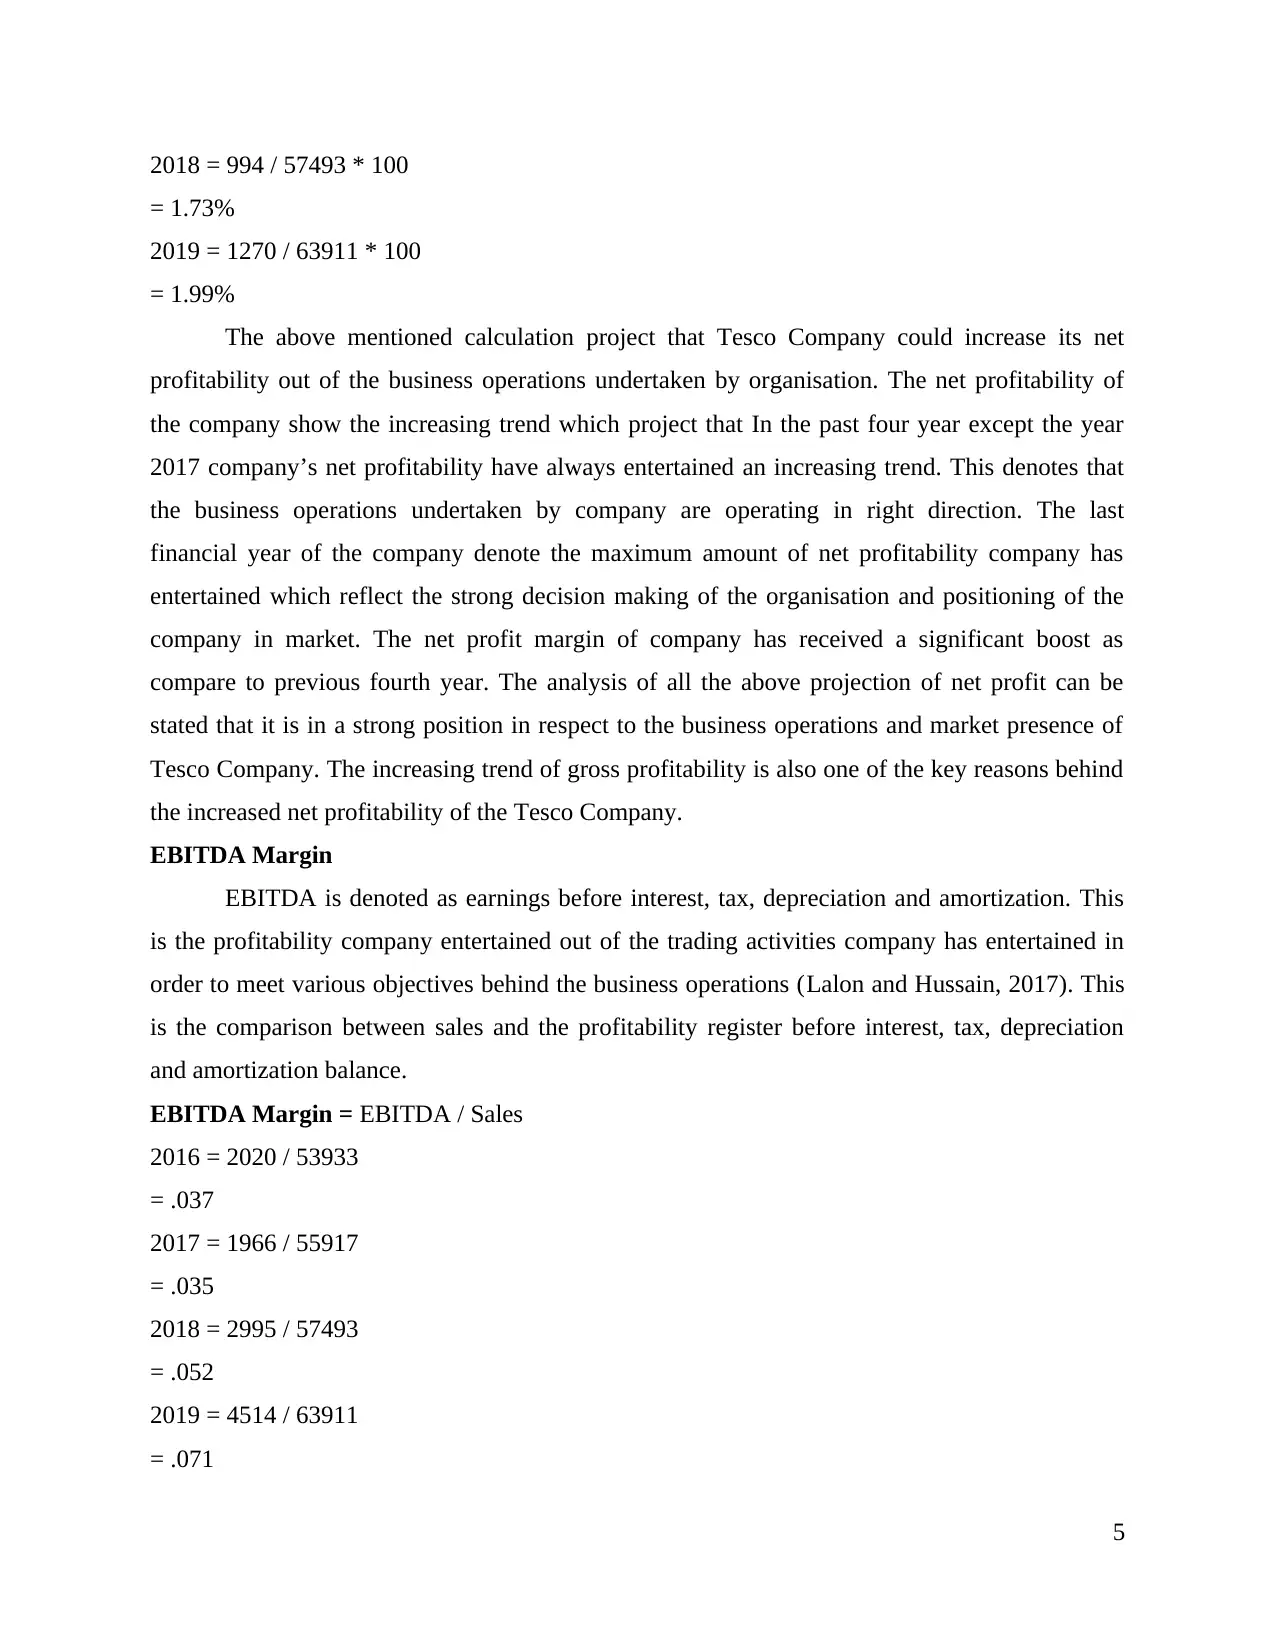
2018 = 994 / 57493 * 100
= 1.73%
2019 = 1270 / 63911 * 100
= 1.99%
The above mentioned calculation project that Tesco Company could increase its net
profitability out of the business operations undertaken by organisation. The net profitability of
the company show the increasing trend which project that In the past four year except the year
2017 company’s net profitability have always entertained an increasing trend. This denotes that
the business operations undertaken by company are operating in right direction. The last
financial year of the company denote the maximum amount of net profitability company has
entertained which reflect the strong decision making of the organisation and positioning of the
company in market. The net profit margin of company has received a significant boost as
compare to previous fourth year. The analysis of all the above projection of net profit can be
stated that it is in a strong position in respect to the business operations and market presence of
Tesco Company. The increasing trend of gross profitability is also one of the key reasons behind
the increased net profitability of the Tesco Company.
EBITDA Margin
EBITDA is denoted as earnings before interest, tax, depreciation and amortization. This
is the profitability company entertained out of the trading activities company has entertained in
order to meet various objectives behind the business operations (Lalon and Hussain, 2017). This
is the comparison between sales and the profitability register before interest, tax, depreciation
and amortization balance.
EBITDA Margin = EBITDA / Sales
2016 = 2020 / 53933
= .037
2017 = 1966 / 55917
= .035
2018 = 2995 / 57493
= .052
2019 = 4514 / 63911
= .071
5
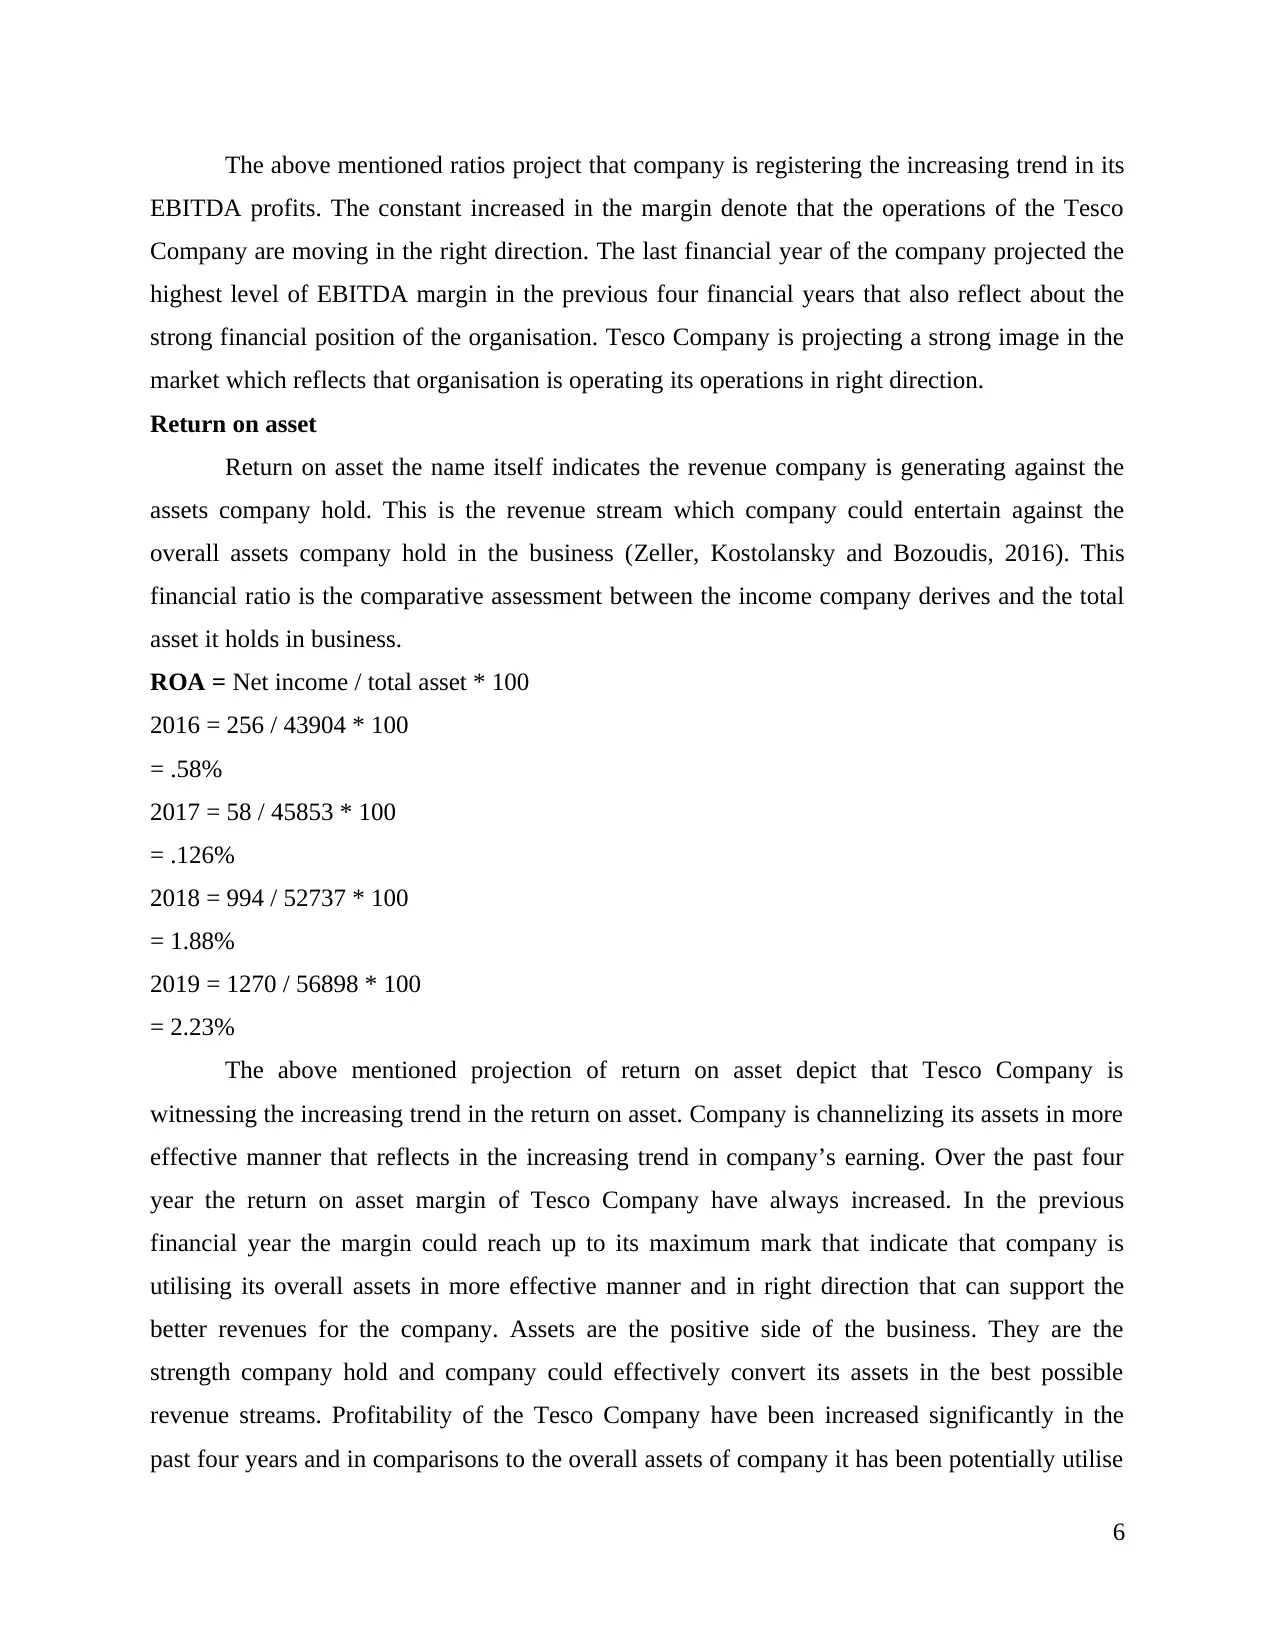
The above mentioned ratios project that company is registering the increasing trend in its
EBITDA profits. The constant increased in the margin denote that the operations of the Tesco
Company are moving in the right direction. The last financial year of the company projected the
highest level of EBITDA margin in the previous four financial years that also reflect about the
strong financial position of the organisation. Tesco Company is projecting a strong image in the
market which reflects that organisation is operating its operations in right direction.
Return on asset
Return on asset the name itself indicates the revenue company is generating against the
assets company hold. This is the revenue stream which company could entertain against the
overall assets company hold in the business (Zeller, Kostolansky and Bozoudis, 2016). This
financial ratio is the comparative assessment between the income company derives and the total
asset it holds in business.
ROA = Net income / total asset * 100
2016 = 256 / 43904 * 100
= .58%
2017 = 58 / 45853 * 100
= .126%
2018 = 994 / 52737 * 100
= 1.88%
2019 = 1270 / 56898 * 100
= 2.23%
The above mentioned projection of return on asset depict that Tesco Company is
witnessing the increasing trend in the return on asset. Company is channelizing its assets in more
effective manner that reflects in the increasing trend in company’s earning. Over the past four
year the return on asset margin of Tesco Company have always increased. In the previous
financial year the margin could reach up to its maximum mark that indicate that company is
utilising its overall assets in more effective manner and in right direction that can support the
better revenues for the company. Assets are the positive side of the business. They are the
strength company hold and company could effectively convert its assets in the best possible
revenue streams. Profitability of the Tesco Company have been increased significantly in the
past four years and in comparisons to the overall assets of company it has been potentially utilise
6
⊘ This is a preview!⊘
Do you want full access?
Subscribe today to unlock all pages.
Trusted by 1+ million students worldwide
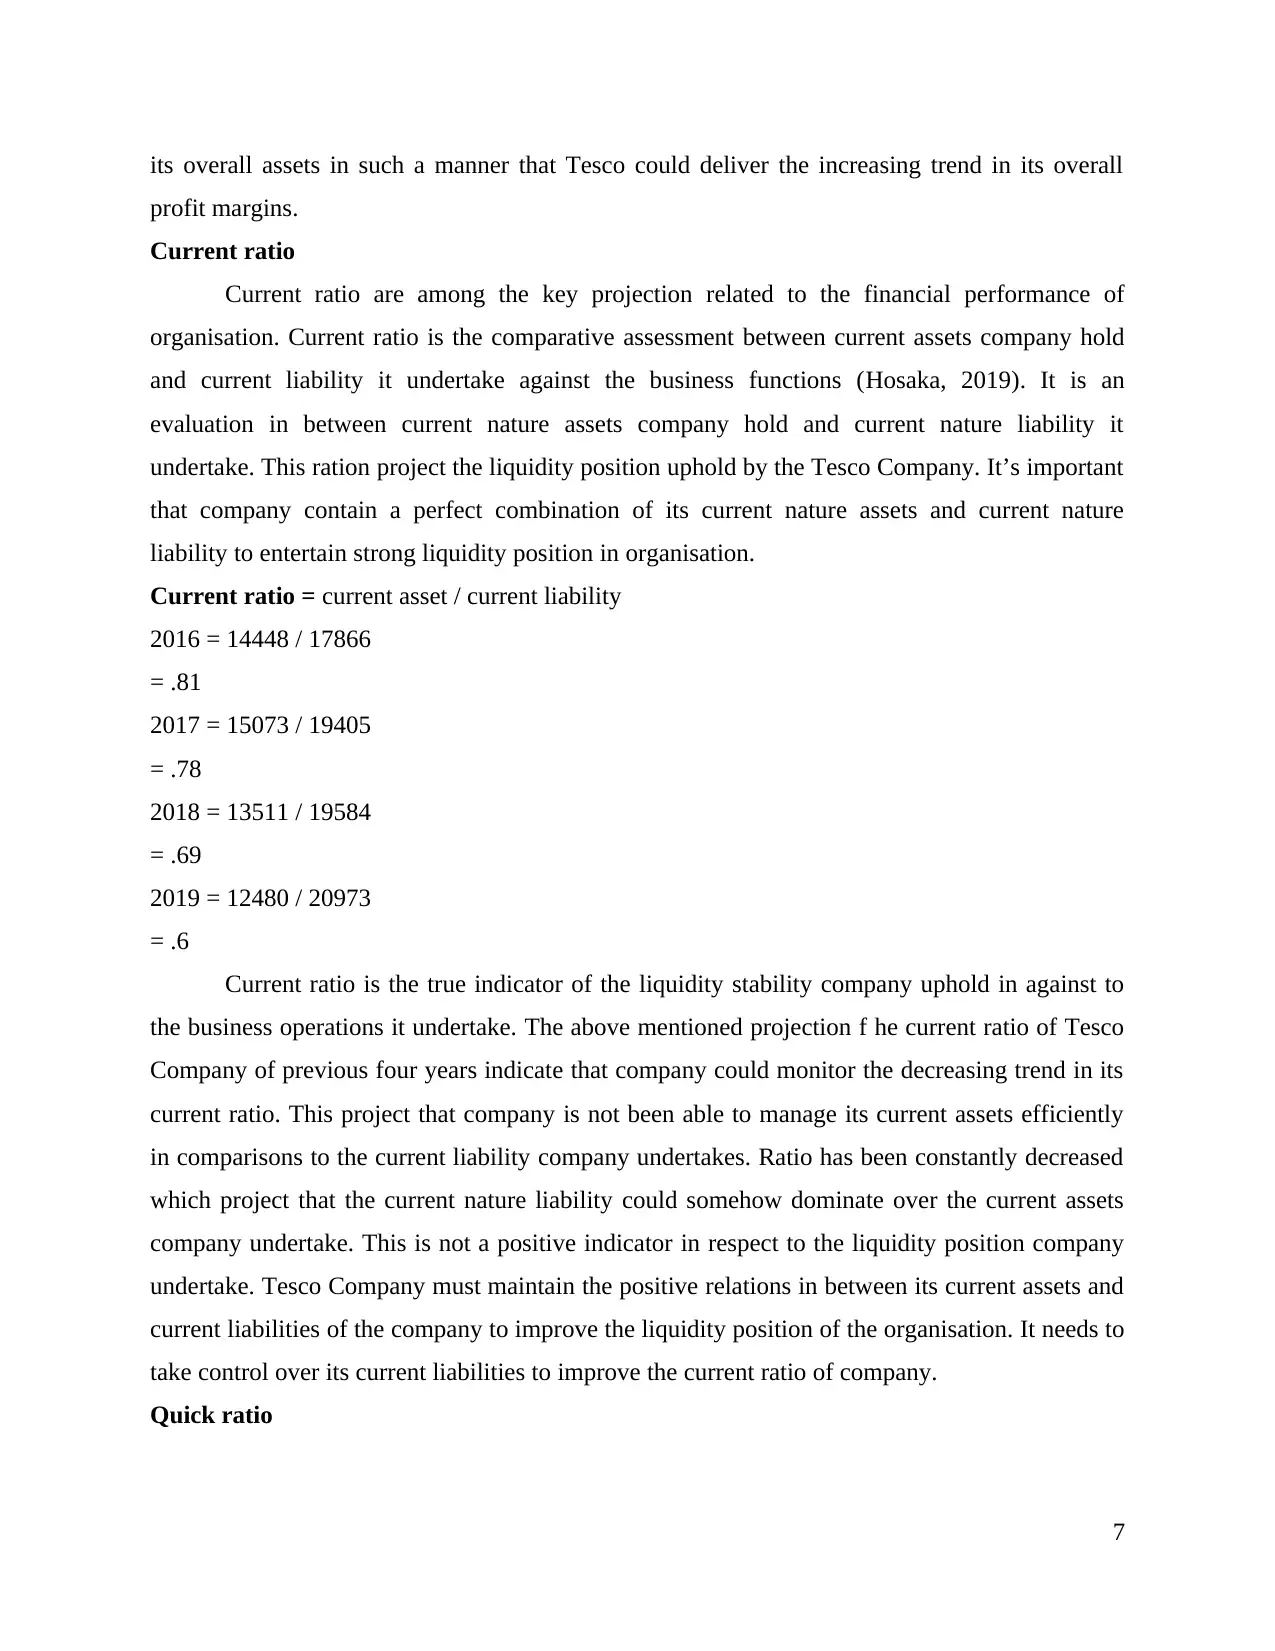
its overall assets in such a manner that Tesco could deliver the increasing trend in its overall
profit margins.
Current ratio
Current ratio are among the key projection related to the financial performance of
organisation. Current ratio is the comparative assessment between current assets company hold
and current liability it undertake against the business functions (Hosaka, 2019). It is an
evaluation in between current nature assets company hold and current nature liability it
undertake. This ration project the liquidity position uphold by the Tesco Company. It’s important
that company contain a perfect combination of its current nature assets and current nature
liability to entertain strong liquidity position in organisation.
Current ratio = current asset / current liability
2016 = 14448 / 17866
= .81
2017 = 15073 / 19405
= .78
2018 = 13511 / 19584
= .69
2019 = 12480 / 20973
= .6
Current ratio is the true indicator of the liquidity stability company uphold in against to
the business operations it undertake. The above mentioned projection f he current ratio of Tesco
Company of previous four years indicate that company could monitor the decreasing trend in its
current ratio. This project that company is not been able to manage its current assets efficiently
in comparisons to the current liability company undertakes. Ratio has been constantly decreased
which project that the current nature liability could somehow dominate over the current assets
company undertake. This is not a positive indicator in respect to the liquidity position company
undertake. Tesco Company must maintain the positive relations in between its current assets and
current liabilities of the company to improve the liquidity position of the organisation. It needs to
take control over its current liabilities to improve the current ratio of company.
Quick ratio
7
Paraphrase This Document
Need a fresh take? Get an instant paraphrase of this document with our AI Paraphraser
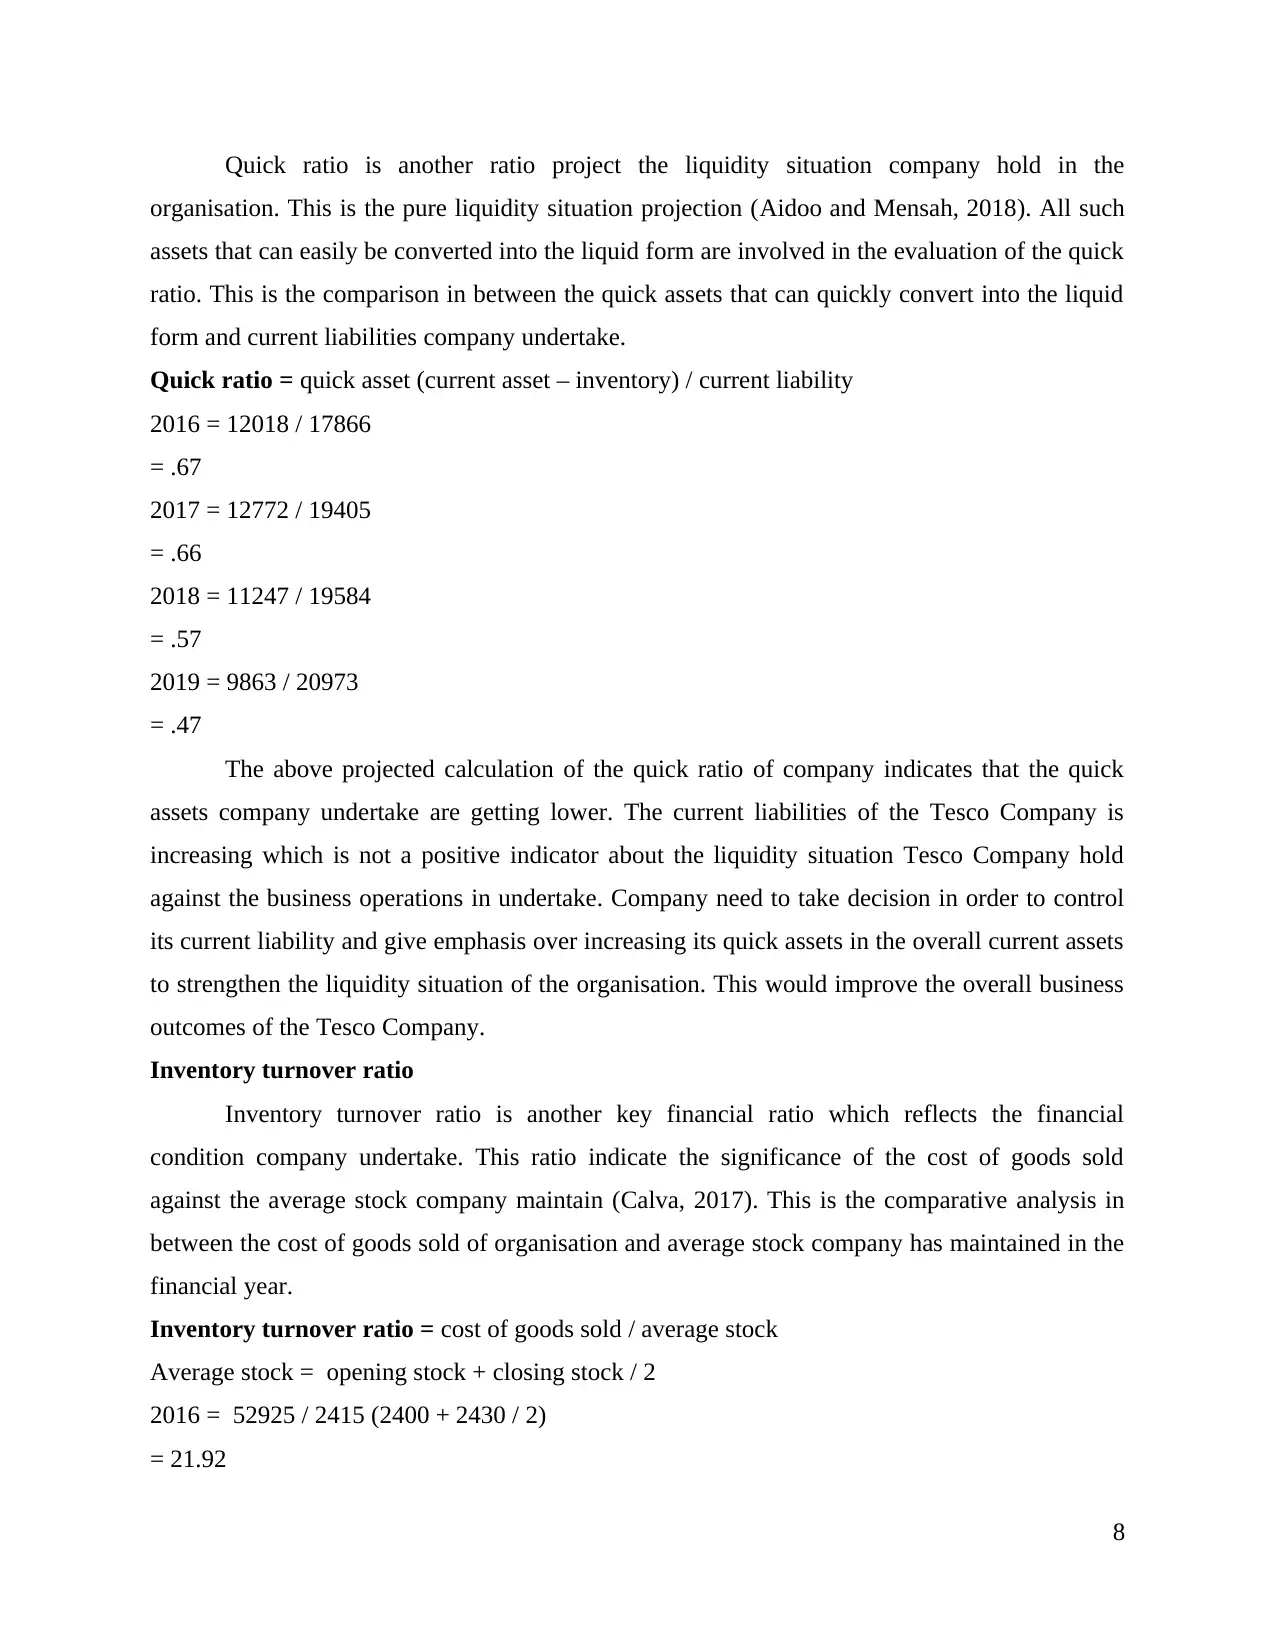
Quick ratio is another ratio project the liquidity situation company hold in the
organisation. This is the pure liquidity situation projection (Aidoo and Mensah, 2018). All such
assets that can easily be converted into the liquid form are involved in the evaluation of the quick
ratio. This is the comparison in between the quick assets that can quickly convert into the liquid
form and current liabilities company undertake.
Quick ratio = quick asset (current asset – inventory) / current liability
2016 = 12018 / 17866
= .67
2017 = 12772 / 19405
= .66
2018 = 11247 / 19584
= .57
2019 = 9863 / 20973
= .47
The above projected calculation of the quick ratio of company indicates that the quick
assets company undertake are getting lower. The current liabilities of the Tesco Company is
increasing which is not a positive indicator about the liquidity situation Tesco Company hold
against the business operations in undertake. Company need to take decision in order to control
its current liability and give emphasis over increasing its quick assets in the overall current assets
to strengthen the liquidity situation of the organisation. This would improve the overall business
outcomes of the Tesco Company.
Inventory turnover ratio
Inventory turnover ratio is another key financial ratio which reflects the financial
condition company undertake. This ratio indicate the significance of the cost of goods sold
against the average stock company maintain (Calva, 2017). This is the comparative analysis in
between the cost of goods sold of organisation and average stock company has maintained in the
financial year.
Inventory turnover ratio = cost of goods sold / average stock
Average stock = opening stock + closing stock / 2
2016 = 52925 / 2415 (2400 + 2430 / 2)
= 21.92
8
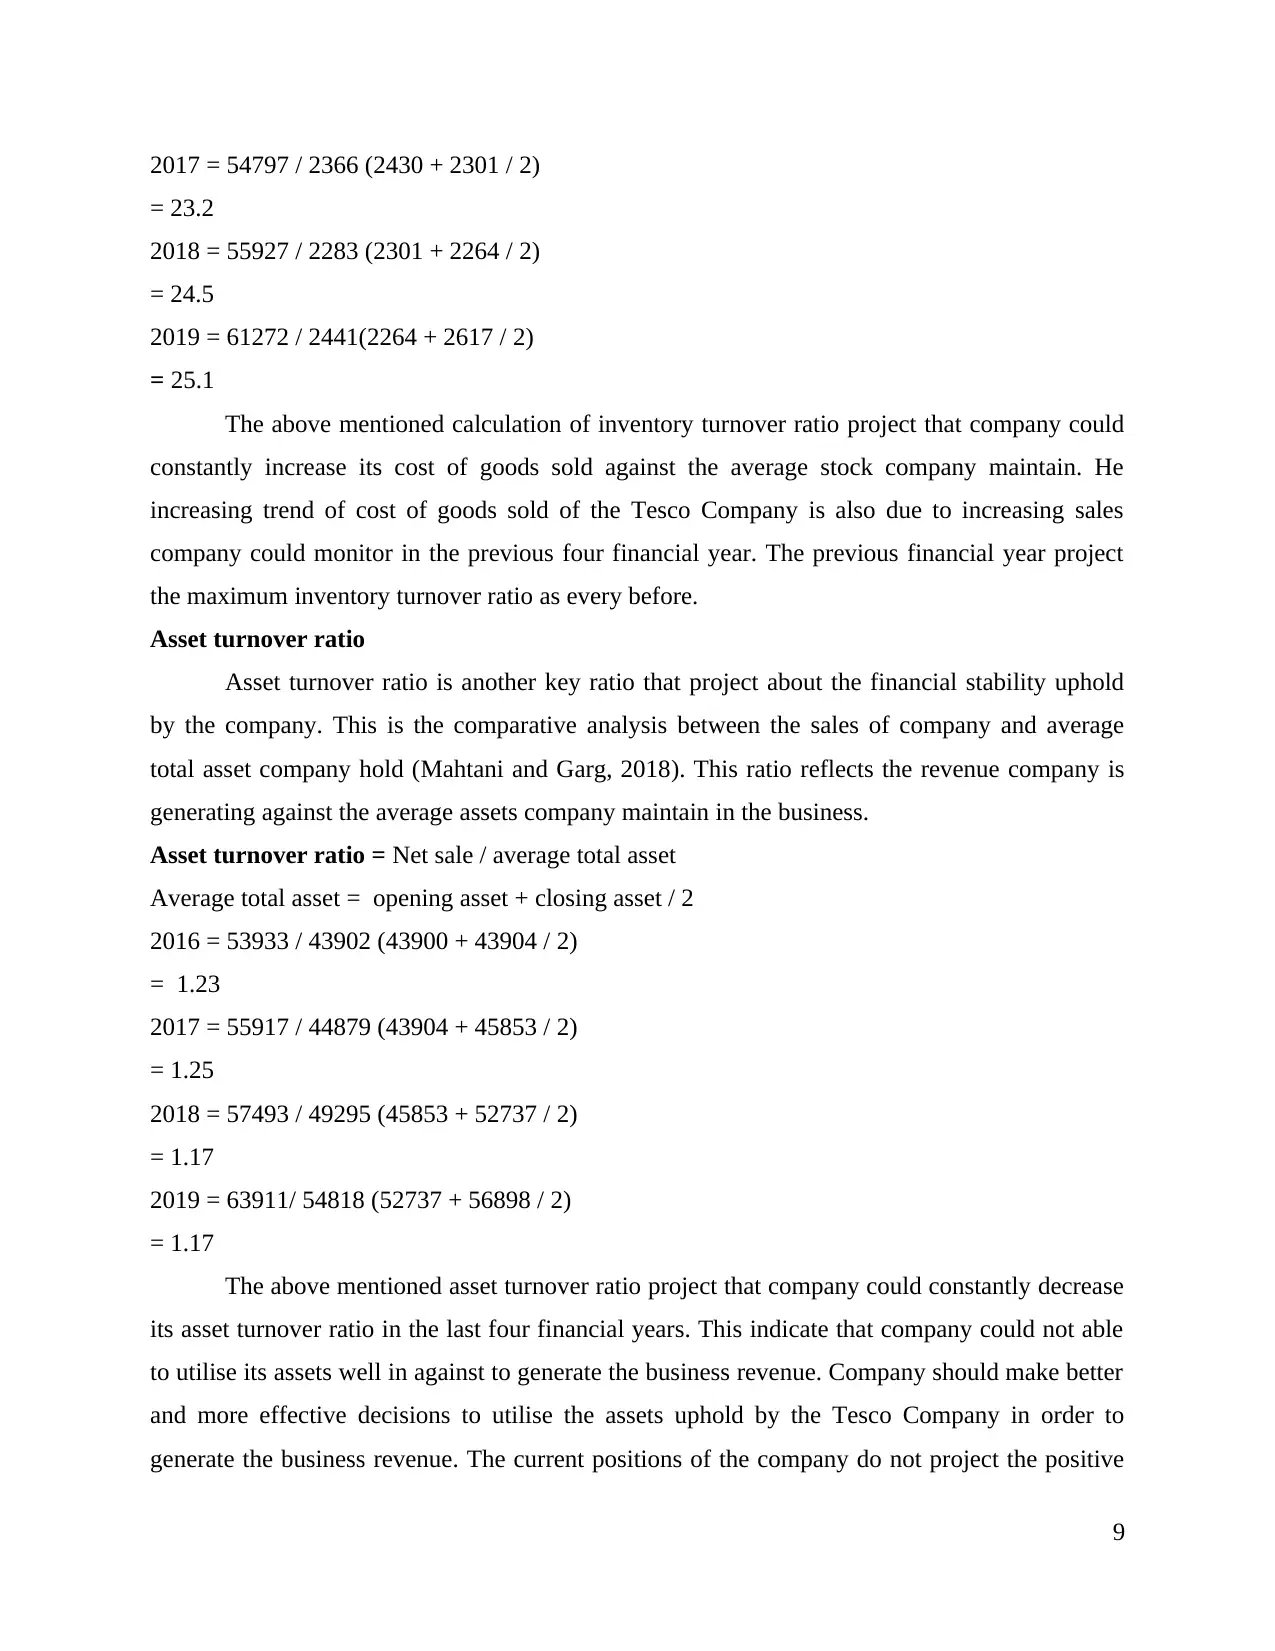
2017 = 54797 / 2366 (2430 + 2301 / 2)
= 23.2
2018 = 55927 / 2283 (2301 + 2264 / 2)
= 24.5
2019 = 61272 / 2441(2264 + 2617 / 2)
= 25.1
The above mentioned calculation of inventory turnover ratio project that company could
constantly increase its cost of goods sold against the average stock company maintain. He
increasing trend of cost of goods sold of the Tesco Company is also due to increasing sales
company could monitor in the previous four financial year. The previous financial year project
the maximum inventory turnover ratio as every before.
Asset turnover ratio
Asset turnover ratio is another key ratio that project about the financial stability uphold
by the company. This is the comparative analysis between the sales of company and average
total asset company hold (Mahtani and Garg, 2018). This ratio reflects the revenue company is
generating against the average assets company maintain in the business.
Asset turnover ratio = Net sale / average total asset
Average total asset = opening asset + closing asset / 2
2016 = 53933 / 43902 (43900 + 43904 / 2)
= 1.23
2017 = 55917 / 44879 (43904 + 45853 / 2)
= 1.25
2018 = 57493 / 49295 (45853 + 52737 / 2)
= 1.17
2019 = 63911/ 54818 (52737 + 56898 / 2)
= 1.17
The above mentioned asset turnover ratio project that company could constantly decrease
its asset turnover ratio in the last four financial years. This indicate that company could not able
to utilise its assets well in against to generate the business revenue. Company should make better
and more effective decisions to utilise the assets uphold by the Tesco Company in order to
generate the business revenue. The current positions of the company do not project the positive
9
⊘ This is a preview!⊘
Do you want full access?
Subscribe today to unlock all pages.
Trusted by 1+ million students worldwide
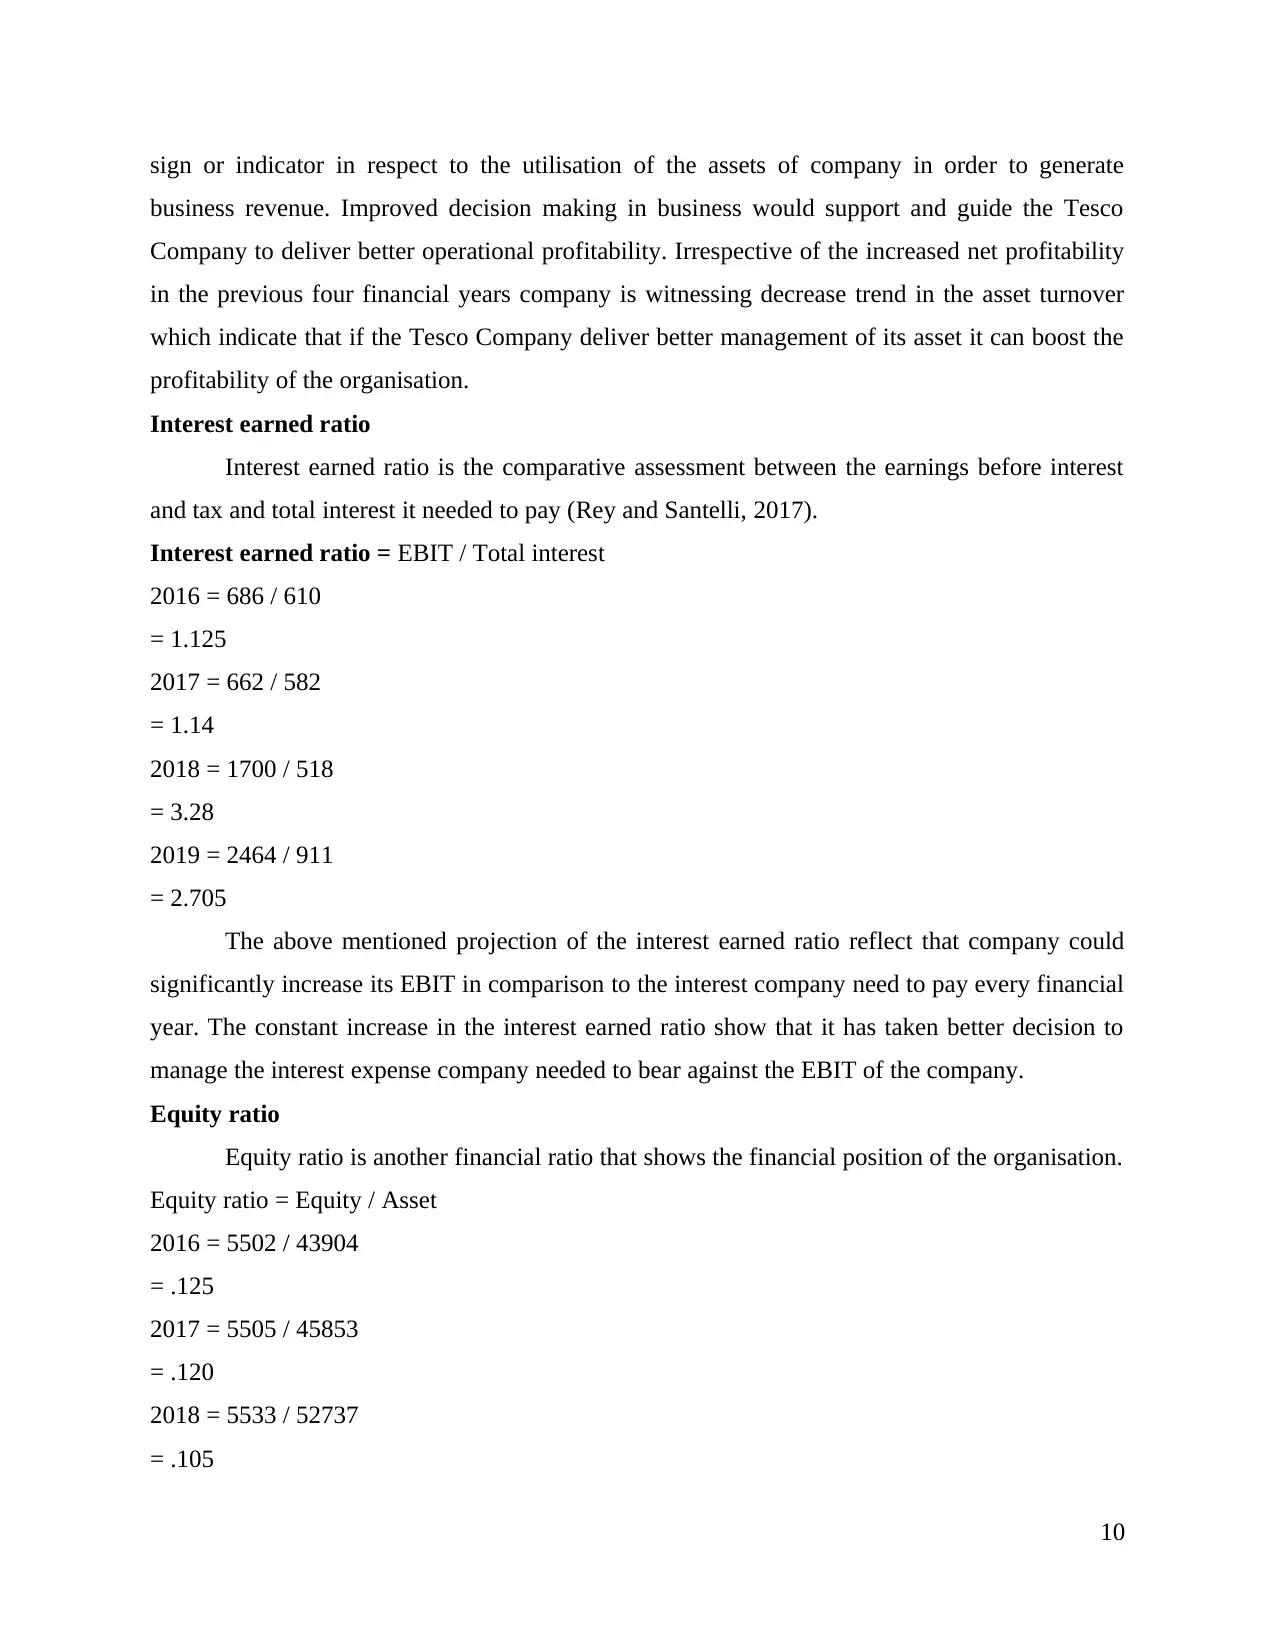
sign or indicator in respect to the utilisation of the assets of company in order to generate
business revenue. Improved decision making in business would support and guide the Tesco
Company to deliver better operational profitability. Irrespective of the increased net profitability
in the previous four financial years company is witnessing decrease trend in the asset turnover
which indicate that if the Tesco Company deliver better management of its asset it can boost the
profitability of the organisation.
Interest earned ratio
Interest earned ratio is the comparative assessment between the earnings before interest
and tax and total interest it needed to pay (Rey and Santelli, 2017).
Interest earned ratio = EBIT / Total interest
2016 = 686 / 610
= 1.125
2017 = 662 / 582
= 1.14
2018 = 1700 / 518
= 3.28
2019 = 2464 / 911
= 2.705
The above mentioned projection of the interest earned ratio reflect that company could
significantly increase its EBIT in comparison to the interest company need to pay every financial
year. The constant increase in the interest earned ratio show that it has taken better decision to
manage the interest expense company needed to bear against the EBIT of the company.
Equity ratio
Equity ratio is another financial ratio that shows the financial position of the organisation.
Equity ratio = Equity / Asset
2016 = 5502 / 43904
= .125
2017 = 5505 / 45853
= .120
2018 = 5533 / 52737
= .105
10
Paraphrase This Document
Need a fresh take? Get an instant paraphrase of this document with our AI Paraphraser
2019 = 5671 / 56898
= .1
The above calculation about the equity ratio shows that company could register
decreasing trend in its equity ratio. This reflects that assets are getting stronger in company than
the equity shares of owners in the Tesco Company.
REFLECTION
I was unable to achieve the pass criteria in my last submission as I didn’t produce much of
the evidences which is was supposed to give. That part was the mandatory part of the submission
and I didn’t focus on it as much as I should. This was the biggest reason which failed me. As I
have not provided the evidence, the credibility of the content written was lost that hindered my
progress of the assignment. I also didn’t get the enough resources and the facilities which could
help me to do the assignment. If I could get those resources, I would have done much better but
due to the lack of certain resources I was not able to enhance my knowledge which also made it
very difficult to implement my theoretical knowledge practically.
Also, I didn’t read my assignment well which diverted me from the main topic which I had
to focus on. I misinterpreted the questions asked and focussed on the thing which was understood
to me. This destroyed the quality of my content as it was irrelevant with respect to the questions
which were asked. I was told to do something and I handed something else which was just due to
not reading the assignment carefully. Furthermore, I was told that plagiarism is strictly restricted
and I didn’t copy the complete content but when I was extracting the information from various
sources, I forgot to write the references along with them which made my content to be
considered as a part of plagiarism. I was unable to acknowledge the sources properly (Ali and
et.al., 2016). I used the ideas from the internet and the other sources like books and journals but
presented them without acknowledgement.
Also, as the file needed to involve all the real information of the company but I didn’t
include all the real information instead I used some real as well as some hypothetical information
which unable my assignment to achieve the pass criteria. I focussed more on the theoretical part
which lowered the quality of my assignment and because of which the file was not looking as a
file of finance and accounting (Batool and Sahi, 2019).
11
In order to find the ratios, I was supposed to use the financial information of the company such
as the balance sheets, bank balance, funding, the donations along with the cash in hand. But I
focussed more on the cash in only which weakened the analysis which made this difficult for me
to calculate the ratios and after calculating also, they were not accurate.
I did not express the financial quantities in relation to another well and could not assisted
it with the company and the valuations of security. I did not involve the stock selections and
forecasting which were the mandatory things for achieving the pass criteria.
I also used some of the information related to the company which was not updated and
recent which lead to the different ratios instead of getting the recent ratios. For example, when
the ratio was to be calculated by using the current assets and liabilities, I used the data which was
almost 5 years ago which change the whole results. These ratios basically reflect the position of
the company at a point in time (Tvaronavičienė, Masood and Javaria, 2018).
I also used the averages instead of using the balance sheet which could give more
accurate results. The balance sheet could give me more precise and accurate financial
information about the company, but I didn’t know that these small changes can lead to wide
differences so I used the average in calculating the ratios.
I was not having appropriate knowledge and was lacking the depth of understanding
regarding the key principles and the concepts which forced me to use the irrelevant data which
was right for me but was irrelevant in the eyes of the needs of the assignment. I was having less
accessibility to some of the resources which made difficult to retrieve the real financial
information of the company. The basic knowledge was must in order to retrieve the financial
information of the company. I felt that I was weak in calculations that is why I made a lot of
mistakes in the calculative part which also destroyed the quality of my assignment.
The data was also very limited which resulted in unclear interpretations of the complex
data thereby leading to poor presentation of the results. Due to all these reasons, I was unable to
achieve the pass criteria. But in doing this assignment, I focussed on all the reasons which
hindered the assignment quality.
I enhanced my knowledge which helped me in using the financial information of the
company which are used in calculating the ratios. I provided the evidence of all the information
collected from various sources and have added sufficient references which are true. I didn’t
12
⊘ This is a preview!⊘
Do you want full access?
Subscribe today to unlock all pages.
Trusted by 1+ million students worldwide
1 out of 16
Related Documents


Your All-in-One AI-Powered Toolkit for Academic Success.
+13062052269
info@desklib.com
Available 24*7 on WhatsApp / Email
![[object Object]](/_next/static/media/star-bottom.7253800d.svg)
Unlock your academic potential
Copyright © 2020–2026 A2Z Services. All Rights Reserved. Developed and managed by ZUCOL.