Corporate Finance Management and Governance: Tesco Financial Report

Verified

Added on  2020/10/05

|11
|2162
|388
Report
AI Summary
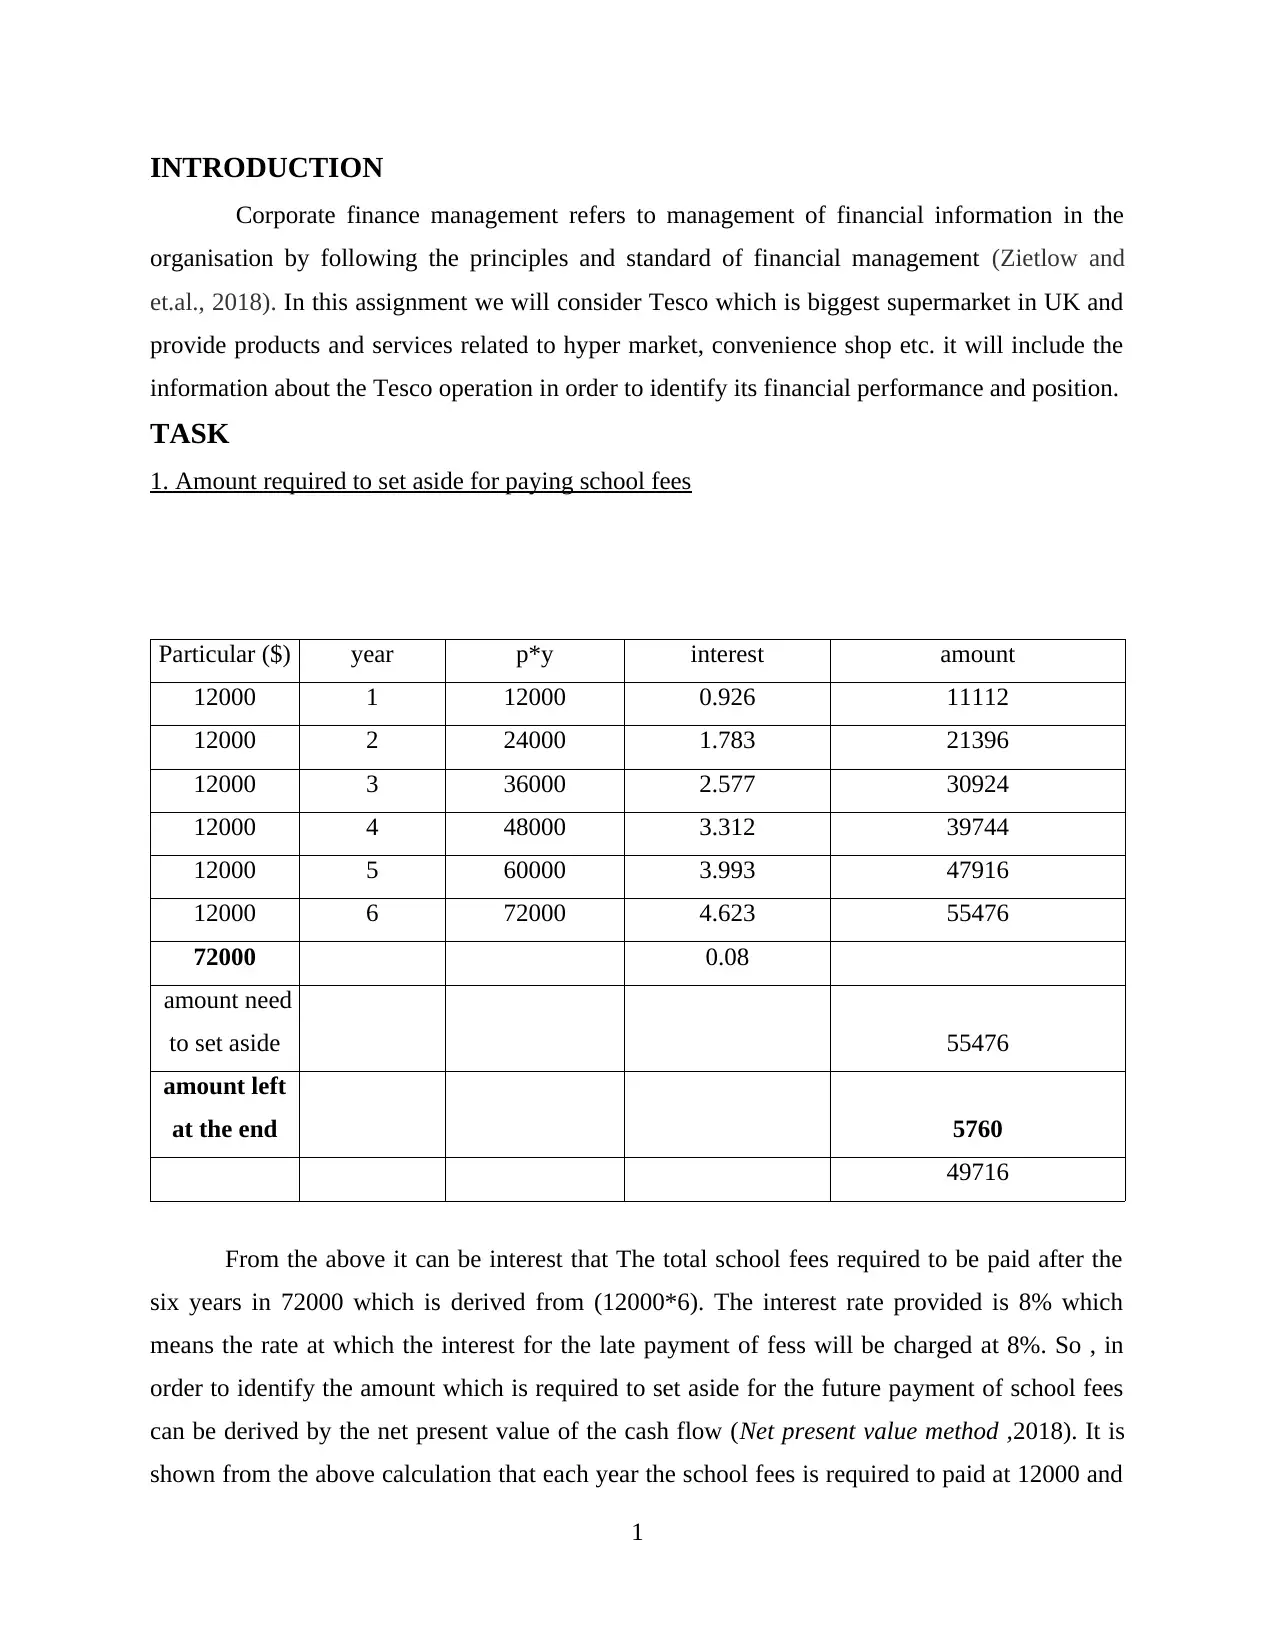
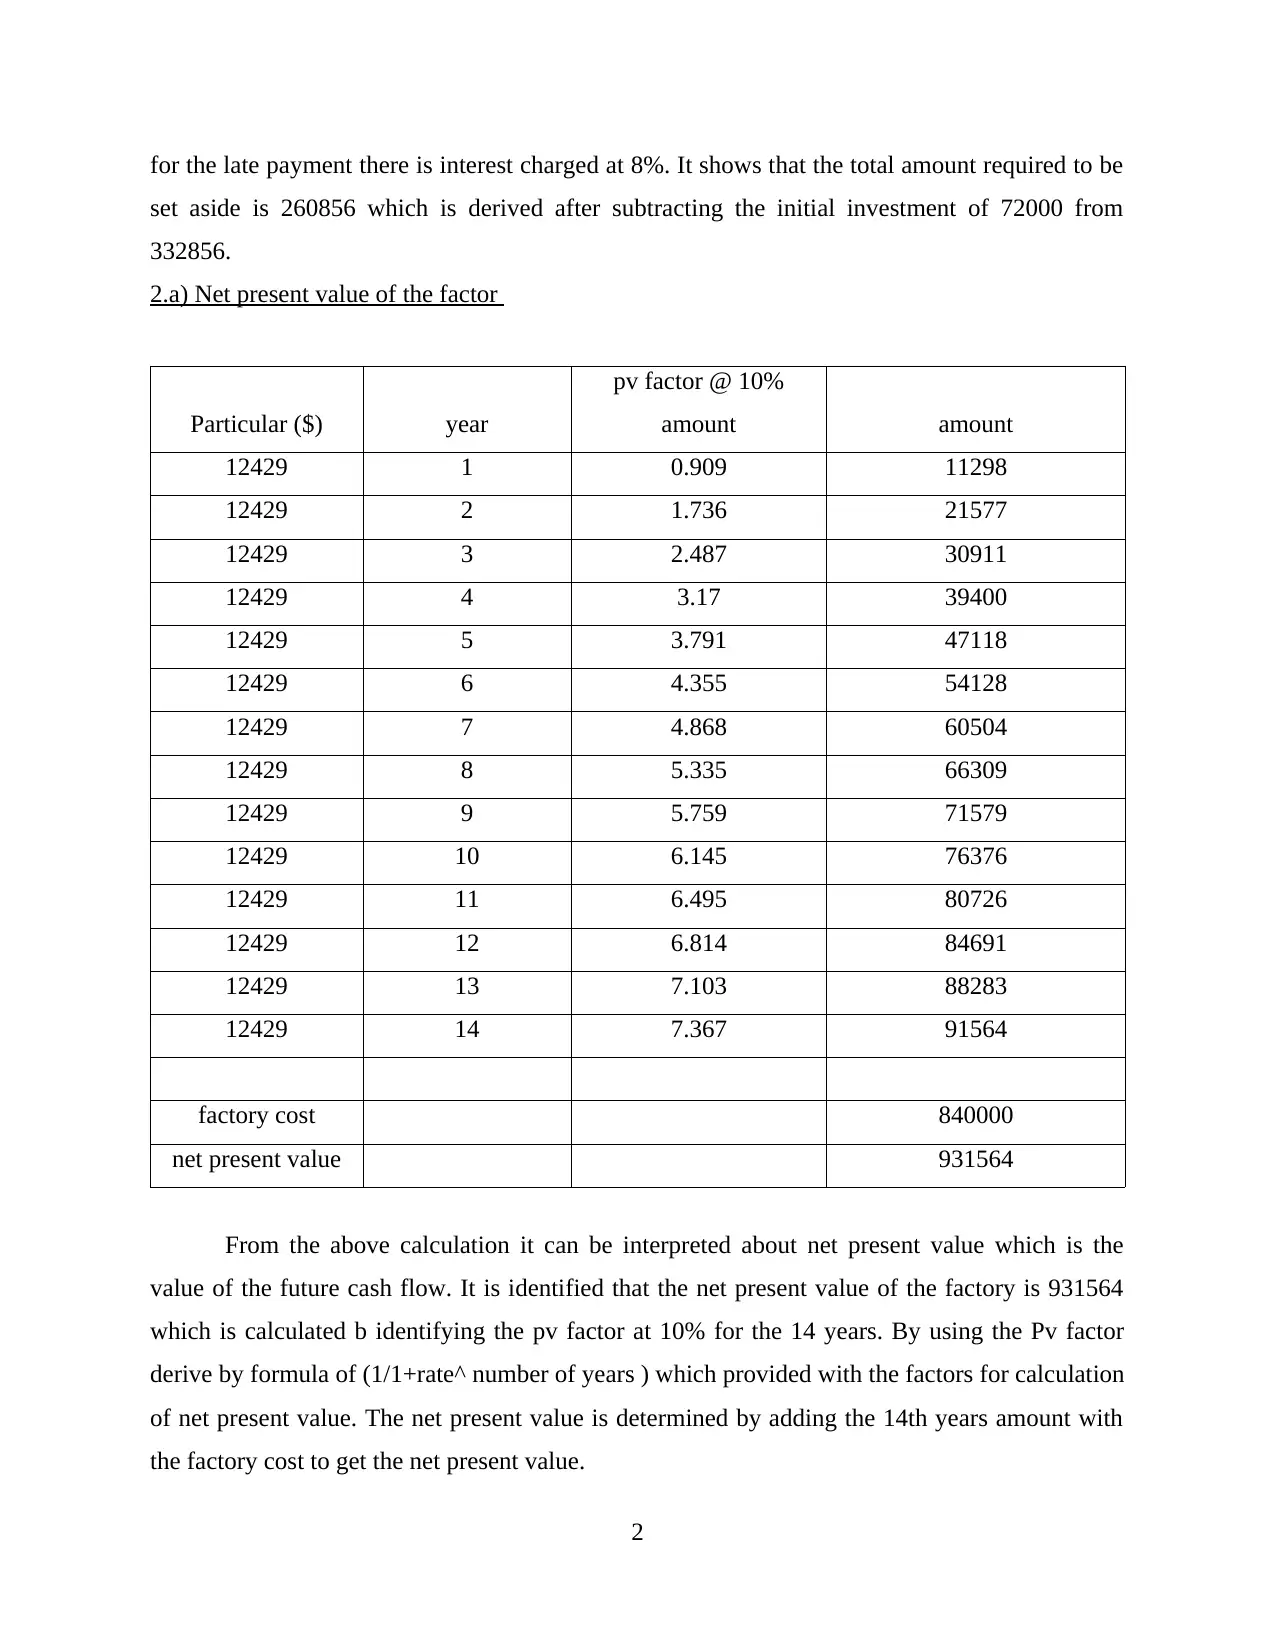
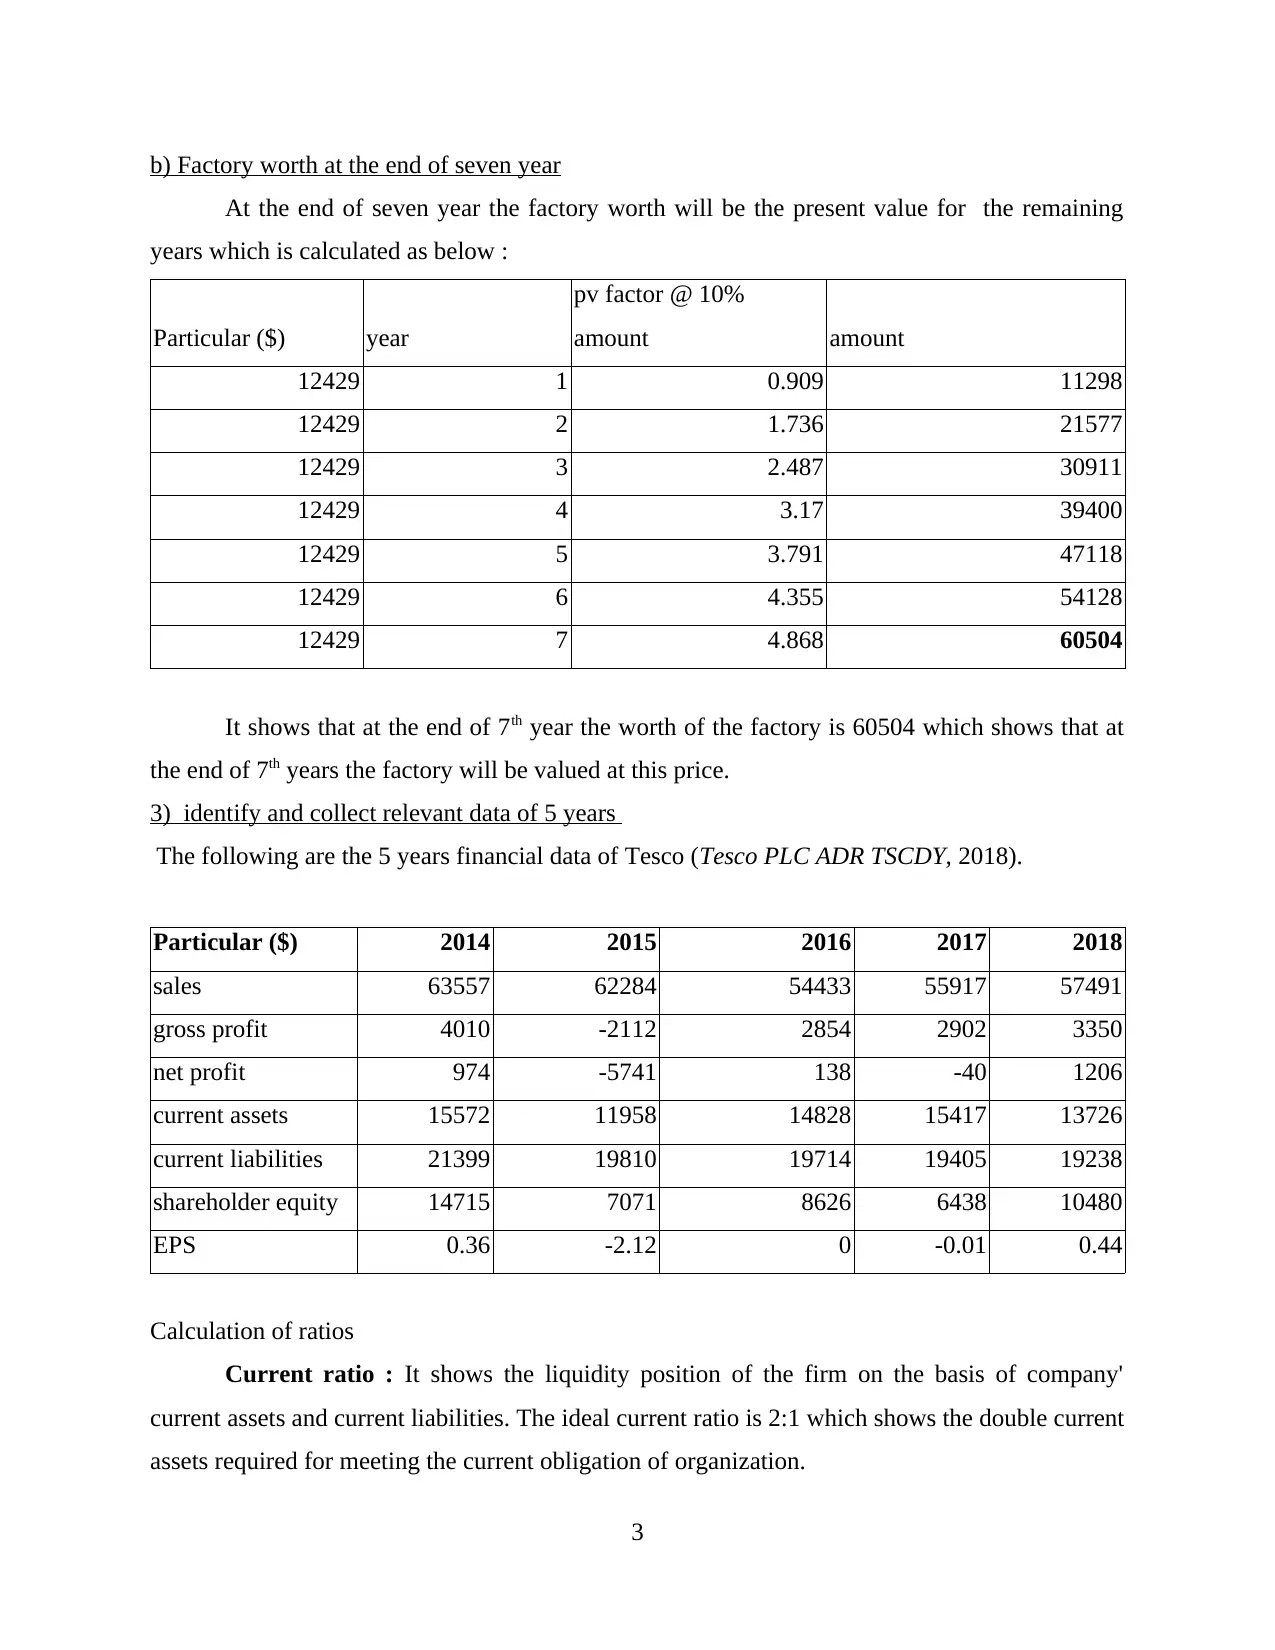
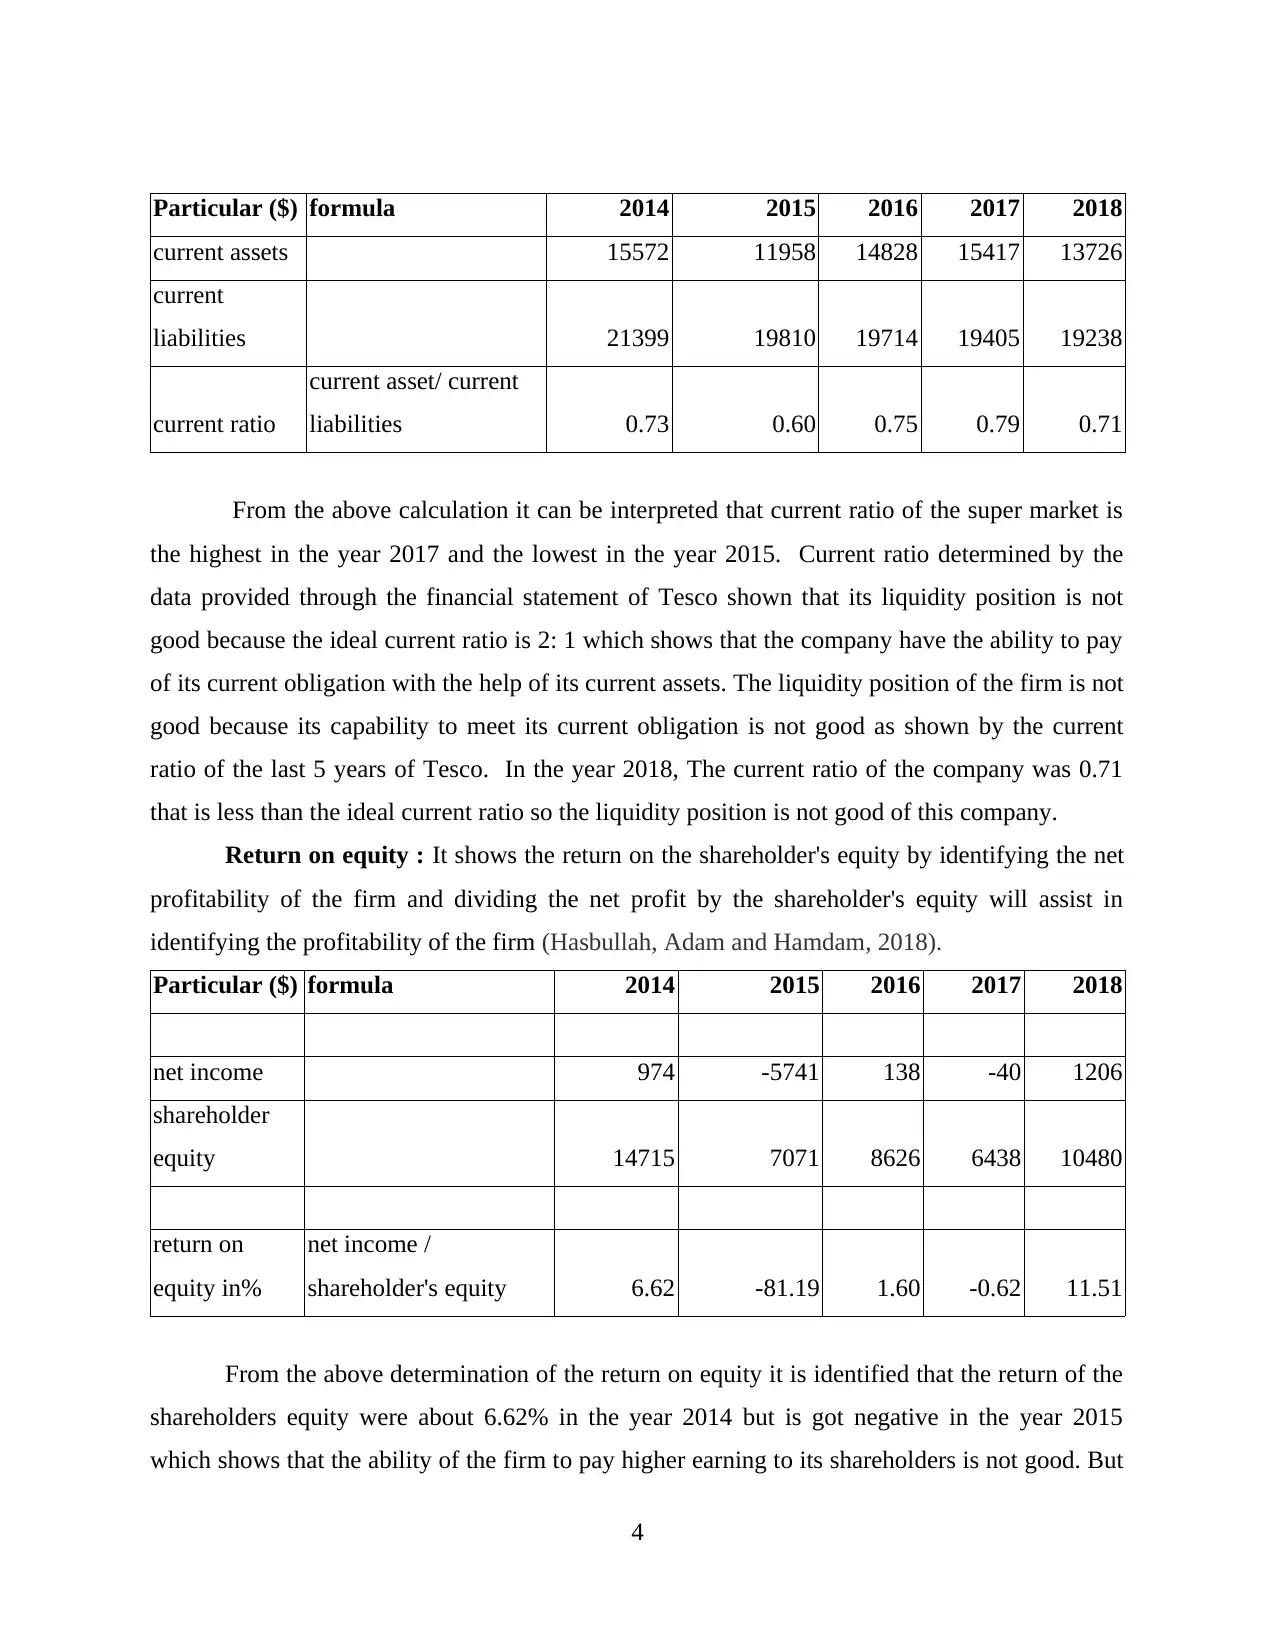
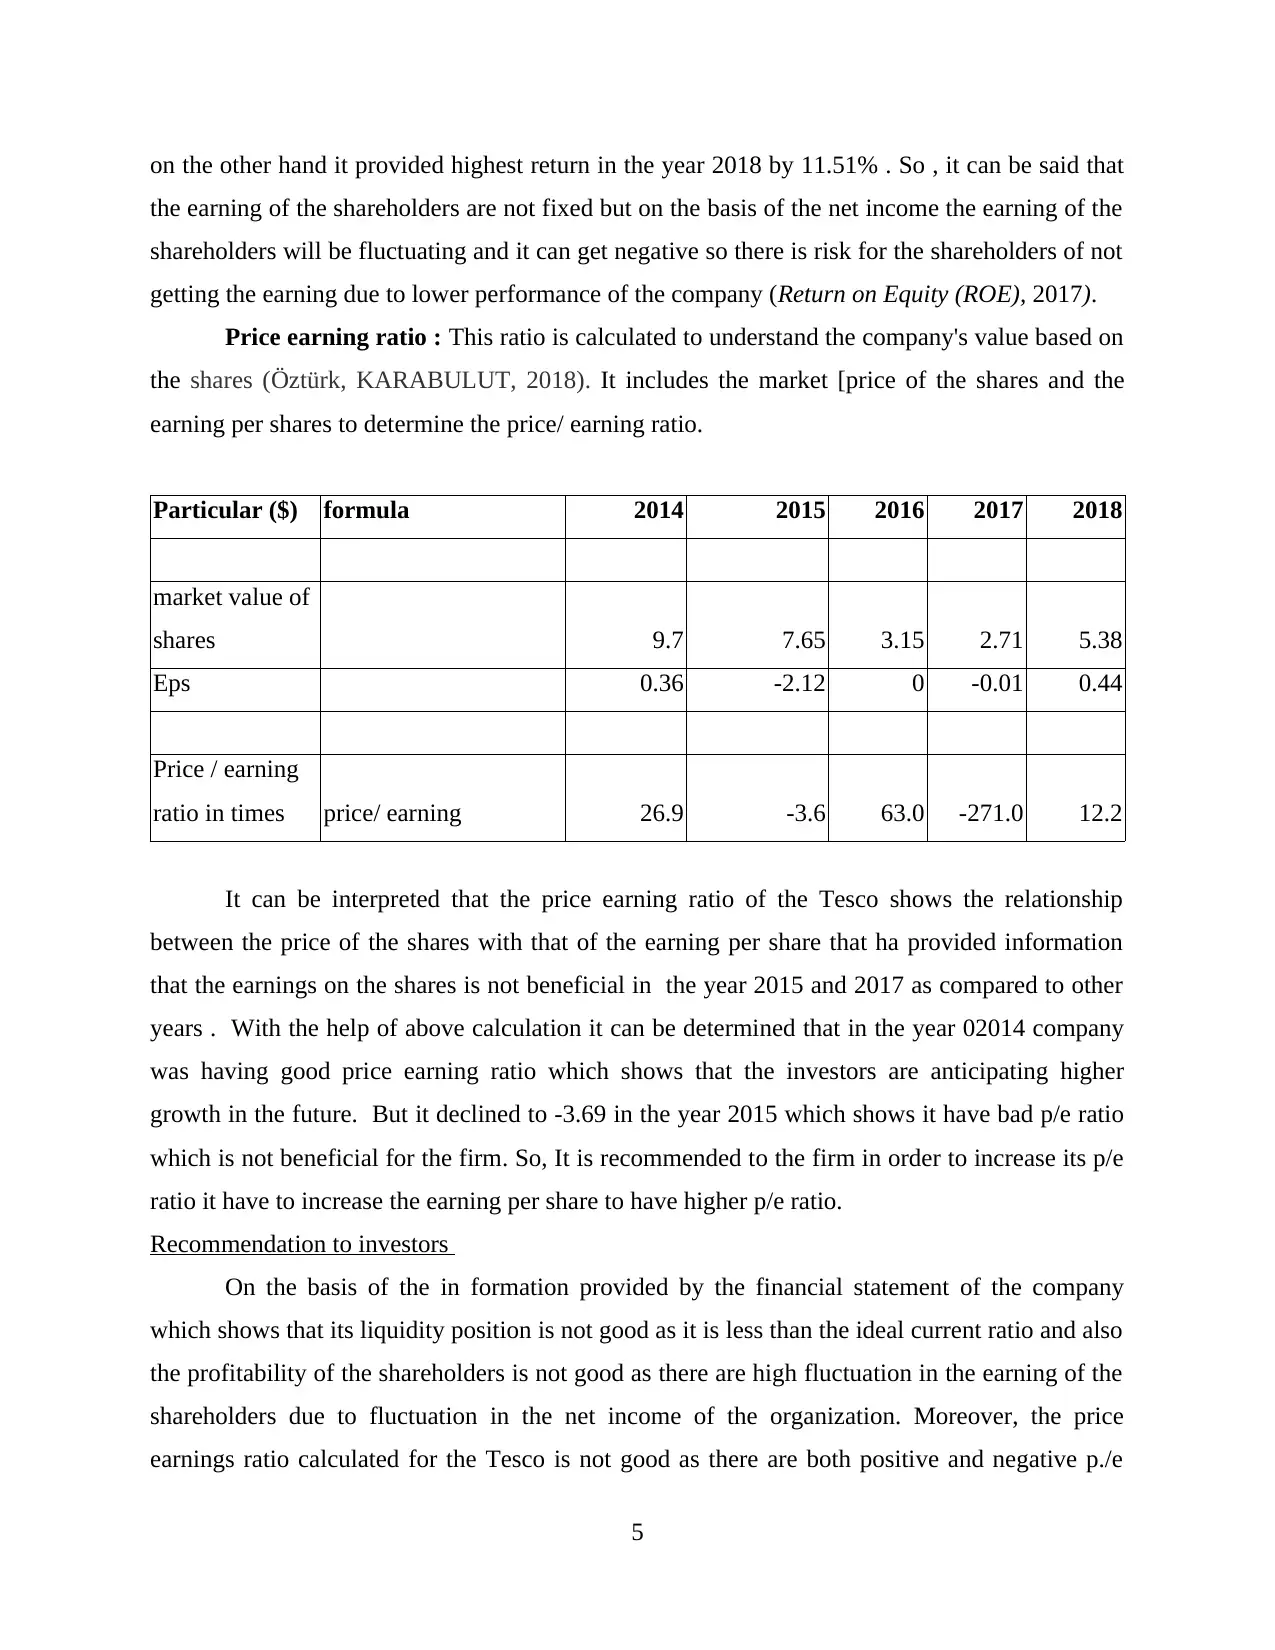
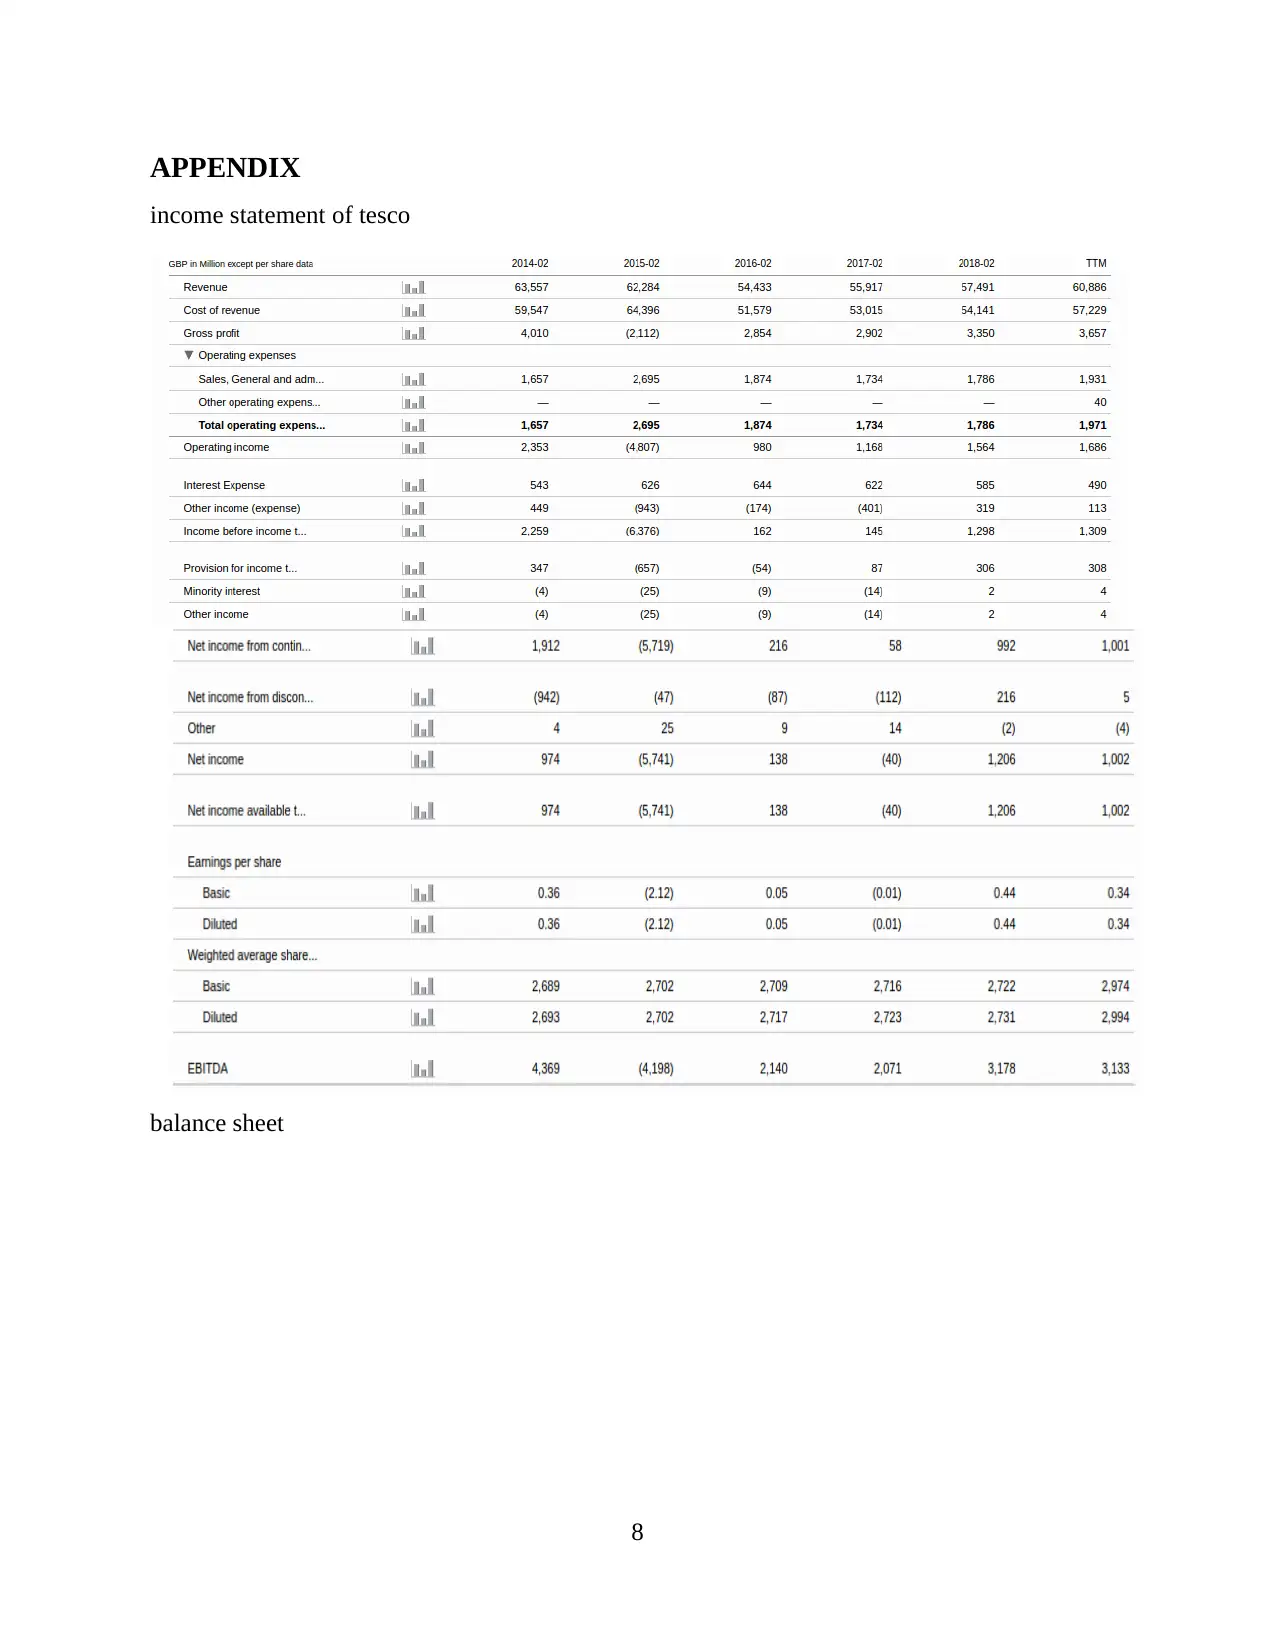
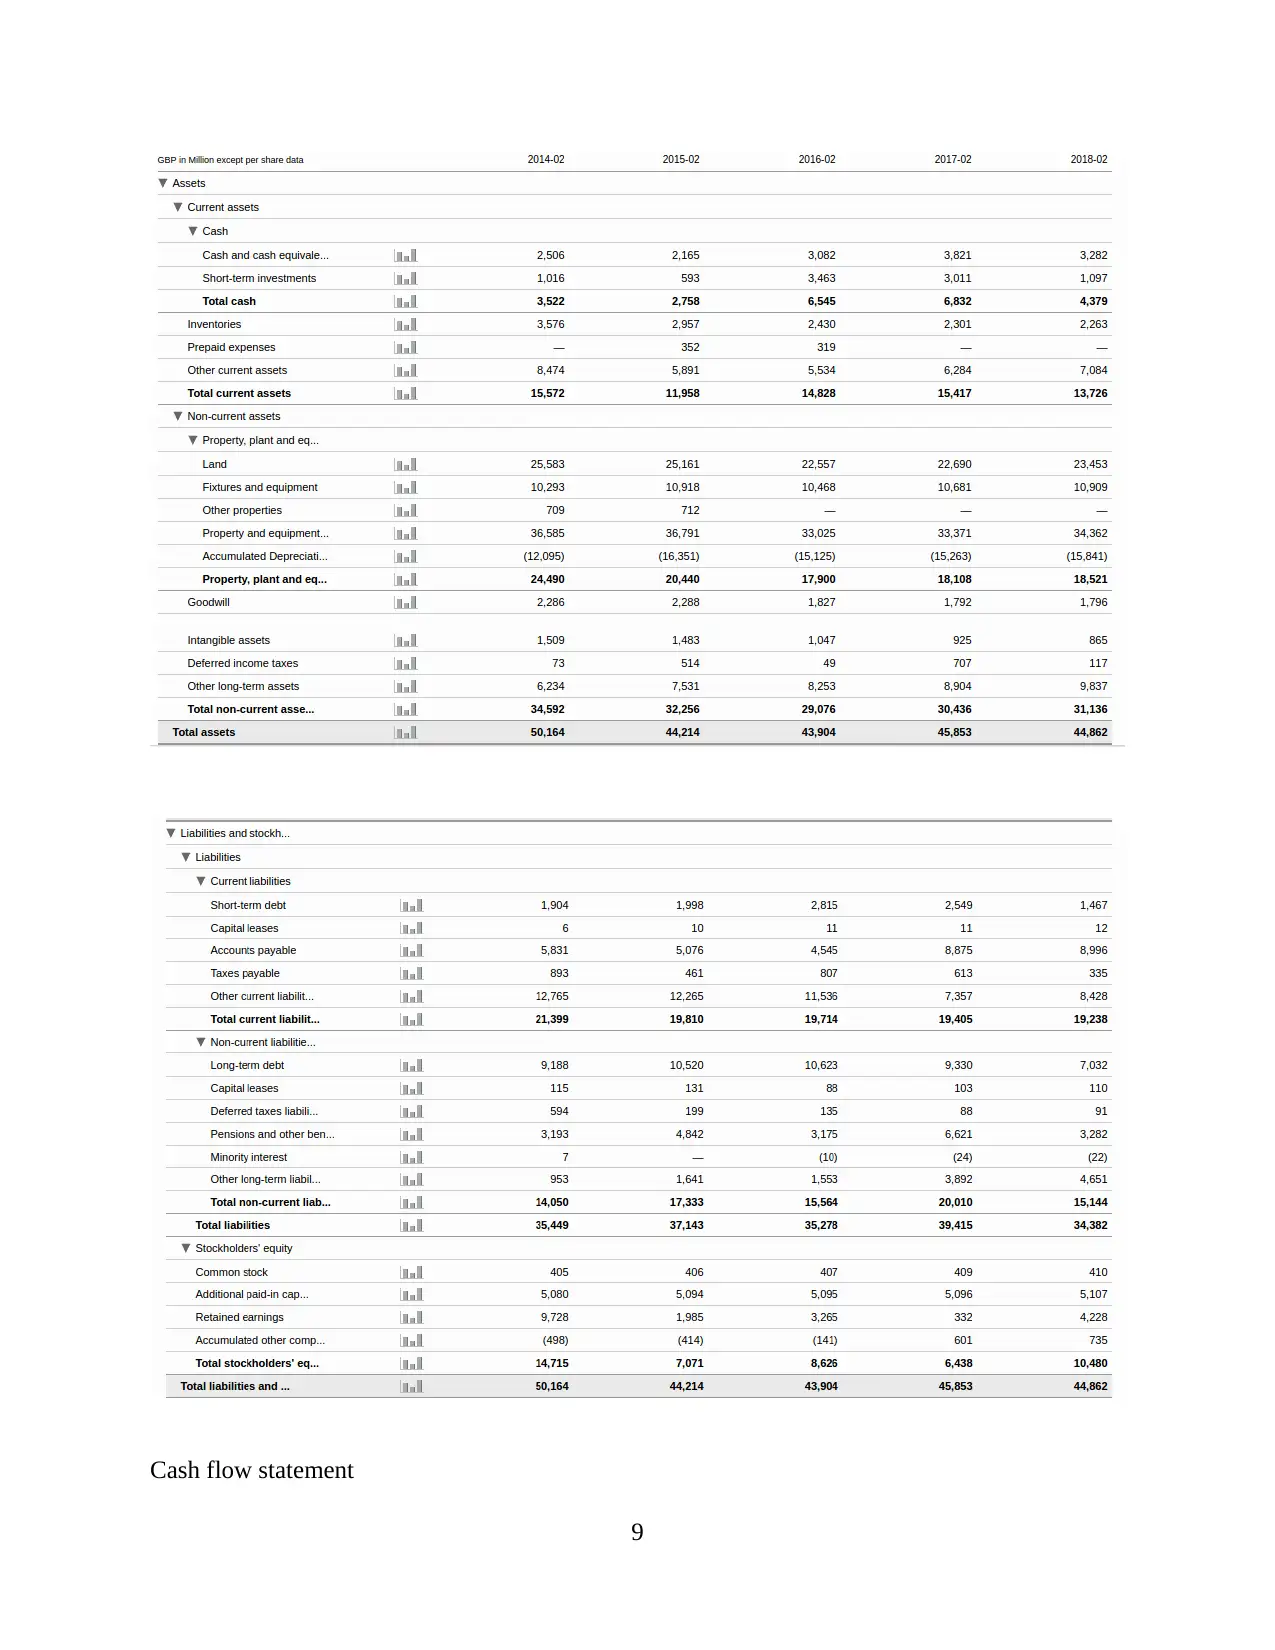
This report provides a comprehensive financial analysis of Tesco, focusing on corporate finance management and governance. The analysis includes calculations of the amount required to set aside for school fees, net present value (NPV) of a factory, and its worth after seven years. Relevant financial data for Tesco from 2014 to 2018 is examined, with calculations of key financial ratios such as the current ratio, return on equity (ROE), and price-earnings (P/E) ratio to assess the company's liquidity, profitability, and valuation. The report concludes with recommendations for investors based on the financial performance and position of Tesco, suggesting caution due to the company's fluctuating profitability and less-than-ideal liquidity, and P/E ratios. The analysis draws upon financial statements and relevant financial management principles.
Document Page
CORPORATE FINANCE
MANAGEMENT AND
GOVERNANCE
tabler-icon-diamond-filled.svg

Secure Best Marks with AI Grader

Need help grading? Try our AI Grader for instant feedback on your assignments.
Document Page
Table of Contents
INTRODUCTION...........................................................................................................................1
TASK ..............................................................................................................................................1
1. Amount required to set aside for paying school fees.........................................................1
2.a) Net present value of the factor .......................................................................................2
b) Factory worth at the end of seven year..............................................................................2
3) identify and collect relevant data of 5 years .....................................................................3
Recommendation to investors ...............................................................................................5
CALCULATION.............................................................................................................................5
REFERENCES................................................................................................................................6
APPENDIX .....................................................................................................................................7
Document Page
INTRODUCTION
Corporate finance management refers to management of financial information in the
organisation by following the principles and standard of financial management (Zietlow and
et.al., 2018). In this assignment we will consider Tesco which is biggest supermarket in UK and
provide products and services related to hyper market, convenience shop etc. it will include the
information about the Tesco operation in order to identify its financial performance and position.
TASK
1. Amount required to set aside for paying school fees
Particular ($) year p*y interest amount
12000 1 12000 0.926 11112
12000 2 24000 1.783 21396
12000 3 36000 2.577 30924
12000 4 48000 3.312 39744
12000 5 60000 3.993 47916
12000 6 72000 4.623 55476
72000 0.08
amount need
to set aside 55476
amount left
at the end 5760
49716
From the above it can be interest that The total school fees required to be paid after the
six years in 72000 which is derived from (12000*6). The interest rate provided is 8% which
means the rate at which the interest for the late payment of fess will be charged at 8%. So , in
order to identify the amount which is required to set aside for the future payment of school fees
can be derived by the net present value of the cash flow (Net present value method ,2018). It is
shown from the above calculation that each year the school fees is required to paid at 12000 and
1
Document Page
for the late payment there is interest charged at 8%. It shows that the total amount required to be
set aside is 260856 which is derived after subtracting the initial investment of 72000 from
332856.
2.a) Net present value of the factor
Particular ($) year
pv factor @ 10%
amount amount
12429 1 0.909 11298
12429 2 1.736 21577
12429 3 2.487 30911
12429 4 3.17 39400
12429 5 3.791 47118
12429 6 4.355 54128
12429 7 4.868 60504
12429 8 5.335 66309
12429 9 5.759 71579
12429 10 6.145 76376
12429 11 6.495 80726
12429 12 6.814 84691
12429 13 7.103 88283
12429 14 7.367 91564
factory cost 840000
net present value 931564
From the above calculation it can be interpreted about net present value which is the
value of the future cash flow. It is identified that the net present value of the factory is 931564
which is calculated b identifying the pv factor at 10% for the 14 years. By using the Pv factor
derive by formula of (1/1+rate^ number of years ) which provided with the factors for calculation
of net present value. The net present value is determined by adding the 14th years amount with
the factory cost to get the net present value.
2
tabler-icon-diamond-filled.svg

Secure Best Marks with AI Grader

Need help grading? Try our AI Grader for instant feedback on your assignments.
Document Page
b) Factory worth at the end of seven year
At the end of seven year the factory worth will be the present value for the remaining
years which is calculated as below :
Particular ($) year
pv factor @ 10%
amount amount
12429 1 0.909 11298
12429 2 1.736 21577
12429 3 2.487 30911
12429 4 3.17 39400
12429 5 3.791 47118
12429 6 4.355 54128
12429 7 4.868 60504
It shows that at the end of 7th year the worth of the factory is 60504 which shows that at
the end of 7th years the factory will be valued at this price.
3) identify and collect relevant data of 5 years
The following are the 5 years financial data of Tesco (Tesco PLC ADR TSCDY, 2018).
Particular ($) 2014 2015 2016 2017 2018
sales 63557 62284 54433 55917 57491
gross profit 4010 -2112 2854 2902 3350
net profit 974 -5741 138 -40 1206
current assets 15572 11958 14828 15417 13726
current liabilities 21399 19810 19714 19405 19238
shareholder equity 14715 7071 8626 6438 10480
EPS 0.36 -2.12 0 -0.01 0.44
Calculation of ratios
Current ratio : It shows the liquidity position of the firm on the basis of company'
current assets and current liabilities. The ideal current ratio is 2:1 which shows the double current
assets required for meeting the current obligation of organization.
3
Document Page
Particular ($) formula 2014 2015 2016 2017 2018
current assets 15572 11958 14828 15417 13726
current
liabilities 21399 19810 19714 19405 19238
current ratio
current asset/ current
liabilities 0.73 0.60 0.75 0.79 0.71
From the above calculation it can be interpreted that current ratio of the super market is
the highest in the year 2017 and the lowest in the year 2015. Current ratio determined by the
data provided through the financial statement of Tesco shown that its liquidity position is not
good because the ideal current ratio is 2: 1 which shows that the company have the ability to pay
of its current obligation with the help of its current assets. The liquidity position of the firm is not
good because its capability to meet its current obligation is not good as shown by the current
ratio of the last 5 years of Tesco. In the year 2018, The current ratio of the company was 0.71
that is less than the ideal current ratio so the liquidity position is not good of this company.
Return on equity : It shows the return on the shareholder's equity by identifying the net
profitability of the firm and dividing the net profit by the shareholder's equity will assist in
identifying the profitability of the firm (Hasbullah, Adam and Hamdam, 2018).
Particular ($) formula 2014 2015 2016 2017 2018
net income 974 -5741 138 -40 1206
shareholder
equity 14715 7071 8626 6438 10480
return on
equity in%
net income /
shareholder's equity 6.62 -81.19 1.60 -0.62 11.51
From the above determination of the return on equity it is identified that the return of the
shareholders equity were about 6.62% in the year 2014 but is got negative in the year 2015
which shows that the ability of the firm to pay higher earning to its shareholders is not good. But
4
Document Page
on the other hand it provided highest return in the year 2018 by 11.51% . So , it can be said that
the earning of the shareholders are not fixed but on the basis of the net income the earning of the
shareholders will be fluctuating and it can get negative so there is risk for the shareholders of not
getting the earning due to lower performance of the company (Return on Equity (ROE), 2017).
Price earning ratio : This ratio is calculated to understand the company's value based on
the shares (Öztürk, KARABULUT, 2018). It includes the market [price of the shares and the
earning per shares to determine the price/ earning ratio.
Particular ($) formula 2014 2015 2016 2017 2018
market value of
shares 9.7 7.65 3.15 2.71 5.38
Eps 0.36 -2.12 0 -0.01 0.44
Price / earning
ratio in times price/ earning 26.9 -3.6 63.0 -271.0 12.2
It can be interpreted that the price earning ratio of the Tesco shows the relationship
between the price of the shares with that of the earning per share that ha provided information
that the earnings on the shares is not beneficial in the year 2015 and 2017 as compared to other
years . With the help of above calculation it can be determined that in the year 02014 company
was having good price earning ratio which shows that the investors are anticipating higher
growth in the future. But it declined to -3.69 in the year 2015 which shows it have bad p/e ratio
which is not beneficial for the firm. So, It is recommended to the firm in order to increase its p/e
ratio it have to increase the earning per share to have higher p/e ratio.
Recommendation to investors
On the basis of the in formation provided by the financial statement of the company
which shows that its liquidity position is not good as it is less than the ideal current ratio and also
the profitability of the shareholders is not good as there are high fluctuation in the earning of the
shareholders due to fluctuation in the net income of the organization. Moreover, the price
earnings ratio calculated for the Tesco is not good as there are both positive and negative p./e
5
tabler-icon-diamond-filled.svg

Paraphrase This Document

Need a fresh take? Get an instant paraphrase of this document with our AI Paraphraser
Document Page
ratio shows in different years which is due to the negative earnings per share. So, the investors in
order to invest in this firm are suggested to identify more information about the firm through use
of various other ratios such as net profit ratio and other ratio can make the decision regarding
investing in this firm. On the basis of above information, it is recommended to investors that they
should not invest in this company.
CALCULATION
From the above assignment it has concluded about the the net present value which is
calculated to determine the present value of the future cash flows. Moreover, it has involved
information about the financial performance and profitability of Tesco on the basis of ratio
analysis which has shows that the company is not performing well ton their potential as it has
less current ratio which shows it does not have adequate current assets to pay off its liabilities.
Also, It have less profitability shows by the return on equity it shows that return on equity are
not adequate.
6
Document Page
REFERENCES
Books and Journals
Hasbullah, H., Adam, M. and Hamdam, U., 2018. PENGARUH CURRENT RATIO, TOTAL
ASSET TURNOVER, DEBT TO EQUITY RATIO, DAN WORKING CAPITAL
TURNOVER TERHADAP RETURN SAHAM DENGAN RETURN ON ASSET
SEBAGAI VARIABEL MODERATING PADA PERUSAHAAN LQ45. JEMBATAN.
14(1). pp.13-24.
Öztürk, H. and KARABULUT, A., 2018. The Relationship between Earnings-to-Price, Current
Ratio, Profit Margin and Return: An Empirical Analysis on Istanbul Stock Exchange.
Accounting and Finance Research. 7(1). pp.109-115.
Zietlow, J. and et.al., 2018. Financial management for nonprofit organizations: policies and
practices. John Wiley & Sons.
Online
Return on Equity (ROE). 2017.[Online]. Available through
:<https://investinganswers.com/financial-dictionary/financial-statement-analysis/return-
equity-roe-916>
Tesco PLC ADR TSCDY. 2018.[Online]. Available through
:<http://financials.morningstar.com/balance-sheet/bs.html?
t=TSCDY&region=usa&culture=en-US>
Net present value method . 2018.[Online]. Available through
:<https://www.accountingformanagement.org/net-present-value-method/>
7
Document Page
APPENDIX
income statement of tesco
balance sheet
8
tabler-icon-diamond-filled.svg

Secure Best Marks with AI Grader

Need help grading? Try our AI Grader for instant feedback on your assignments.
Document Page
Cash flow statement
9
chevron_up_icon
1 out of 11
circle_padding
hide_on_mobile
zoom_out_icon
logo.png

Your All-in-One AI-Powered Toolkit for Academic Success.

Available 24*7 on WhatsApp / Email

[object Object]