Comprehensive Financial Performance Analysis and Evaluation of Tesco
VerifiedAdded on 2019/12/04
|16
|3954
|203
Report
AI Summary
This report presents a comprehensive financial analysis of Tesco, a multinational retail company. It begins with an introduction to financial management and the rationale for selecting Tesco, highlighting its market position and growth. The core of the report involves a detailed performance analysis, focusing on profitability ratios (gross profit, net profit), liquidity ratios (current ratio, quick ratio), working capital, and capital structure (debt-equity ratio) over a five-year period. The analysis includes calculations, interpretations, and comparisons to assess Tesco's financial health and efficiency. Furthermore, the report evaluates Tesco's stock market performance, providing insights into its market share and trends. It concludes by acknowledging the limitations of ratio analysis and offering recommendations for improvement.
FINANCIAL MANAGEMENT AND
ANALYSIS
ANALYSIS
Paraphrase This Document
Need a fresh take? Get an instant paraphrase of this document with our AI Paraphraser
TABLE OF CONTENTS
INTRODUCTION...........................................................................................................................1
RATIONALE OF TESCO...............................................................................................................1
PERFORMANCE ANALYSIS.......................................................................................................2
Profitability Ratios..................................................................................................................2
Liquidity ratios.......................................................................................................................4
Working Capital Ratio............................................................................................................6
Capital Structure.....................................................................................................................7
Stock Market Performance.....................................................................................................9
LIMITATION OF RATIO ANALYSIS........................................................................................10
CONCLUSION AND RECOMMENDATION.............................................................................11
Conclusion............................................................................................................................11
Recommendation..................................................................................................................12
REFERENCES..............................................................................................................................13
1
TABLE OF FIGURES
Figure 1 Working Capital................................................................................................................8
Figure 2Capital Structure.................................................................................................................9
Figure 3 Stock market performance of Tesco................................................................................10
2
⊘ This is a preview!⊘
Do you want full access?
Subscribe today to unlock all pages.
Trusted by 1+ million students worldwide
INTRODUCTION
Financial management is the arrangement of funds with an aim to achieve desired
objective of the organisation in an effective and efficient manner. This is the differentiated
function that is associated with the top management (Ahrendsen and Katchova, 2012). The main
purpose of preparing this report is to determine the financial position of the company by
calculating various ratios. In addition to this, impact of legal, political, economic and tax changes
on the financial statements of the company is also evaluated. Along with this, the other purpose
of preparing this report is to find out the stock market performance of the company. In regard to
all this, weakness of ratio analysis will be assessed to improve the same. In order to study the
financial statements of the company, ratio analysis has been done by using various secondary
data sources like internet, books and journals.
The main purpose of choosing Tesco is to determine the financial performance of the
company for the last five years. Tesco is a multinational company of UK which deals in all types
of consumer goods.
RATIONALE BEHIND CHOOSING TESCO
In the following report, Tesco has been taken into consideration. It is a multinational
retail and grocery company which deals in all types of consumer products. It is the third largest
retail company headquartered in Welwyn Garden City, Hertfordshire. This company is a public
limited company listed on London Stock exchange. This company was founded in 1919 by Jack
Cohen. In the year 1990, Tesco has repositioned its structure and move on from state down-
market and low-cost retailer (Tesco PLC ADR, 2015). This in turn proves to be very successful
for the company. Tesco had a market capitalization of around £18.1 billion up to 22 April 2015.
Tesco is one of the fastest growing companies in retail industry. It is continuously
providing new and innovative consumer goods which in turn attract the large number of
customer. As it is a growing company so analysing the financial statements of this company will
prove to be very beneficial for us. Another reason of using this company is to analyse its
financial position and to decide whether investing in this company prove to be beneficial or not.
It is one of the growing industries which in turn will provide lot of reliable data in order to
analyse the financial performance of various industry. In addition to this, retail industry is one of
3
Paraphrase This Document
Need a fresh take? Get an instant paraphrase of this document with our AI Paraphraser
the fastest growing company which in turn will help to find out the latest trend that are taking
place in the corporate world.
PERFORMANCE ANALYSIS
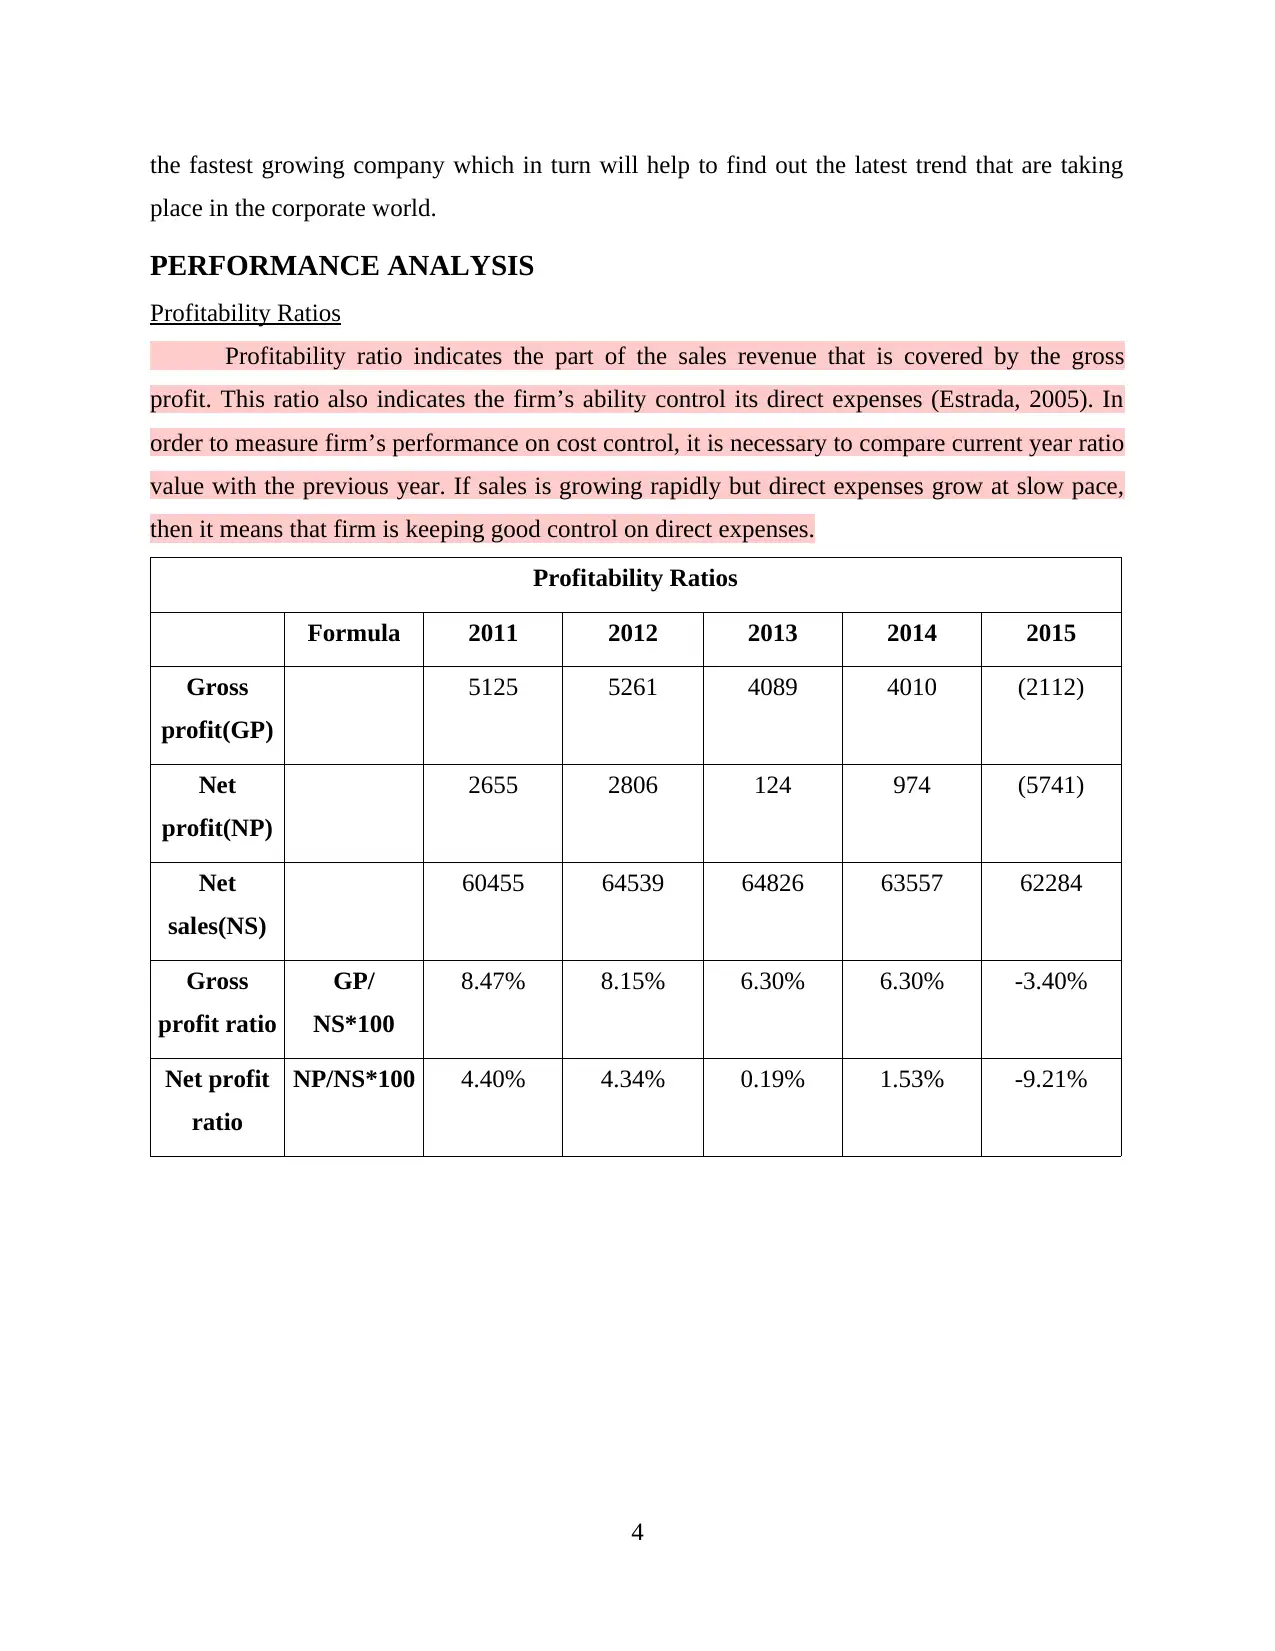
Profitability Ratios
Profitability ratio indicates the part of the sales revenue that is covered by the gross
profit. This ratio also indicates the firm’s ability control its direct expenses (Estrada, 2005). In
order to measure firm’s performance on cost control, it is necessary to compare current year ratio
value with the previous year. If sales is growing rapidly but direct expenses grow at slow pace,
then it means that firm is keeping good control on direct expenses.
Profitability Ratios
Formula 2011 2012 2013 2014 2015
Gross
profit(GP)
5125 5261 4089 4010 (2112)
Net
profit(NP)
2655 2806 124 974 (5741)
Net
sales(NS)
60455 64539 64826 63557 62284
Gross
profit ratio
GP/
NS*100
8.47% 8.15% 6.30% 6.30% -3.40%
Net profit
ratio
NP/NS*100 4.40% 4.34% 0.19% 1.53% -9.21%
4
place in the corporate world.
PERFORMANCE ANALYSIS
Profitability Ratios
Profitability ratio indicates the part of the sales revenue that is covered by the gross
profit. This ratio also indicates the firm’s ability control its direct expenses (Estrada, 2005). In
order to measure firm’s performance on cost control, it is necessary to compare current year ratio
value with the previous year. If sales is growing rapidly but direct expenses grow at slow pace,
then it means that firm is keeping good control on direct expenses.
Profitability Ratios
Formula 2011 2012 2013 2014 2015
Gross
profit(GP)
5125 5261 4089 4010 (2112)
Net
profit(NP)
2655 2806 124 974 (5741)
Net
sales(NS)
60455 64539 64826 63557 62284
Gross
profit ratio
GP/
NS*100
8.47% 8.15% 6.30% 6.30% -3.40%
Net profit
ratio
NP/NS*100 4.40% 4.34% 0.19% 1.53% -9.21%
4
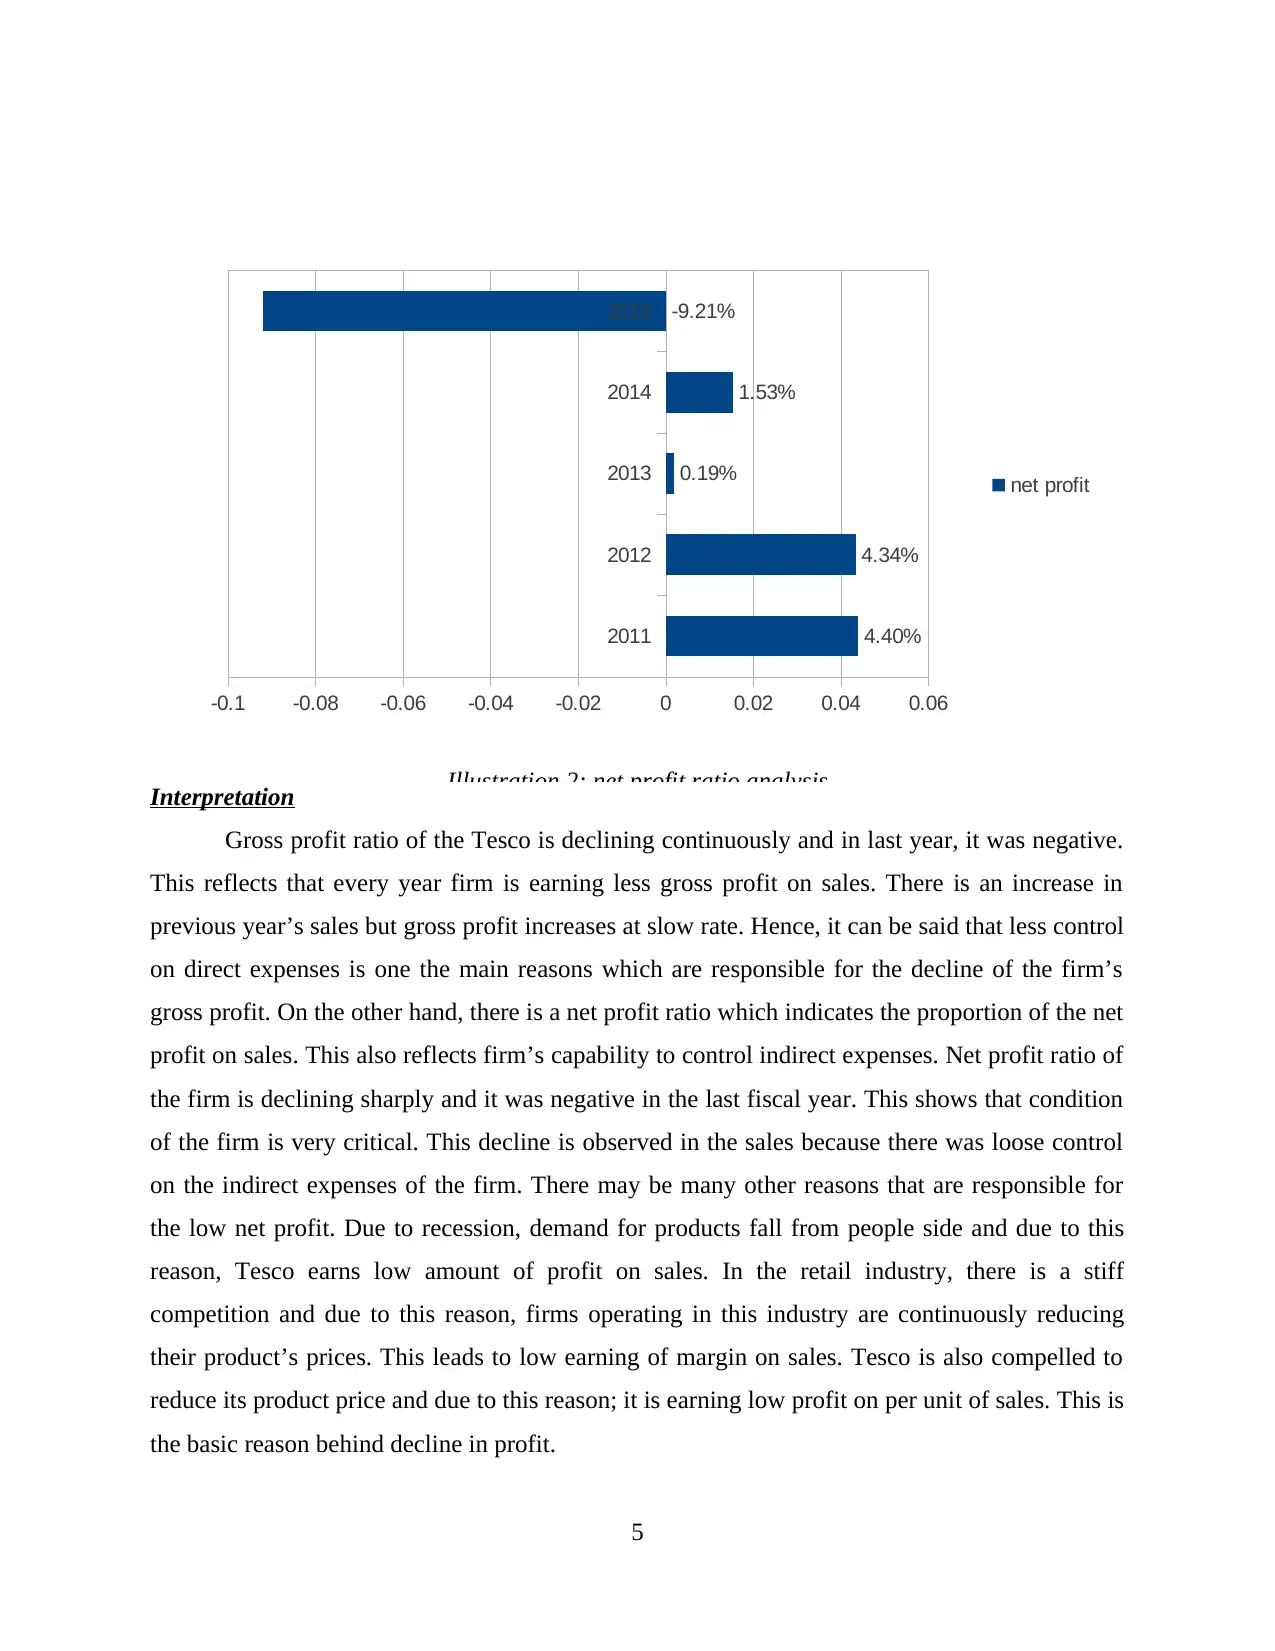
Interpretation
Gross profit ratio of the Tesco is declining continuously and in last year, it was negative.
This reflects that every year firm is earning less gross profit on sales. There is an increase in
previous year’s sales but gross profit increases at slow rate. Hence, it can be said that less control
on direct expenses is one the main reasons which are responsible for the decline of the firm’s
gross profit. On the other hand, there is a net profit ratio which indicates the proportion of the net
profit on sales. This also reflects firm’s capability to control indirect expenses. Net profit ratio of
the firm is declining sharply and it was negative in the last fiscal year. This shows that condition
of the firm is very critical. This decline is observed in the sales because there was loose control
on the indirect expenses of the firm. There may be many other reasons that are responsible for
the low net profit. Due to recession, demand for products fall from people side and due to this
reason, Tesco earns low amount of profit on sales. In the retail industry, there is a stiff
competition and due to this reason, firms operating in this industry are continuously reducing
their product’s prices. This leads to low earning of margin on sales. Tesco is also compelled to
reduce its product price and due to this reason; it is earning low profit on per unit of sales. This is
the basic reason behind decline in profit.
5
2011 2012 2013 2014 2015
-0.04
-0.02
0
0.02
0.04
0.06
0.08
0.1
8.47% 8.15%
6.30% 6.30%
-3.40%
gross profit
Illustration 1: gross profit ratio analysis
2011
2012
2013
2014
2015
-0.1 -0.08 -0.06 -0.04 -0.02 0 0.02 0.04 0.06
4.40%
4.34%
0.19%
1.53%
-9.21%
net profit
Illustration 2: net profit ratio analysis
⊘ This is a preview!⊘
Do you want full access?
Subscribe today to unlock all pages.
Trusted by 1+ million students worldwide
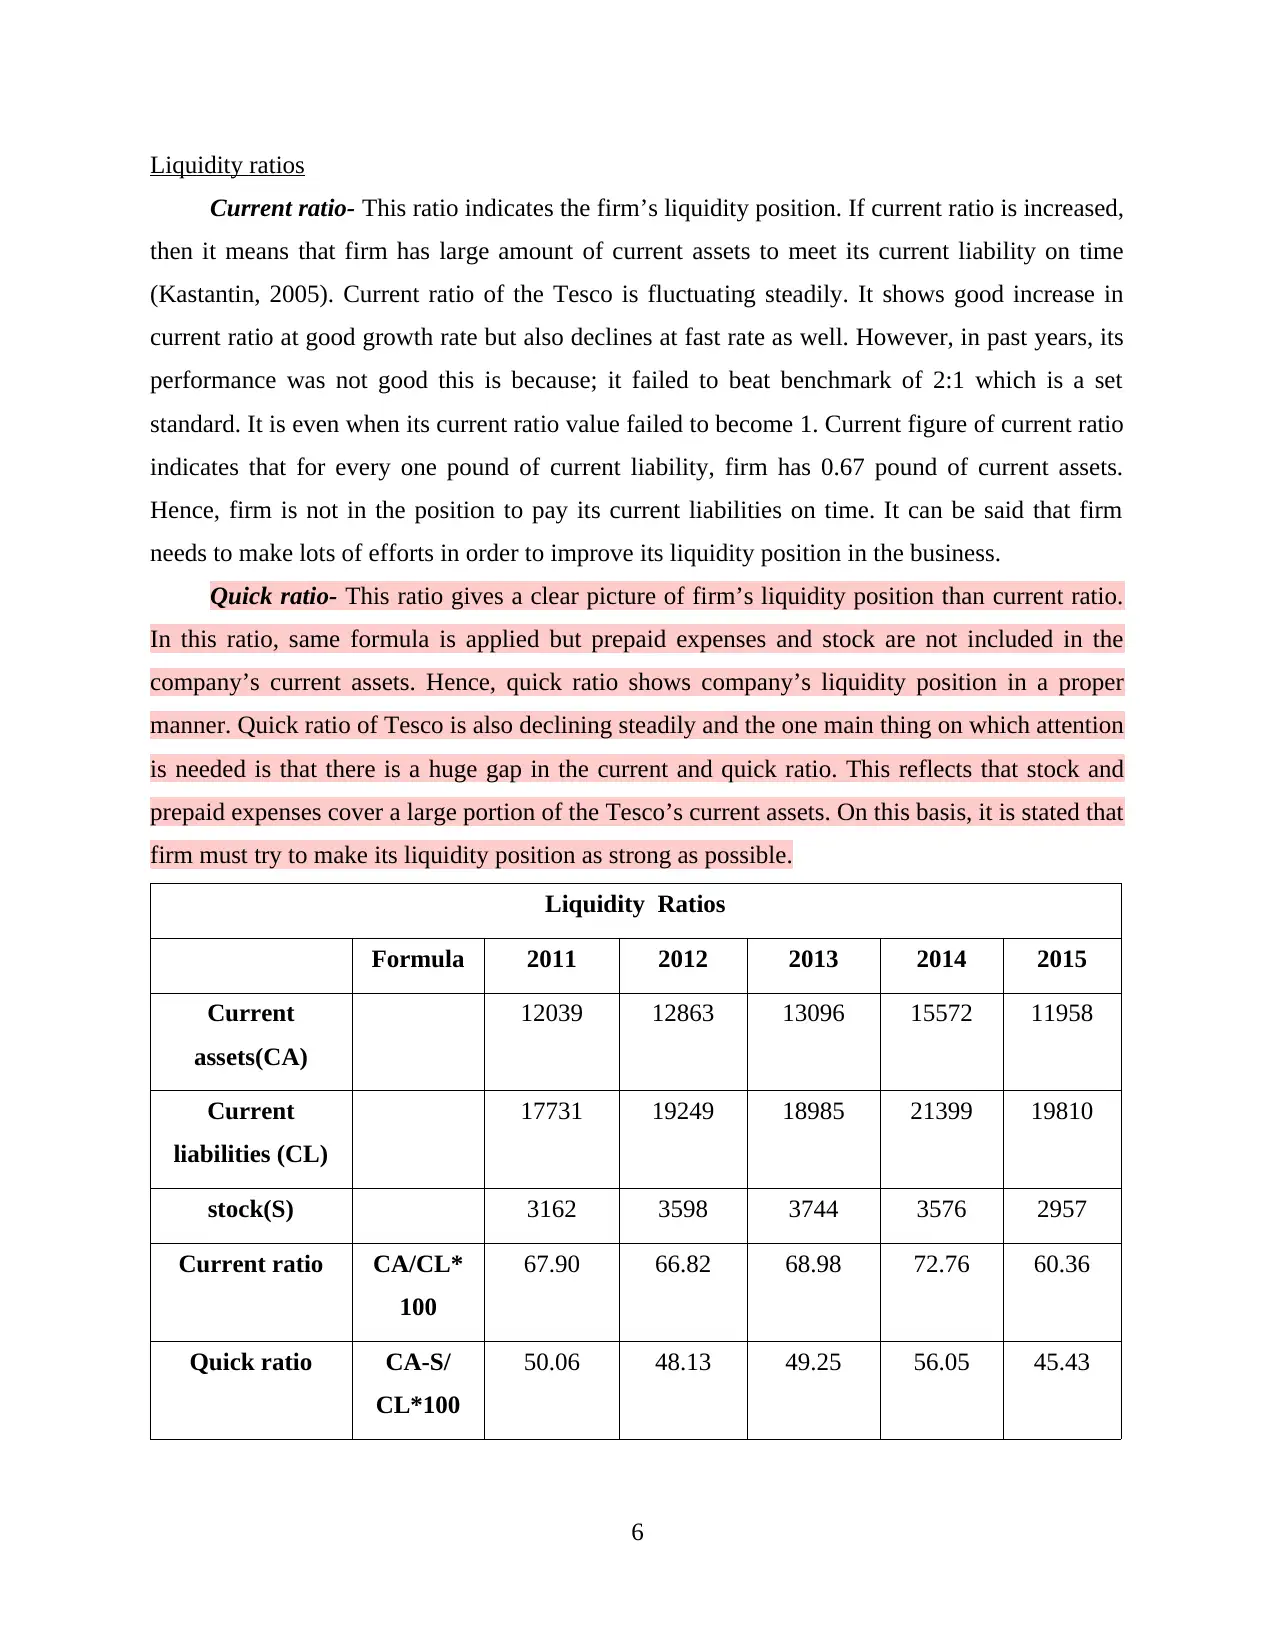
Liquidity ratios
Current ratio- This ratio indicates the firm’s liquidity position. If current ratio is increased,
then it means that firm has large amount of current assets to meet its current liability on time
(Kastantin, 2005). Current ratio of the Tesco is fluctuating steadily. It shows good increase in
current ratio at good growth rate but also declines at fast rate as well. However, in past years, its
performance was not good this is because; it failed to beat benchmark of 2:1 which is a set
standard. It is even when its current ratio value failed to become 1. Current figure of current ratio
indicates that for every one pound of current liability, firm has 0.67 pound of current assets.
Hence, firm is not in the position to pay its current liabilities on time. It can be said that firm
needs to make lots of efforts in order to improve its liquidity position in the business.
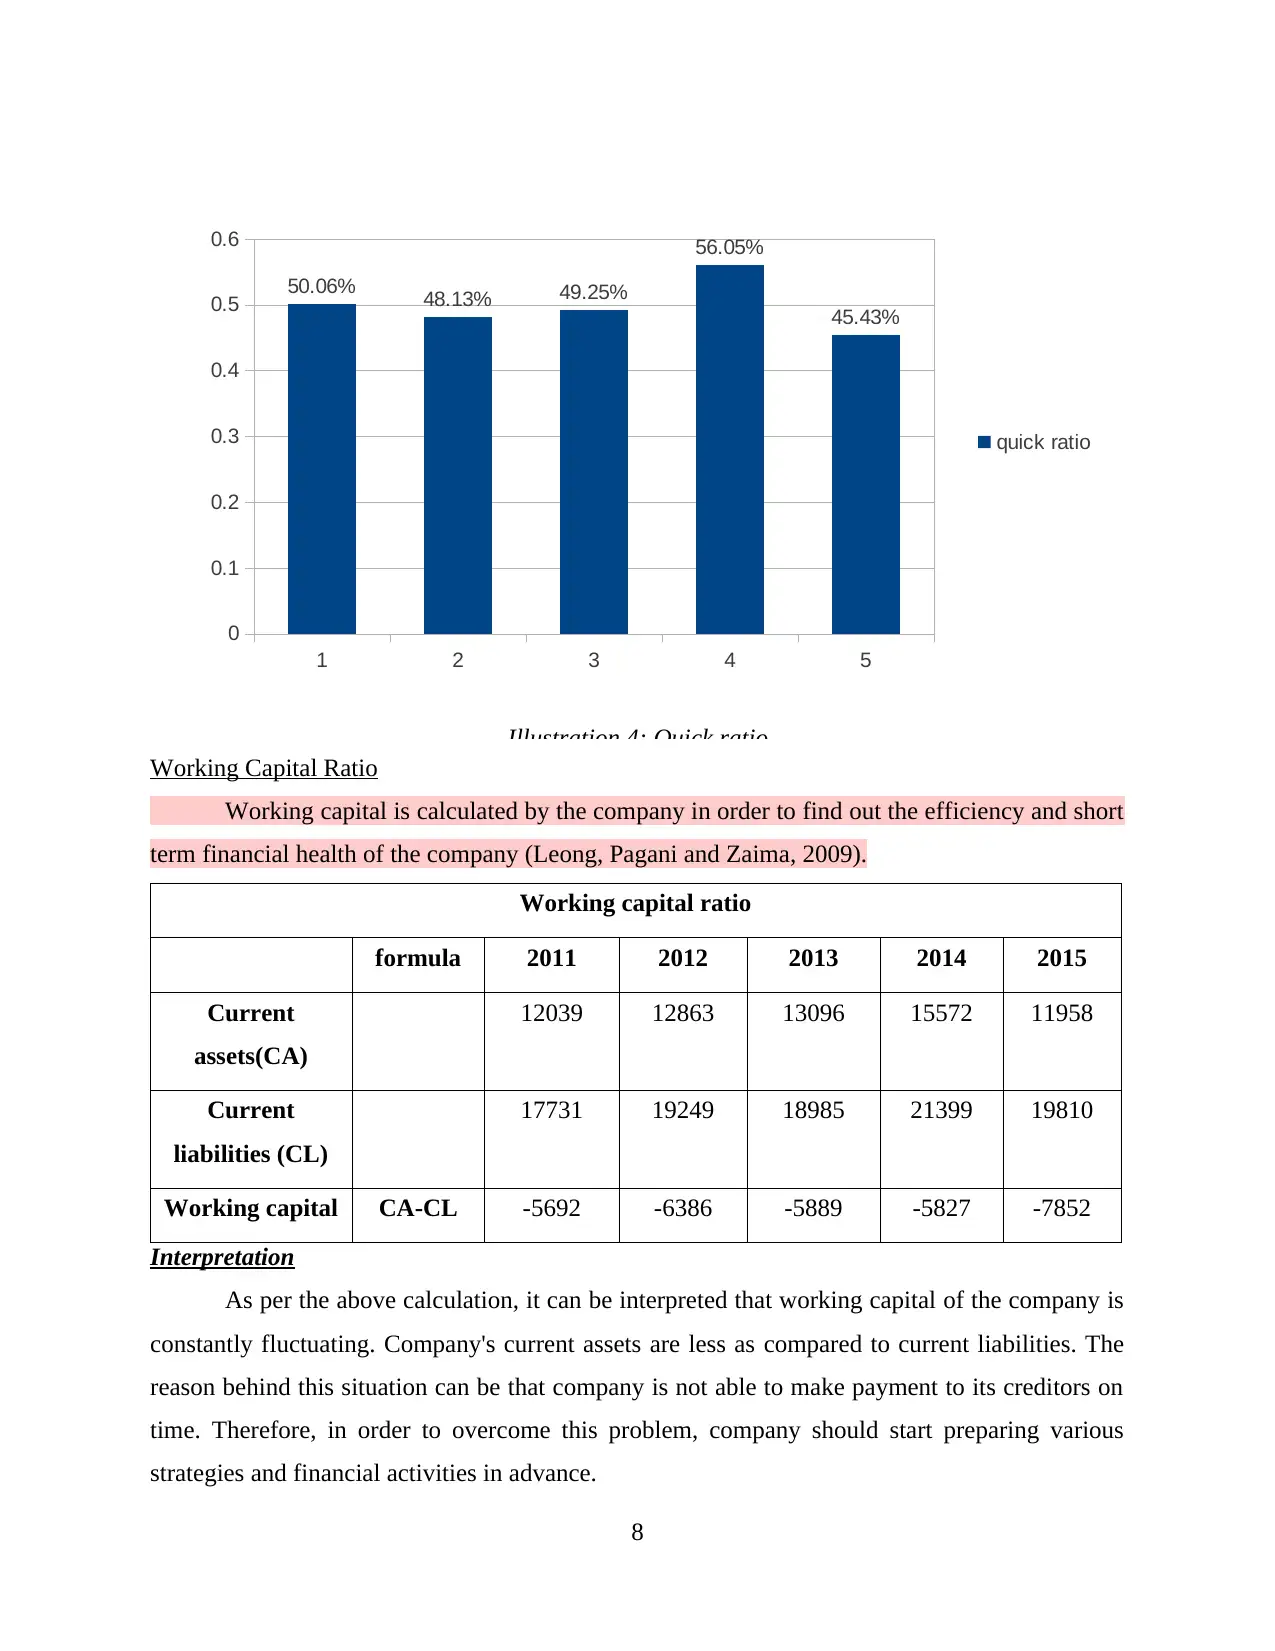
Quick ratio- This ratio gives a clear picture of firm’s liquidity position than current ratio.
In this ratio, same formula is applied but prepaid expenses and stock are not included in the
company’s current assets. Hence, quick ratio shows company’s liquidity position in a proper
manner. Quick ratio of Tesco is also declining steadily and the one main thing on which attention
is needed is that there is a huge gap in the current and quick ratio. This reflects that stock and
prepaid expenses cover a large portion of the Tesco’s current assets. On this basis, it is stated that
firm must try to make its liquidity position as strong as possible.
Liquidity Ratios
Formula 2011 2012 2013 2014 2015
Current
assets(CA)
12039 12863 13096 15572 11958
Current
liabilities (CL)
17731 19249 18985 21399 19810
stock(S) 3162 3598 3744 3576 2957
Current ratio CA/CL*
100
67.90 66.82 68.98 72.76 60.36
Quick ratio CA-S/
CL*100
50.06 48.13 49.25 56.05 45.43
6
Current ratio- This ratio indicates the firm’s liquidity position. If current ratio is increased,
then it means that firm has large amount of current assets to meet its current liability on time
(Kastantin, 2005). Current ratio of the Tesco is fluctuating steadily. It shows good increase in
current ratio at good growth rate but also declines at fast rate as well. However, in past years, its
performance was not good this is because; it failed to beat benchmark of 2:1 which is a set
standard. It is even when its current ratio value failed to become 1. Current figure of current ratio
indicates that for every one pound of current liability, firm has 0.67 pound of current assets.
Hence, firm is not in the position to pay its current liabilities on time. It can be said that firm
needs to make lots of efforts in order to improve its liquidity position in the business.
Quick ratio- This ratio gives a clear picture of firm’s liquidity position than current ratio.
In this ratio, same formula is applied but prepaid expenses and stock are not included in the
company’s current assets. Hence, quick ratio shows company’s liquidity position in a proper
manner. Quick ratio of Tesco is also declining steadily and the one main thing on which attention
is needed is that there is a huge gap in the current and quick ratio. This reflects that stock and
prepaid expenses cover a large portion of the Tesco’s current assets. On this basis, it is stated that
firm must try to make its liquidity position as strong as possible.
Liquidity Ratios
Formula 2011 2012 2013 2014 2015
Current
assets(CA)
12039 12863 13096 15572 11958
Current
liabilities (CL)
17731 19249 18985 21399 19810
stock(S) 3162 3598 3744 3576 2957
Current ratio CA/CL*
100
67.90 66.82 68.98 72.76 60.36
Quick ratio CA-S/
CL*100
50.06 48.13 49.25 56.05 45.43
6
Paraphrase This Document
Need a fresh take? Get an instant paraphrase of this document with our AI Paraphraser
7
2011 2012 2013 2014 2015
0
0.1
0.2
0.3
0.4
0.5
0.6
0.7
0.8
67.90% 66.82% 68.98% 72.76%
60.36%
current ratio
Illustration 3: Current ratio
2011 2012 2013 2014 2015
0
0.1
0.2
0.3
0.4
0.5
0.6
0.7
0.8
67.90% 66.82% 68.98% 72.76%
60.36%
current ratio
Illustration 3: Current ratio
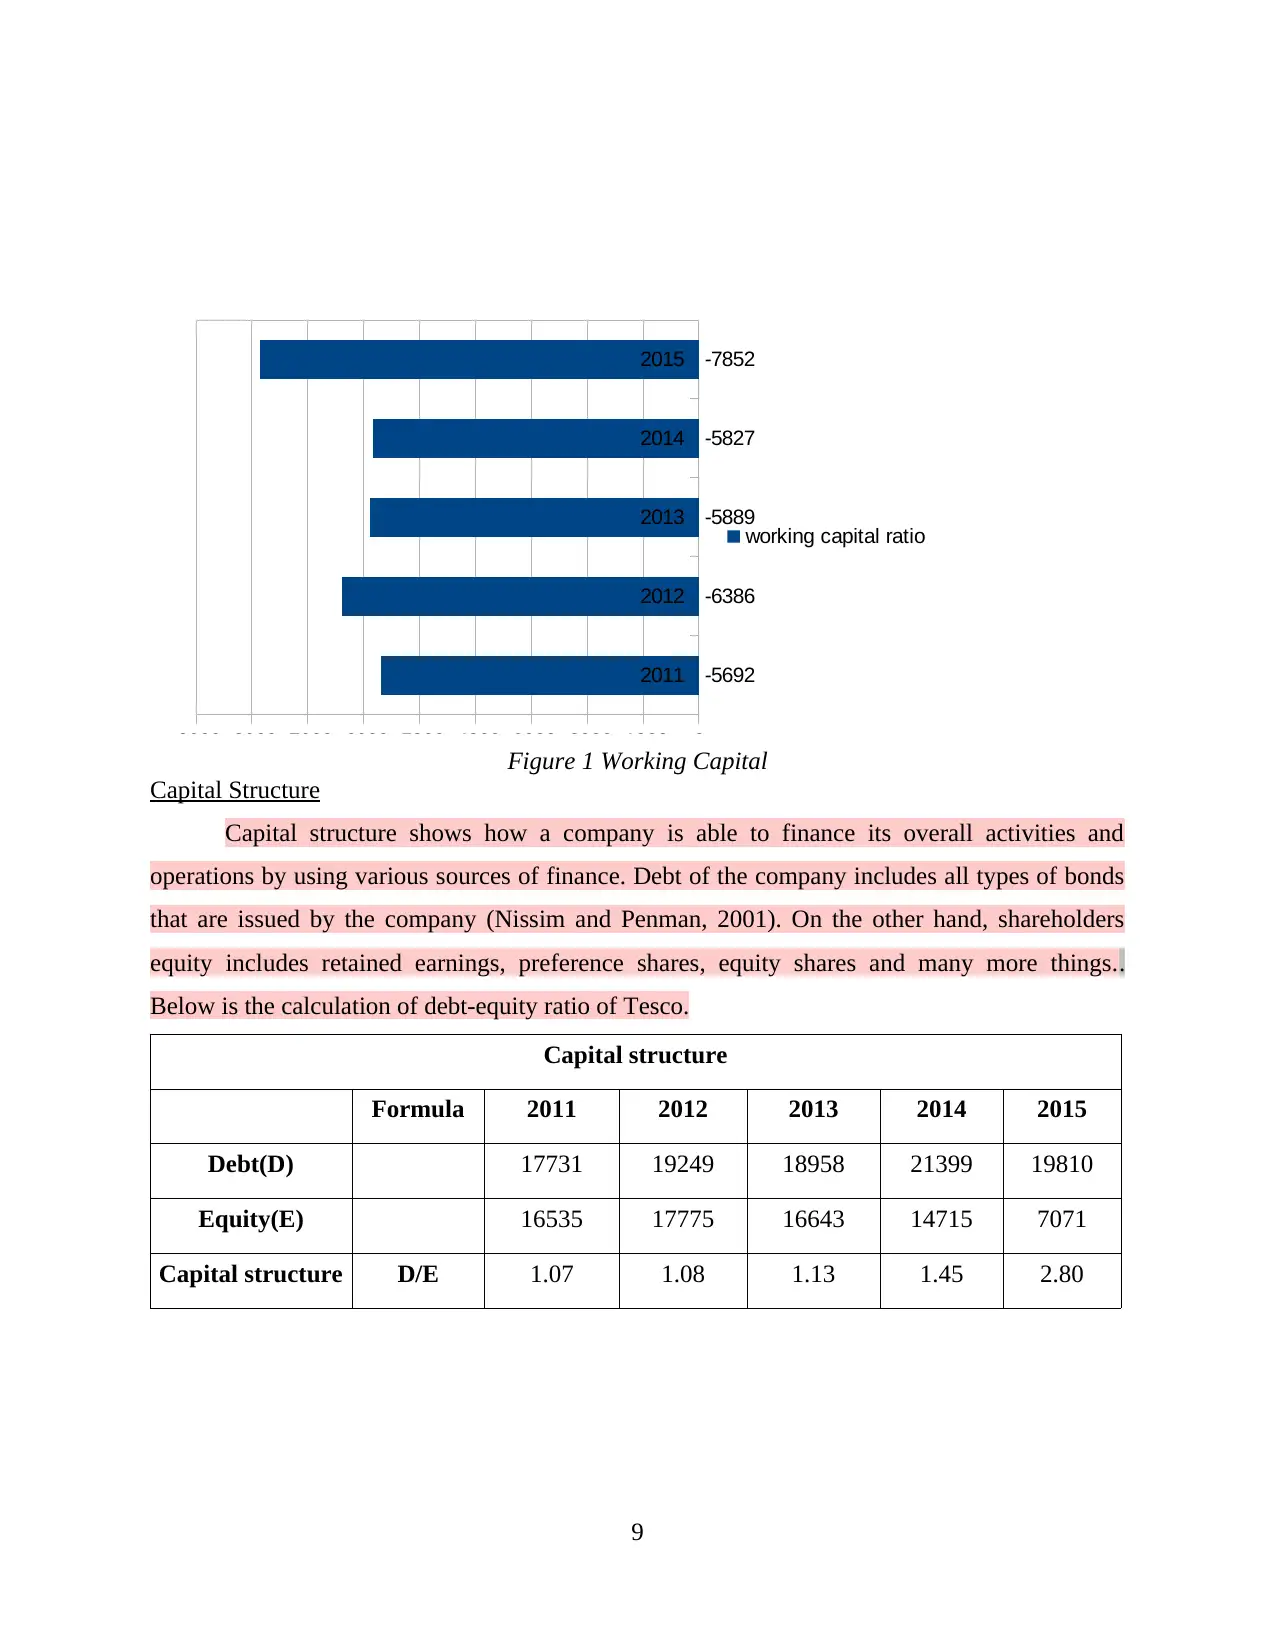
Working Capital Ratio
Working capital is calculated by the company in order to find out the efficiency and short
term financial health of the company (Leong, Pagani and Zaima, 2009).
Working capital ratio
formula 2011 2012 2013 2014 2015
Current
assets(CA)
12039 12863 13096 15572 11958
Current
liabilities (CL)
17731 19249 18985 21399 19810
Working capital CA-CL -5692 -6386 -5889 -5827 -7852
Interpretation
As per the above calculation, it can be interpreted that working capital of the company is
constantly fluctuating. Company's current assets are less as compared to current liabilities. The
reason behind this situation can be that company is not able to make payment to its creditors on
time. Therefore, in order to overcome this problem, company should start preparing various
strategies and financial activities in advance.
8
1 2 3 4 5
0
0.1
0.2
0.3
0.4
0.5
0.6
50.06% 48.13% 49.25%
56.05%
45.43%
quick ratio
Illustration 4: Quick ratio
⊘ This is a preview!⊘
Do you want full access?
Subscribe today to unlock all pages.
Trusted by 1+ million students worldwide
Capital Structure
Capital structure shows how a company is able to finance its overall activities and
operations by using various sources of finance. Debt of the company includes all types of bonds
that are issued by the company (Nissim and Penman, 2001). On the other hand, shareholders
equity includes retained earnings, preference shares, equity shares and many more things..
Below is the calculation of debt-equity ratio of Tesco.
Capital structure
Formula 2011 2012 2013 2014 2015
Debt(D) 17731 19249 18958 21399 19810
Equity(E) 16535 17775 16643 14715 7071
Capital structure D/E 1.07 1.08 1.13 1.45 2.80
9
2011
2012
2013
2014
2015
-9000 -8000 -7000 -6000 -5000 -4000 -3000 -2000 -1000 0
-5692
-6386
-5889
-5827
-7852
working capital ratio
Figure 1 Working Capital
Paraphrase This Document
Need a fresh take? Get an instant paraphrase of this document with our AI Paraphraser
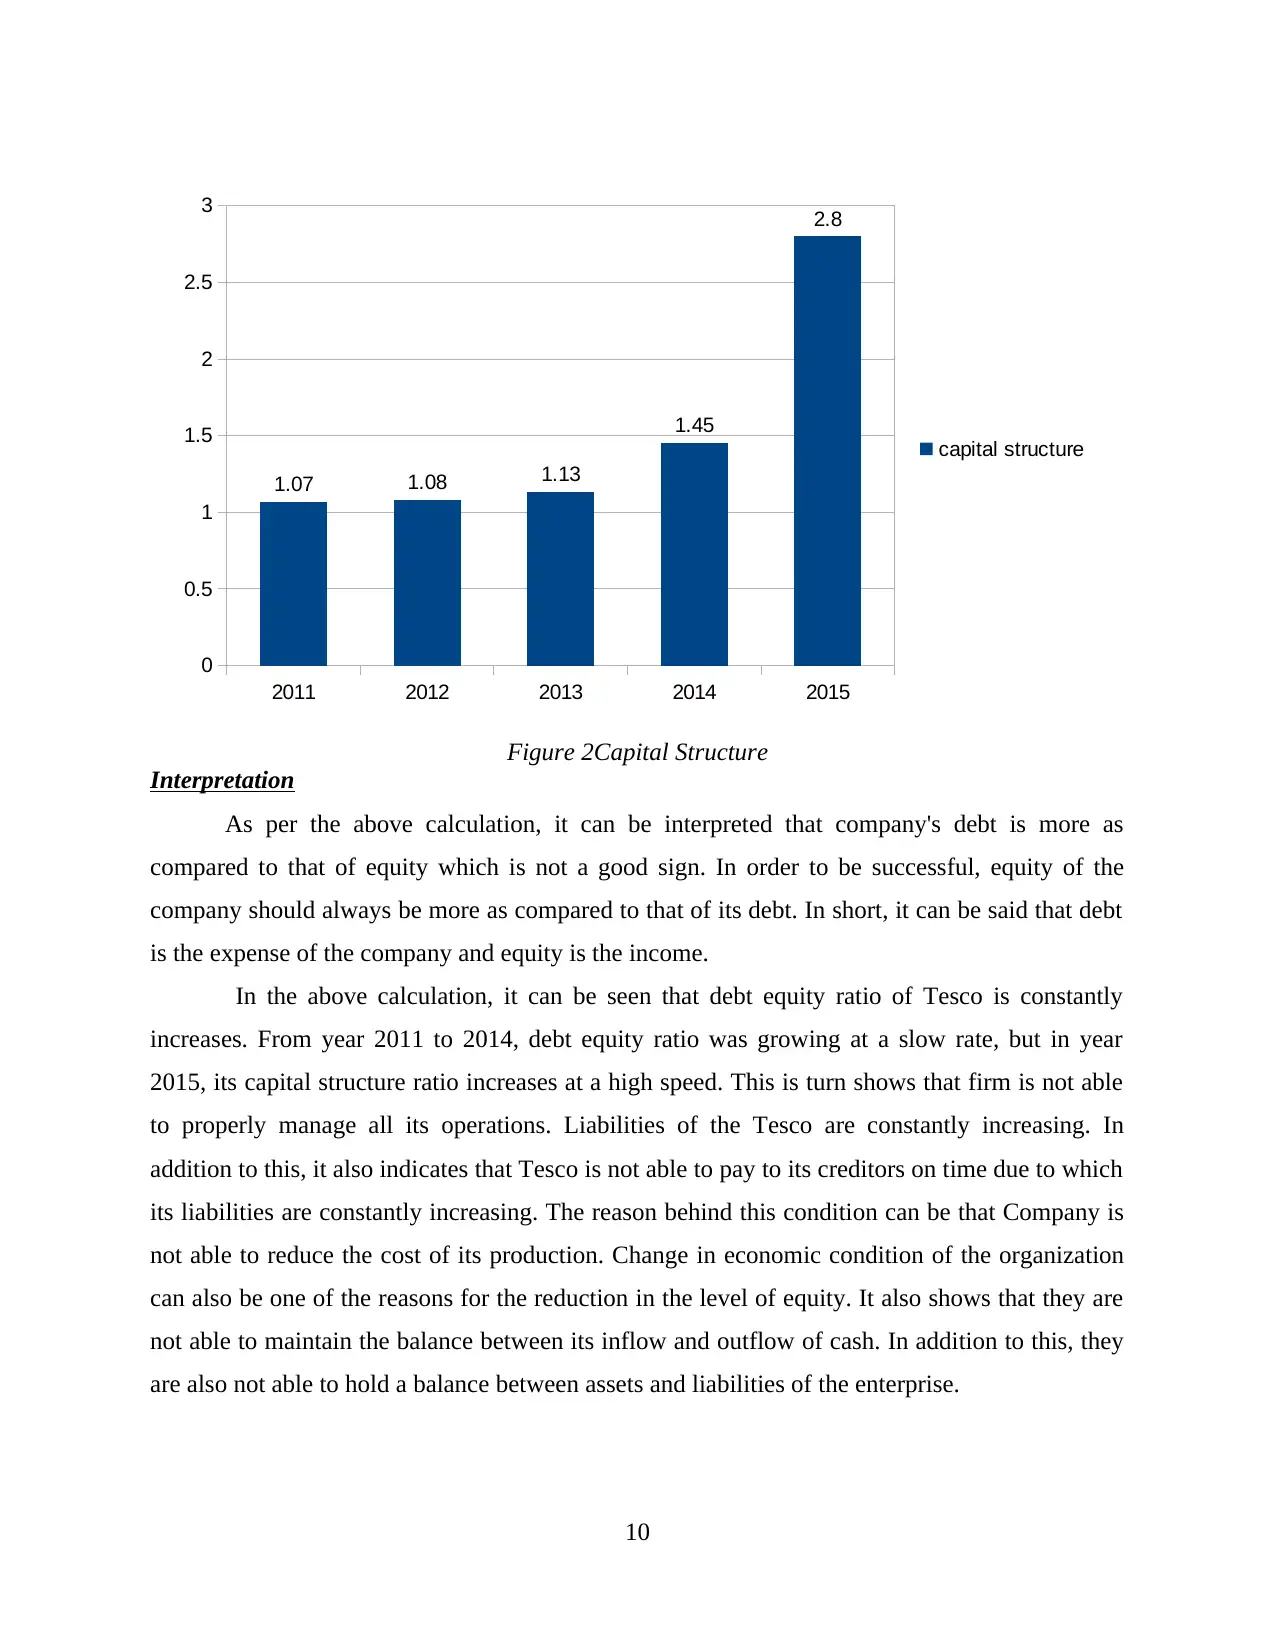
Interpretation
As per the above calculation, it can be interpreted that company's debt is more as
compared to that of equity which is not a good sign. In order to be successful, equity of the
company should always be more as compared to that of its debt. In short, it can be said that debt
is the expense of the company and equity is the income.
In the above calculation, it can be seen that debt equity ratio of Tesco is constantly
increases. From year 2011 to 2014, debt equity ratio was growing at a slow rate, but in year
2015, its capital structure ratio increases at a high speed. This is turn shows that firm is not able
to properly manage all its operations. Liabilities of the Tesco are constantly increasing. In
addition to this, it also indicates that Tesco is not able to pay to its creditors on time due to which
its liabilities are constantly increasing. The reason behind this condition can be that Company is
not able to reduce the cost of its production. Change in economic condition of the organization
can also be one of the reasons for the reduction in the level of equity. It also shows that they are
not able to maintain the balance between its inflow and outflow of cash. In addition to this, they
are also not able to hold a balance between assets and liabilities of the enterprise.
10
2011 2012 2013 2014 2015
0
0.5
1
1.5
2
2.5
3
1.07 1.08 1.13
1.45
2.8
capital structure
Figure 2Capital Structure
Stock Market Performance
Stock market is the place where large number of brokers comes together with an aim to
buy and sell the stock and various other securities of the different companies. This is the market
where electronic trading process takes place (Werner and Brand, 2001).
Henceforth, stock market performance is the presentation of the company over a certain
specified time period. This helps the company to enhance financial performance of the particular
company. By analysing this performance, one can conclude whether company is growing or
moving towards downward.
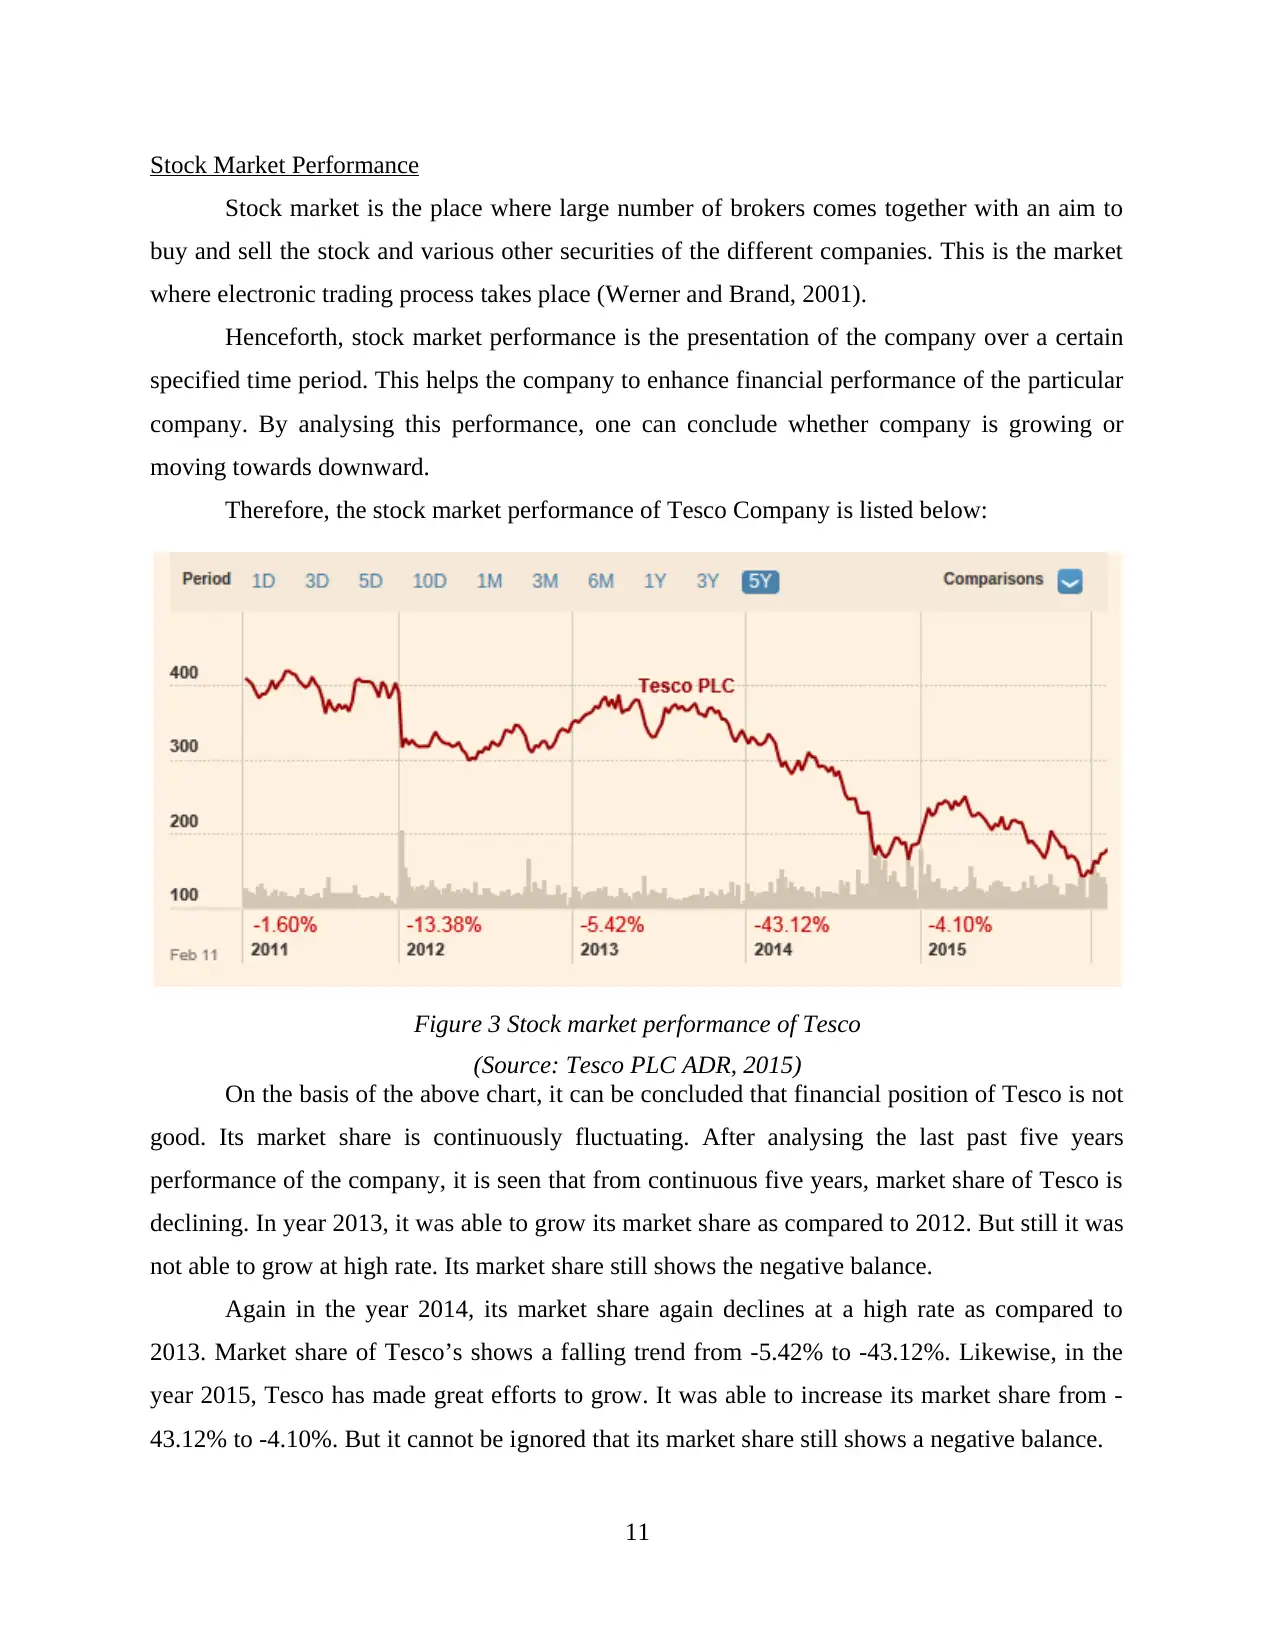
Therefore, the stock market performance of Tesco Company is listed below:
On the basis of the above chart, it can be concluded that financial position of Tesco is not
good. Its market share is continuously fluctuating. After analysing the last past five years
performance of the company, it is seen that from continuous five years, market share of Tesco is
declining. In year 2013, it was able to grow its market share as compared to 2012. But still it was
not able to grow at high rate. Its market share still shows the negative balance.
Again in the year 2014, its market share again declines at a high rate as compared to
2013. Market share of Tesco’s shows a falling trend from -5.42% to -43.12%. Likewise, in the
year 2015, Tesco has made great efforts to grow. It was able to increase its market share from -
43.12% to -4.10%. But it cannot be ignored that its market share still shows a negative balance.
11
Figure 3 Stock market performance of Tesco
(Source: Tesco PLC ADR, 2015)
Stock market is the place where large number of brokers comes together with an aim to
buy and sell the stock and various other securities of the different companies. This is the market
where electronic trading process takes place (Werner and Brand, 2001).
Henceforth, stock market performance is the presentation of the company over a certain
specified time period. This helps the company to enhance financial performance of the particular
company. By analysing this performance, one can conclude whether company is growing or
moving towards downward.
Therefore, the stock market performance of Tesco Company is listed below:
On the basis of the above chart, it can be concluded that financial position of Tesco is not
good. Its market share is continuously fluctuating. After analysing the last past five years
performance of the company, it is seen that from continuous five years, market share of Tesco is
declining. In year 2013, it was able to grow its market share as compared to 2012. But still it was
not able to grow at high rate. Its market share still shows the negative balance.
Again in the year 2014, its market share again declines at a high rate as compared to
2013. Market share of Tesco’s shows a falling trend from -5.42% to -43.12%. Likewise, in the
year 2015, Tesco has made great efforts to grow. It was able to increase its market share from -
43.12% to -4.10%. But it cannot be ignored that its market share still shows a negative balance.
11
Figure 3 Stock market performance of Tesco
(Source: Tesco PLC ADR, 2015)
⊘ This is a preview!⊘
Do you want full access?
Subscribe today to unlock all pages.
Trusted by 1+ million students worldwide
1 out of 16
Related Documents


![Financial Decision Making Report: Tesco PLC Analysis, [Semester]](/_next/image/?url=https%3A%2F%2Fdesklib.com%2Fmedia%2Fimages%2Fhr%2F4d8ba67960c740769ebe4af06e7a847d.jpg&w=256&q=75)
Your All-in-One AI-Powered Toolkit for Academic Success.
+13062052269
info@desklib.com
Available 24*7 on WhatsApp / Email
![[object Object]](/_next/static/media/star-bottom.7253800d.svg)
Unlock your academic potential
Copyright © 2020–2026 A2Z Services. All Rights Reserved. Developed and managed by ZUCOL.