Analysis of Tesco's Financial Performance and Competitor Comparison
VerifiedAdded on 2022/12/15
|13
|3028
|128
Report
AI Summary
This report provides a comprehensive financial analysis of Tesco, a leading retail company. It examines Tesco's financial performance over four years (2016-2020) using various financial ratios, including liquidity, activity, debt, profitability, and market ratios. The analysis includes a comparison of Tesco's performance with its competitors, specifically Sainsbury's, highlighting key differences in financial metrics. Furthermore, the report conducts a trend analysis to assess the company's performance over time, identifying positive and negative trends in key financial indicators. The report offers insights into Tesco's financial health, efficiency, and effectiveness, providing a valuable overview of its financial standing and market position.
Individual report on
chosen company
chosen company
Paraphrase This Document
Need a fresh take? Get an instant paraphrase of this document with our AI Paraphraser
Executive summary
In this report the company chosen is Tesco, which is retail based company and one of the
largest retail organisation in the UK. In this it has been studied the different financial ratio to
analyse the performance of past four years and comparison with the competitors. Apart from that
analysing the trend analysis of financial performance to determine the efficiency and
effectiveness of the company.
Table of Contents
Executive summary..........................................................................................................................2
INTRODUCTION ..........................................................................................................................4
MAIN BODY...................................................................................................................................4
Nature of business and financial performance............................................................................4
Financial performance of the company of past years and comparison with the competitors.....5
Comparison of company with the competitor.............................................................................8
Trend analysis ............................................................................................................................8
Investor point of view and conclusion and recommendation for future...................................10
Conclusion and recommendation ..................................................................................................11
REFERENCES..............................................................................................................................12
⊘ This is a preview!⊘
Do you want full access?
Subscribe today to unlock all pages.
Trusted by 1+ million students worldwide
INTRODUCTION
In this report the company that is chosen is Tesco, which is British multinational
groceries merchandise retailer headquarter in Welwyn Garden City. It is third largest retailer in
the world measured by gross revenues (Cantele and Zardini, 2018). It is one of ninth largest in
the world according the revenue. It is founded by Jack Cohen as group of market stalls in
Hackney, London. This first appearance of this brand in 1924. After that Tesco grew organically
and through acquisition until it owned more than 800 shops. Company has started to expand the
range of products it sold during the 1960s to include the household goods and clothing under
Delamare brand and in the year 1974 opened its first petrol station.
SECTION A
Nature of business and financial performance
Tesco PLC is retail company and engaged in the business of retailing and associated
activities and Retail banking and insurance services. This is British multinational seller company
and its headquarter in England. It follow the hierarchical organisational structure. In this
structure, position and obligation are divided into many parts to make sure that every thing get
go smother and efficiently. This is the reason that it plays important part in successful in the
company and help in growth in the business. The position and obligation is divided into large
number of employees and top management who were engaged in the working in the organisation
(Korompot and Warongan, 2017). This helps in increasing the effectiveness of the company and
leads to many advantages and helps in ruling in the market. Company is generally launched
many outlets and coming up with many new ideas and innovation which is necessary for the
successful. Nowadays it also come into e-commerce business and it is one of the several new
business developments developments that propelled the company's financial growth during the
21st century.
Financial performance of the company of past four years is satisfactory and its sales
volume is increasing years to years and there is no fall in recent years that state the positive sign.
In the year 2016, the revenue is 53.93b and in year 2017, the revenue is 55.93b which is
increasing steadily. Like in the year 2018 the sales is 57.49b and it rises to 63.91b in the year
2019 and again it increases to 64.76b in the year 2020. This tells that company has performing
well in last four years and did not face any fall in sales which shows the rise in the growth in the
Paraphrase This Document
Need a fresh take? Get an instant paraphrase of this document with our AI Paraphraser
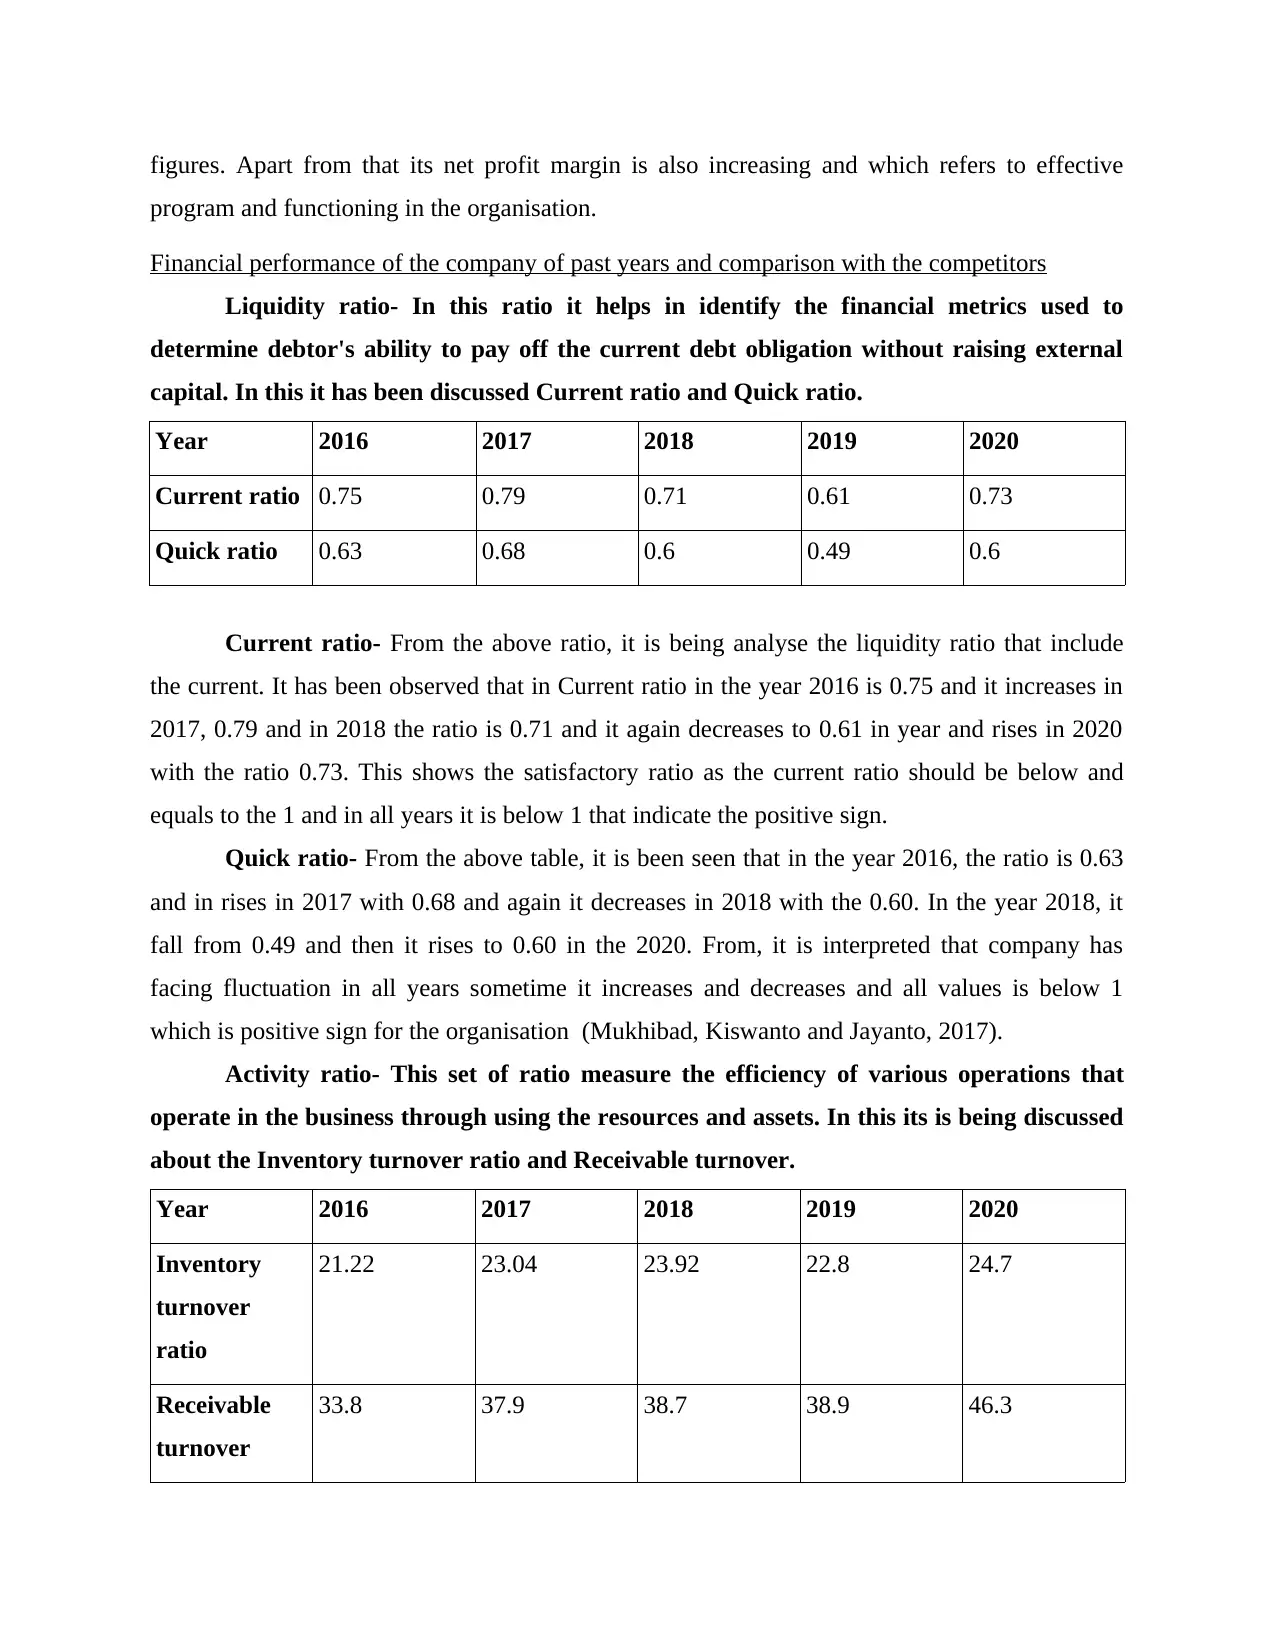
figures. Apart from that its net profit margin is also increasing and which refers to effective
program and functioning in the organisation.
Financial performance of the company of past years and comparison with the competitors
Liquidity ratio- In this ratio it helps in identify the financial metrics used to
determine debtor's ability to pay off the current debt obligation without raising external
capital. In this it has been discussed Current ratio and Quick ratio.
Year 2016 2017 2018 2019 2020
Current ratio 0.75 0.79 0.71 0.61 0.73
Quick ratio 0.63 0.68 0.6 0.49 0.6
Current ratio- From the above ratio, it is being analyse the liquidity ratio that include
the current. It has been observed that in Current ratio in the year 2016 is 0.75 and it increases in
2017, 0.79 and in 2018 the ratio is 0.71 and it again decreases to 0.61 in year and rises in 2020
with the ratio 0.73. This shows the satisfactory ratio as the current ratio should be below and
equals to the 1 and in all years it is below 1 that indicate the positive sign.
Quick ratio- From the above table, it is been seen that in the year 2016, the ratio is 0.63
and in rises in 2017 with 0.68 and again it decreases in 2018 with the 0.60. In the year 2018, it
fall from 0.49 and then it rises to 0.60 in the 2020. From, it is interpreted that company has
facing fluctuation in all years sometime it increases and decreases and all values is below 1
which is positive sign for the organisation (Mukhibad, Kiswanto and Jayanto, 2017).
Activity ratio- This set of ratio measure the efficiency of various operations that
operate in the business through using the resources and assets. In this its is being discussed
about the Inventory turnover ratio and Receivable turnover.
Year 2016 2017 2018 2019 2020
Inventory
turnover
ratio
21.22 23.04 23.92 22.8 24.7
Receivable
turnover
33.8 37.9 38.7 38.9 46.3
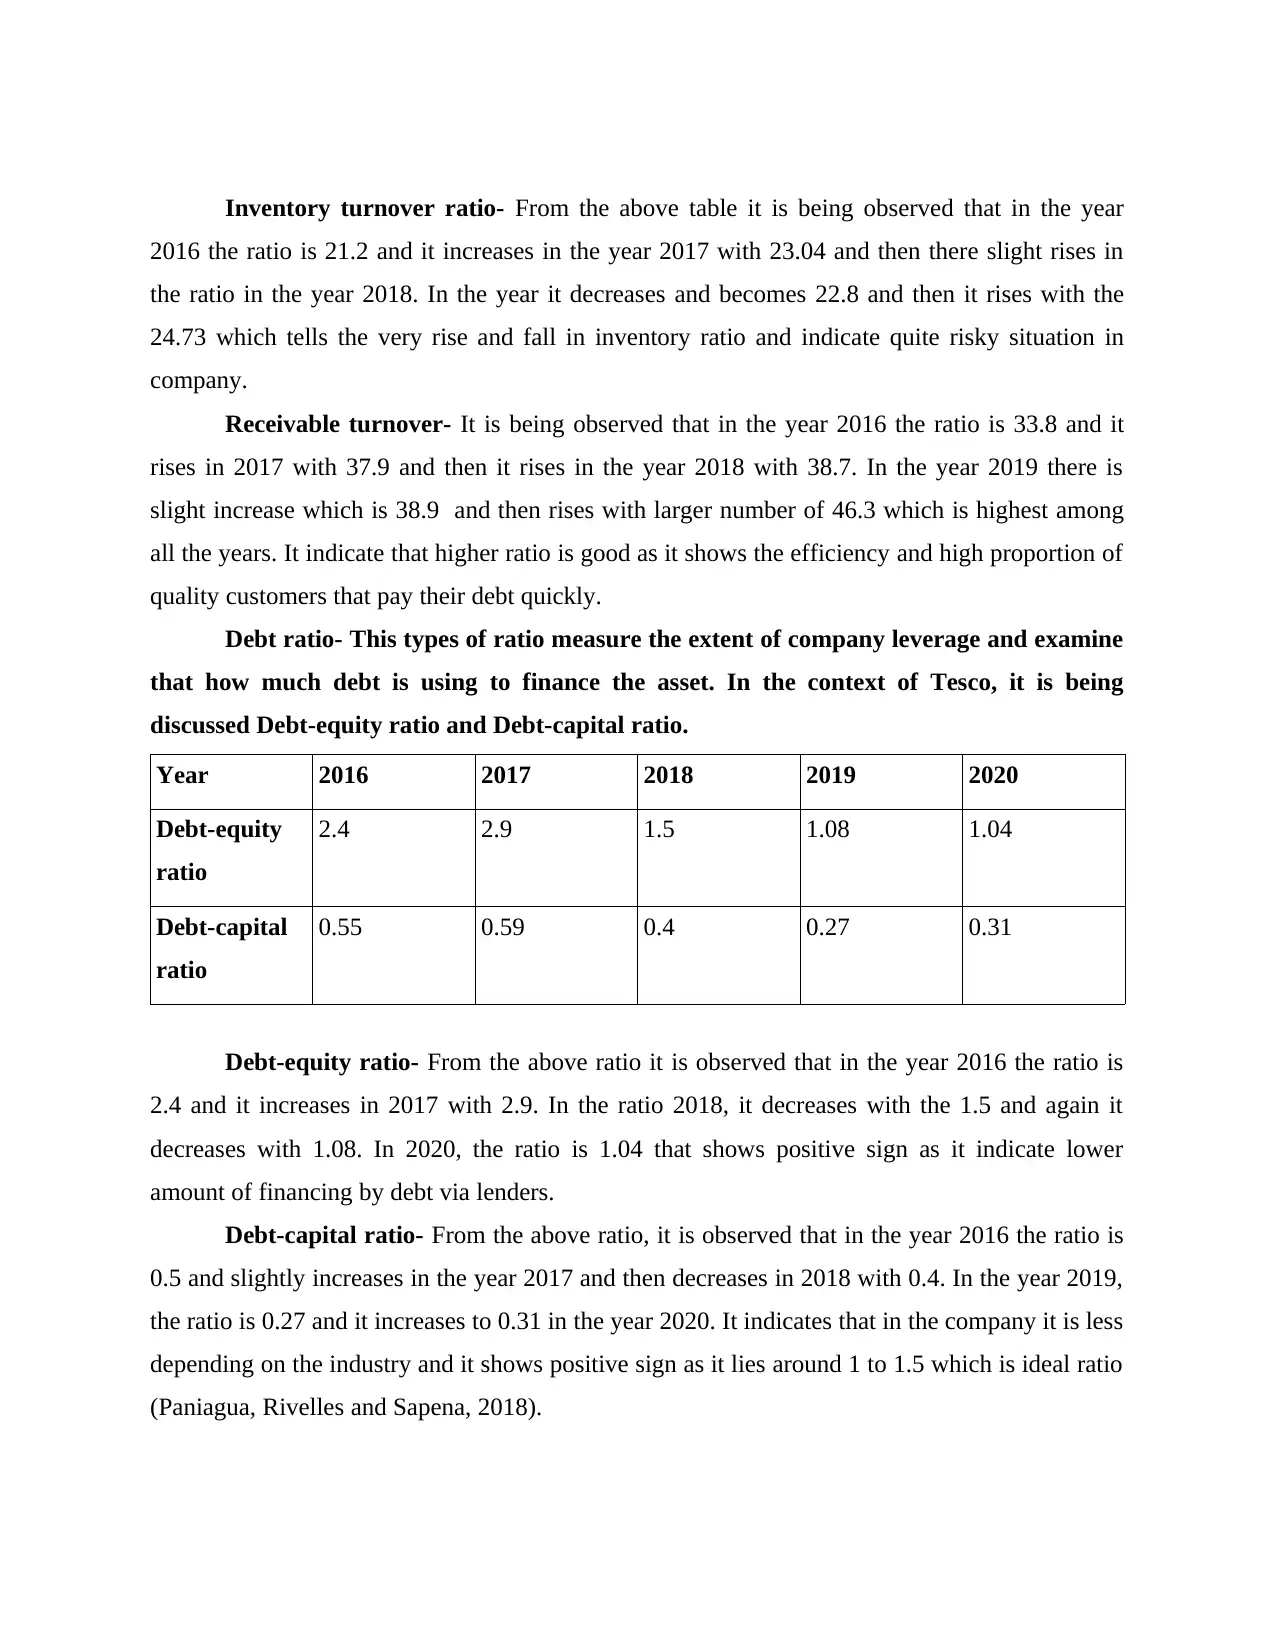
Inventory turnover ratio- From the above table it is being observed that in the year
2016 the ratio is 21.2 and it increases in the year 2017 with 23.04 and then there slight rises in
the ratio in the year 2018. In the year it decreases and becomes 22.8 and then it rises with the
24.73 which tells the very rise and fall in inventory ratio and indicate quite risky situation in
company.
Receivable turnover- It is being observed that in the year 2016 the ratio is 33.8 and it
rises in 2017 with 37.9 and then it rises in the year 2018 with 38.7. In the year 2019 there is
slight increase which is 38.9 and then rises with larger number of 46.3 which is highest among
all the years. It indicate that higher ratio is good as it shows the efficiency and high proportion of
quality customers that pay their debt quickly.
Debt ratio- This types of ratio measure the extent of company leverage and examine
that how much debt is using to finance the asset. In the context of Tesco, it is being
discussed Debt-equity ratio and Debt-capital ratio.
Year 2016 2017 2018 2019 2020
Debt-equity
ratio
2.4 2.9 1.5 1.08 1.04
Debt-capital
ratio
0.55 0.59 0.4 0.27 0.31
Debt-equity ratio- From the above ratio it is observed that in the year 2016 the ratio is
2.4 and it increases in 2017 with 2.9. In the ratio 2018, it decreases with the 1.5 and again it
decreases with 1.08. In 2020, the ratio is 1.04 that shows positive sign as it indicate lower
amount of financing by debt via lenders.
Debt-capital ratio- From the above ratio, it is observed that in the year 2016 the ratio is
0.5 and slightly increases in the year 2017 and then decreases in 2018 with 0.4. In the year 2019,
the ratio is 0.27 and it increases to 0.31 in the year 2020. It indicates that in the company it is less
depending on the industry and it shows positive sign as it lies around 1 to 1.5 which is ideal ratio
(Paniagua, Rivelles and Sapena, 2018).
⊘ This is a preview!⊘
Do you want full access?
Subscribe today to unlock all pages.
Trusted by 1+ million students worldwide
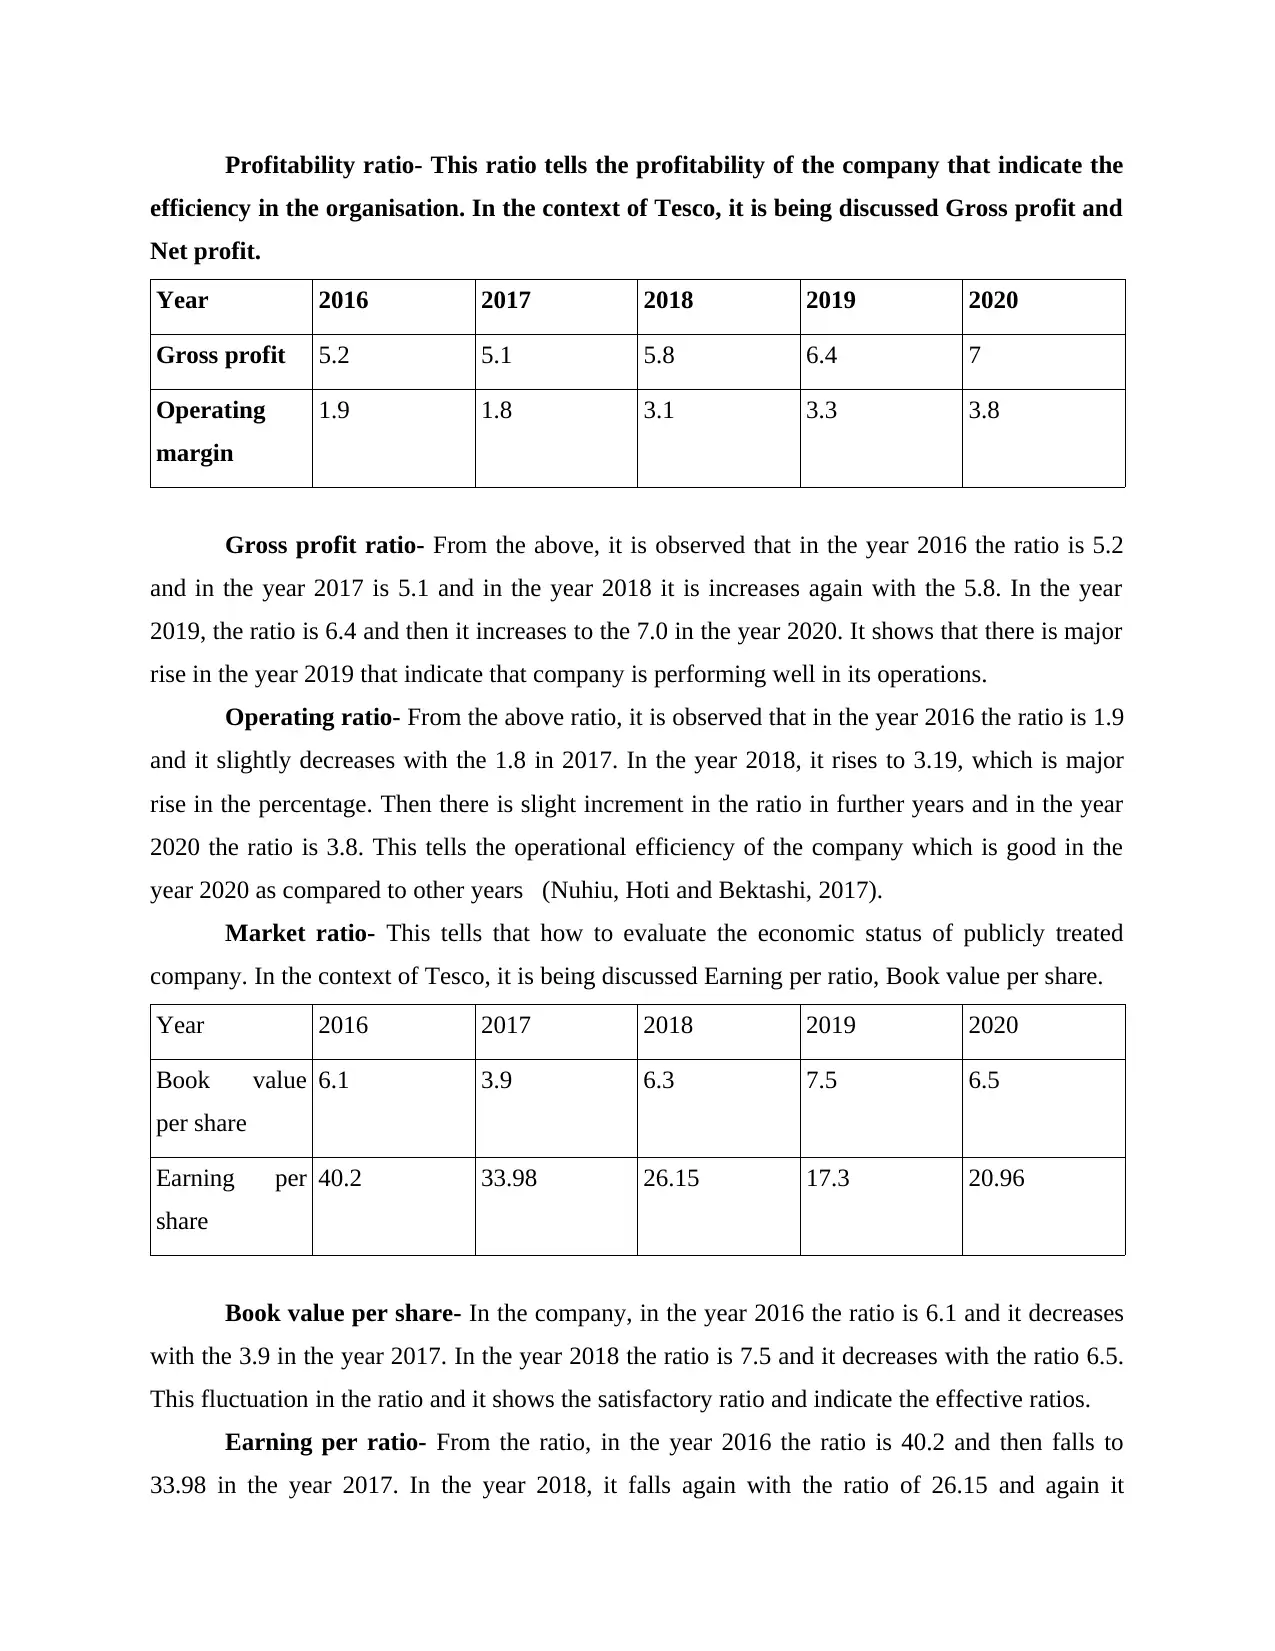
Profitability ratio- This ratio tells the profitability of the company that indicate the
efficiency in the organisation. In the context of Tesco, it is being discussed Gross profit and
Net profit.
Year 2016 2017 2018 2019 2020
Gross profit 5.2 5.1 5.8 6.4 7
Operating
margin
1.9 1.8 3.1 3.3 3.8
Gross profit ratio- From the above, it is observed that in the year 2016 the ratio is 5.2
and in the year 2017 is 5.1 and in the year 2018 it is increases again with the 5.8. In the year
2019, the ratio is 6.4 and then it increases to the 7.0 in the year 2020. It shows that there is major
rise in the year 2019 that indicate that company is performing well in its operations.
Operating ratio- From the above ratio, it is observed that in the year 2016 the ratio is 1.9
and it slightly decreases with the 1.8 in 2017. In the year 2018, it rises to 3.19, which is major
rise in the percentage. Then there is slight increment in the ratio in further years and in the year
2020 the ratio is 3.8. This tells the operational efficiency of the company which is good in the
year 2020 as compared to other years (Nuhiu, Hoti and Bektashi, 2017).
Market ratio- This tells that how to evaluate the economic status of publicly treated
company. In the context of Tesco, it is being discussed Earning per ratio, Book value per share.
Year 2016 2017 2018 2019 2020
Book value
per share
6.1 3.9 6.3 7.5 6.5
Earning per
share
40.2 33.98 26.15 17.3 20.96
Book value per share- In the company, in the year 2016 the ratio is 6.1 and it decreases
with the 3.9 in the year 2017. In the year 2018 the ratio is 7.5 and it decreases with the ratio 6.5.
This fluctuation in the ratio and it shows the satisfactory ratio and indicate the effective ratios.
Earning per ratio- From the ratio, in the year 2016 the ratio is 40.2 and then falls to
33.98 in the year 2017. In the year 2018, it falls again with the ratio of 26.15 and again it
Paraphrase This Document
Need a fresh take? Get an instant paraphrase of this document with our AI Paraphraser
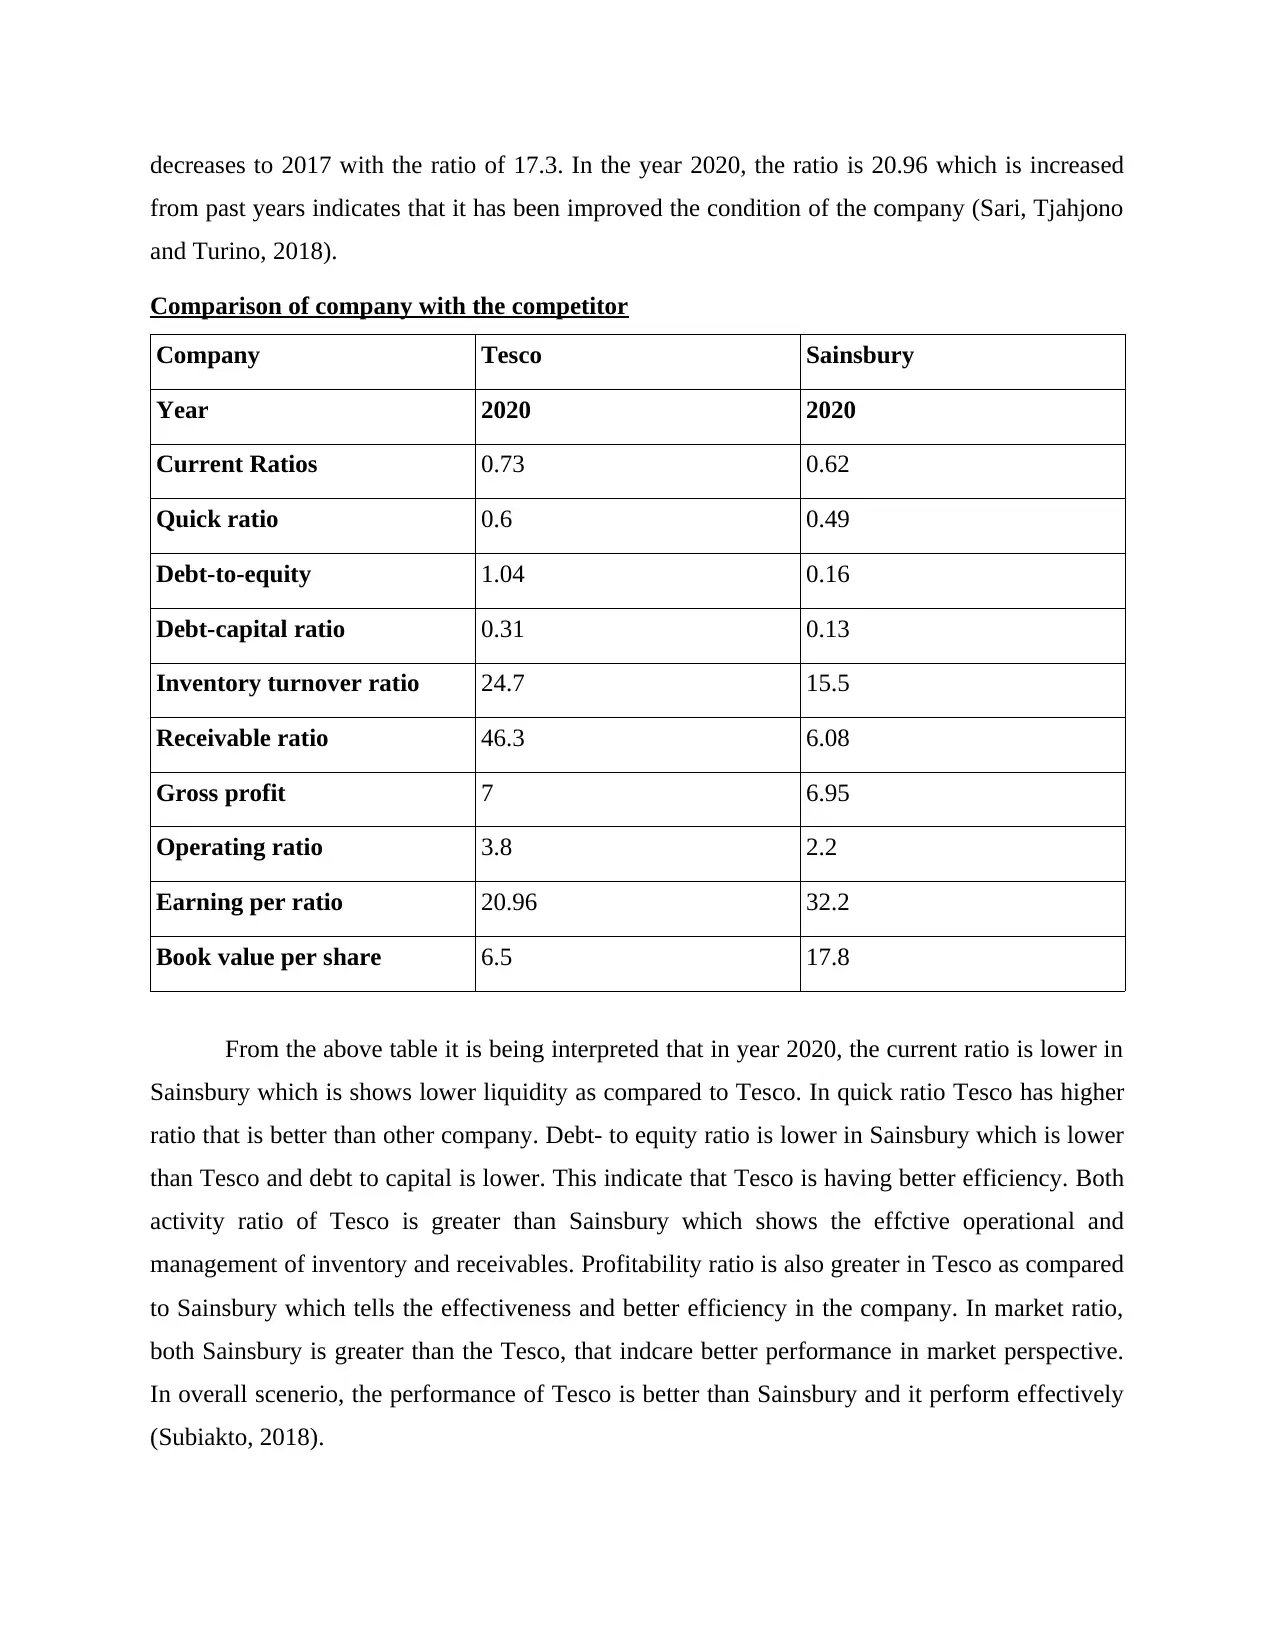
decreases to 2017 with the ratio of 17.3. In the year 2020, the ratio is 20.96 which is increased
from past years indicates that it has been improved the condition of the company (Sari, Tjahjono
and Turino, 2018).
Comparison of company with the competitor
Company Tesco Sainsbury
Year 2020 2020
Current Ratios 0.73 0.62
Quick ratio 0.6 0.49
Debt-to-equity 1.04 0.16
Debt-capital ratio 0.31 0.13
Inventory turnover ratio 24.7 15.5
Receivable ratio 46.3 6.08
Gross profit 7 6.95
Operating ratio 3.8 2.2
Earning per ratio 20.96 32.2
Book value per share 6.5 17.8
From the above table it is being interpreted that in year 2020, the current ratio is lower in
Sainsbury which is shows lower liquidity as compared to Tesco. In quick ratio Tesco has higher
ratio that is better than other company. Debt- to equity ratio is lower in Sainsbury which is lower
than Tesco and debt to capital is lower. This indicate that Tesco is having better efficiency. Both
activity ratio of Tesco is greater than Sainsbury which shows the effctive operational and
management of inventory and receivables. Profitability ratio is also greater in Tesco as compared
to Sainsbury which tells the effectiveness and better efficiency in the company. In market ratio,
both Sainsbury is greater than the Tesco, that indcare better performance in market perspective.
In overall scenerio, the performance of Tesco is better than Sainsbury and it perform effectively
(Subiakto, 2018).
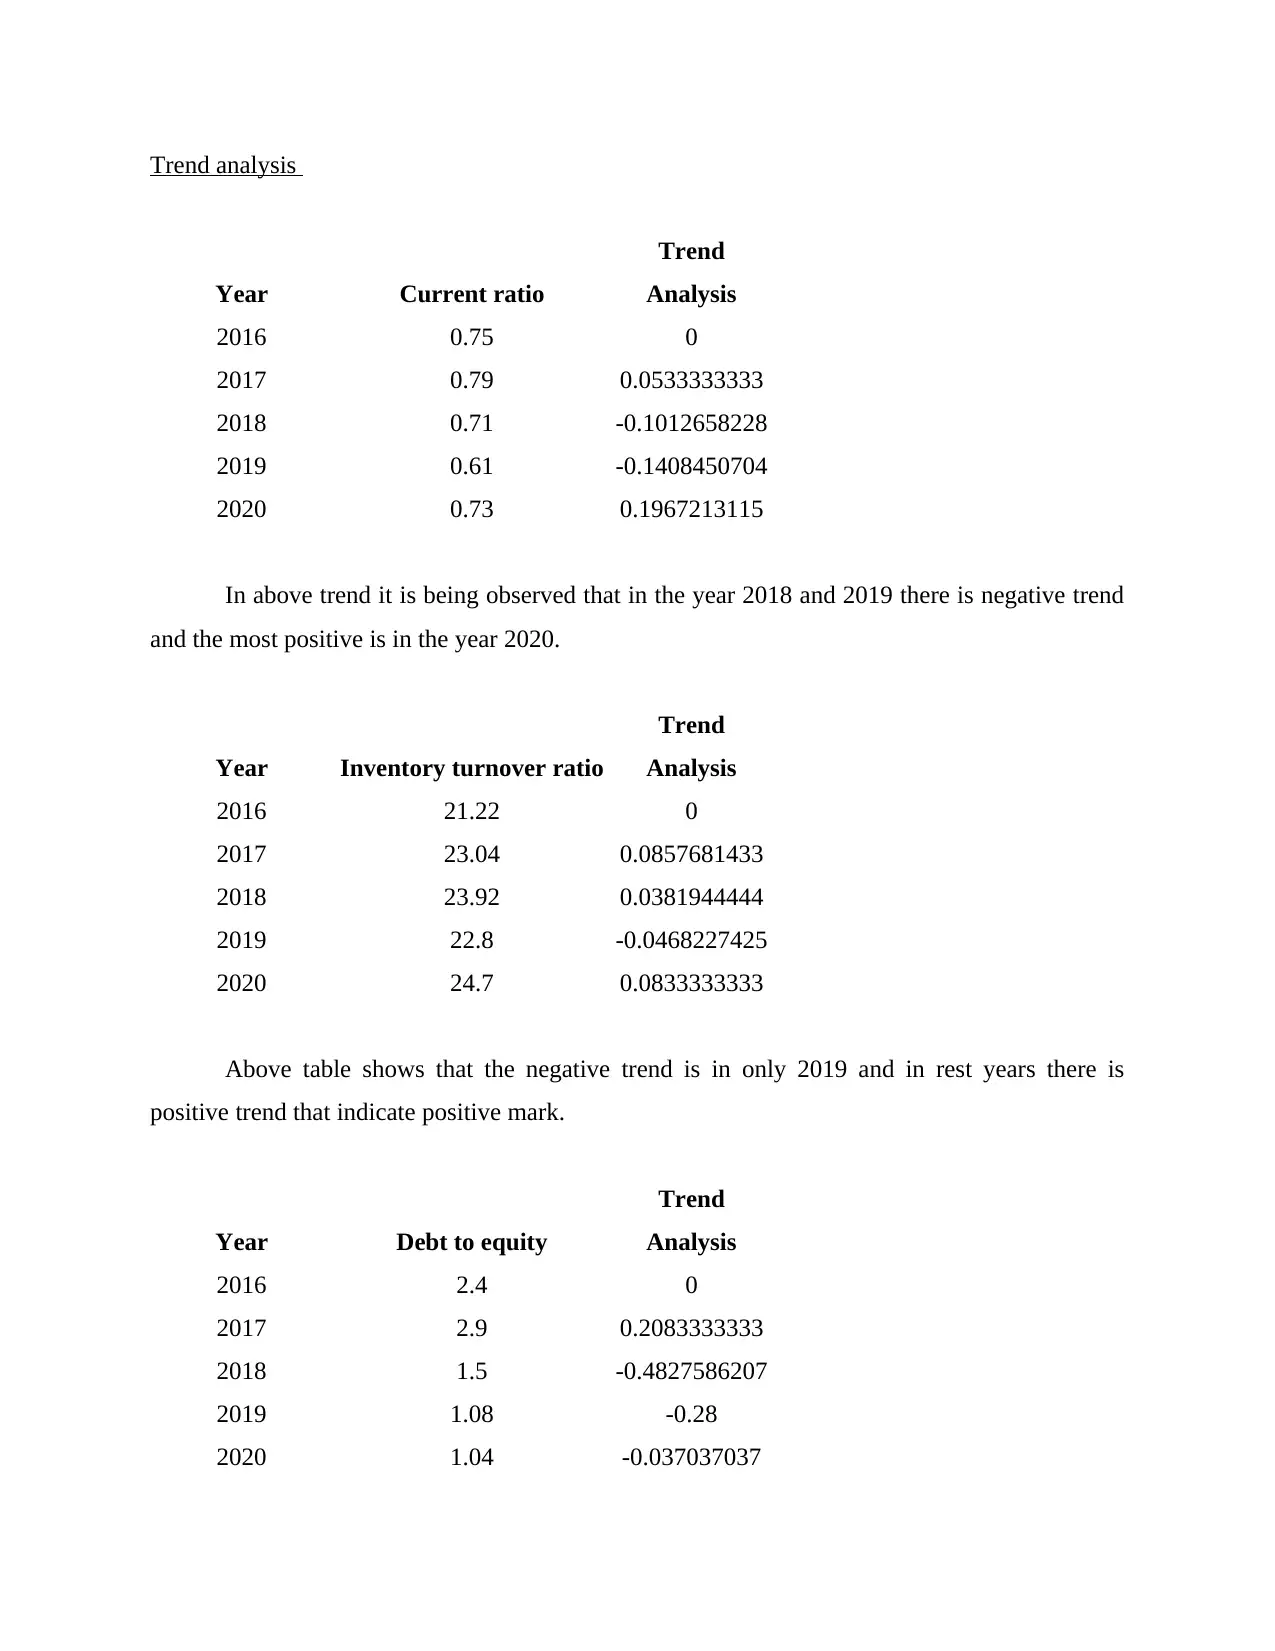
Trend analysis
Year Current ratio
Trend
Analysis
2016 0.75 0
2017 0.79 0.0533333333
2018 0.71 -0.1012658228
2019 0.61 -0.1408450704
2020 0.73 0.1967213115
In above trend it is being observed that in the year 2018 and 2019 there is negative trend
and the most positive is in the year 2020.
Year Inventory turnover ratio
Trend
Analysis
2016 21.22 0
2017 23.04 0.0857681433
2018 23.92 0.0381944444
2019 22.8 -0.0468227425
2020 24.7 0.0833333333
Above table shows that the negative trend is in only 2019 and in rest years there is
positive trend that indicate positive mark.
Year Debt to equity
Trend
Analysis
2016 2.4 0
2017 2.9 0.2083333333
2018 1.5 -0.4827586207
2019 1.08 -0.28
2020 1.04 -0.037037037
⊘ This is a preview!⊘
Do you want full access?
Subscribe today to unlock all pages.
Trusted by 1+ million students worldwide
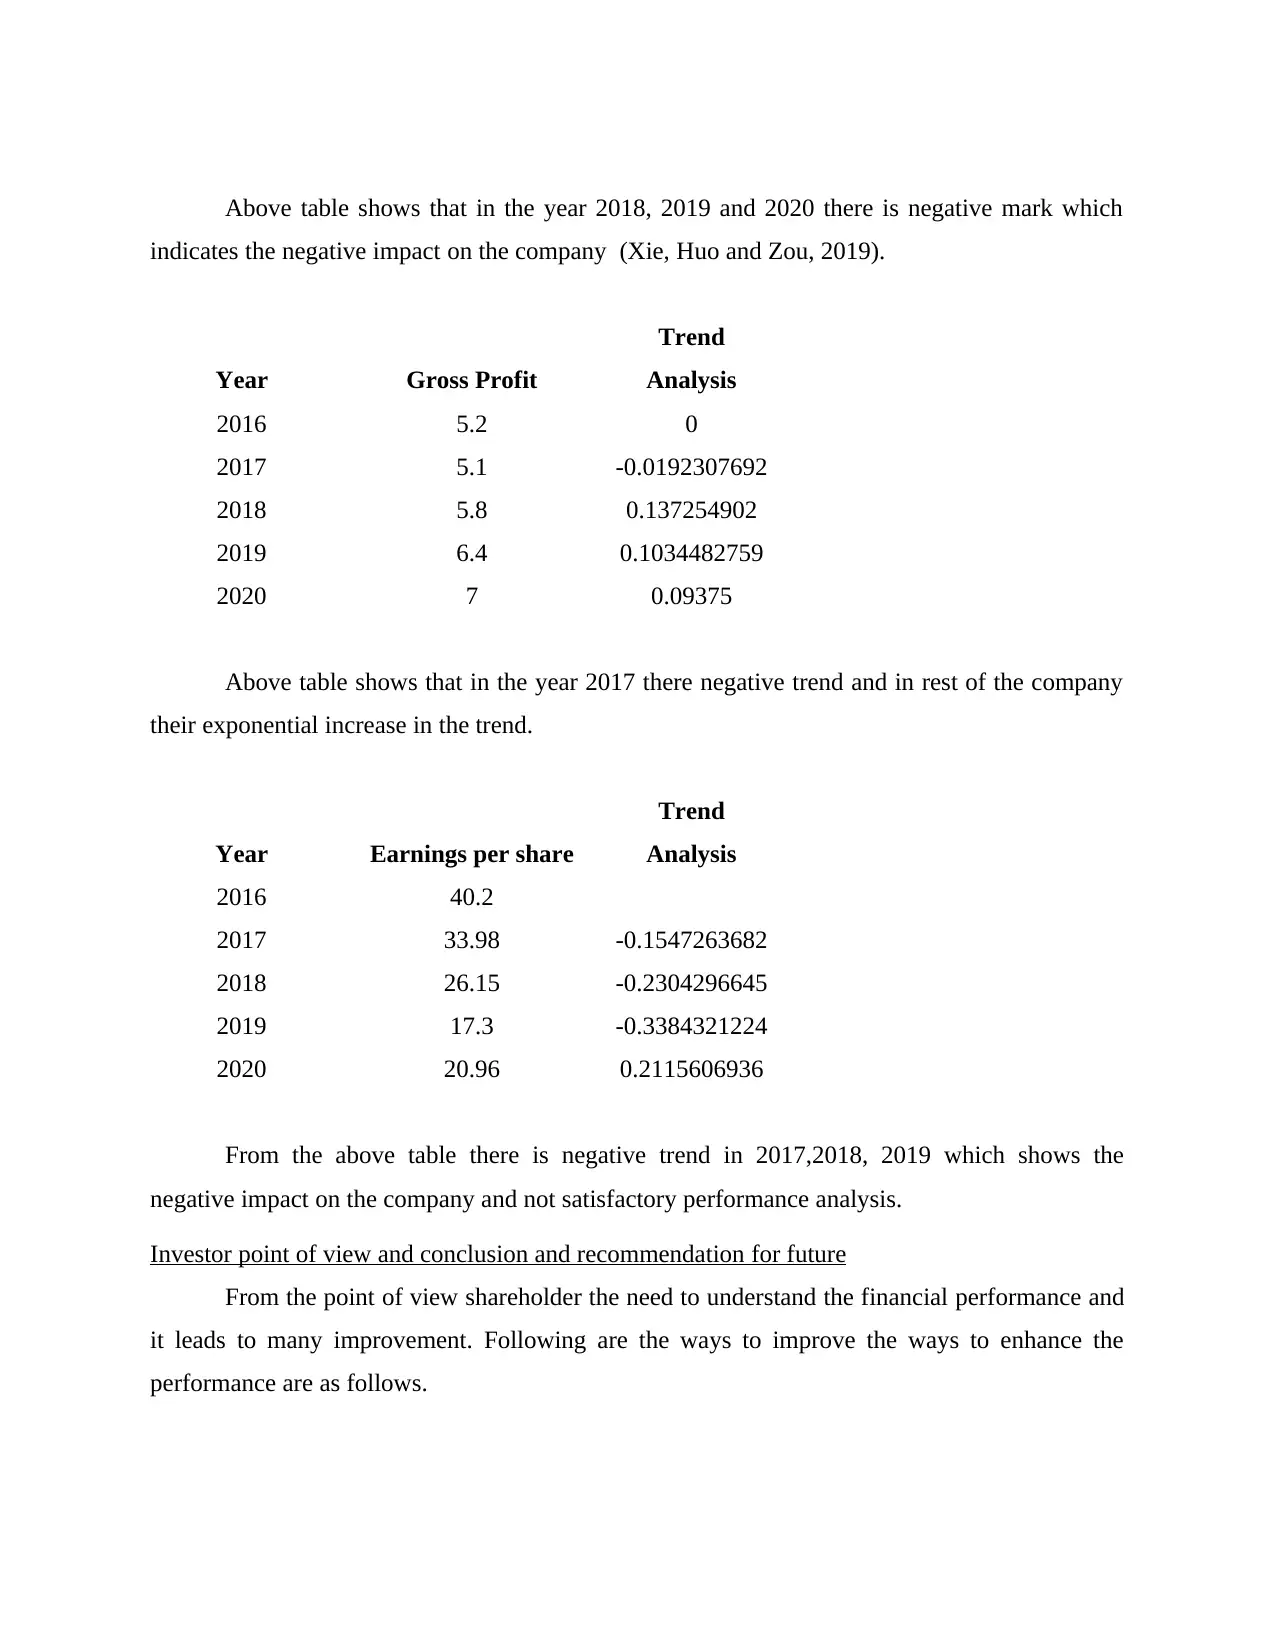
Above table shows that in the year 2018, 2019 and 2020 there is negative mark which
indicates the negative impact on the company (Xie, Huo and Zou, 2019).
Year Gross Profit
Trend
Analysis
2016 5.2 0
2017 5.1 -0.0192307692
2018 5.8 0.137254902
2019 6.4 0.1034482759
2020 7 0.09375
Above table shows that in the year 2017 there negative trend and in rest of the company
their exponential increase in the trend.
Year Earnings per share
Trend
Analysis
2016 40.2
2017 33.98 -0.1547263682
2018 26.15 -0.2304296645
2019 17.3 -0.3384321224
2020 20.96 0.2115606936
From the above table there is negative trend in 2017,2018, 2019 which shows the
negative impact on the company and not satisfactory performance analysis.
Investor point of view and conclusion and recommendation for future
From the point of view shareholder the need to understand the financial performance and
it leads to many improvement. Following are the ways to improve the ways to enhance the
performance are as follows.
Paraphrase This Document
Need a fresh take? Get an instant paraphrase of this document with our AI Paraphraser
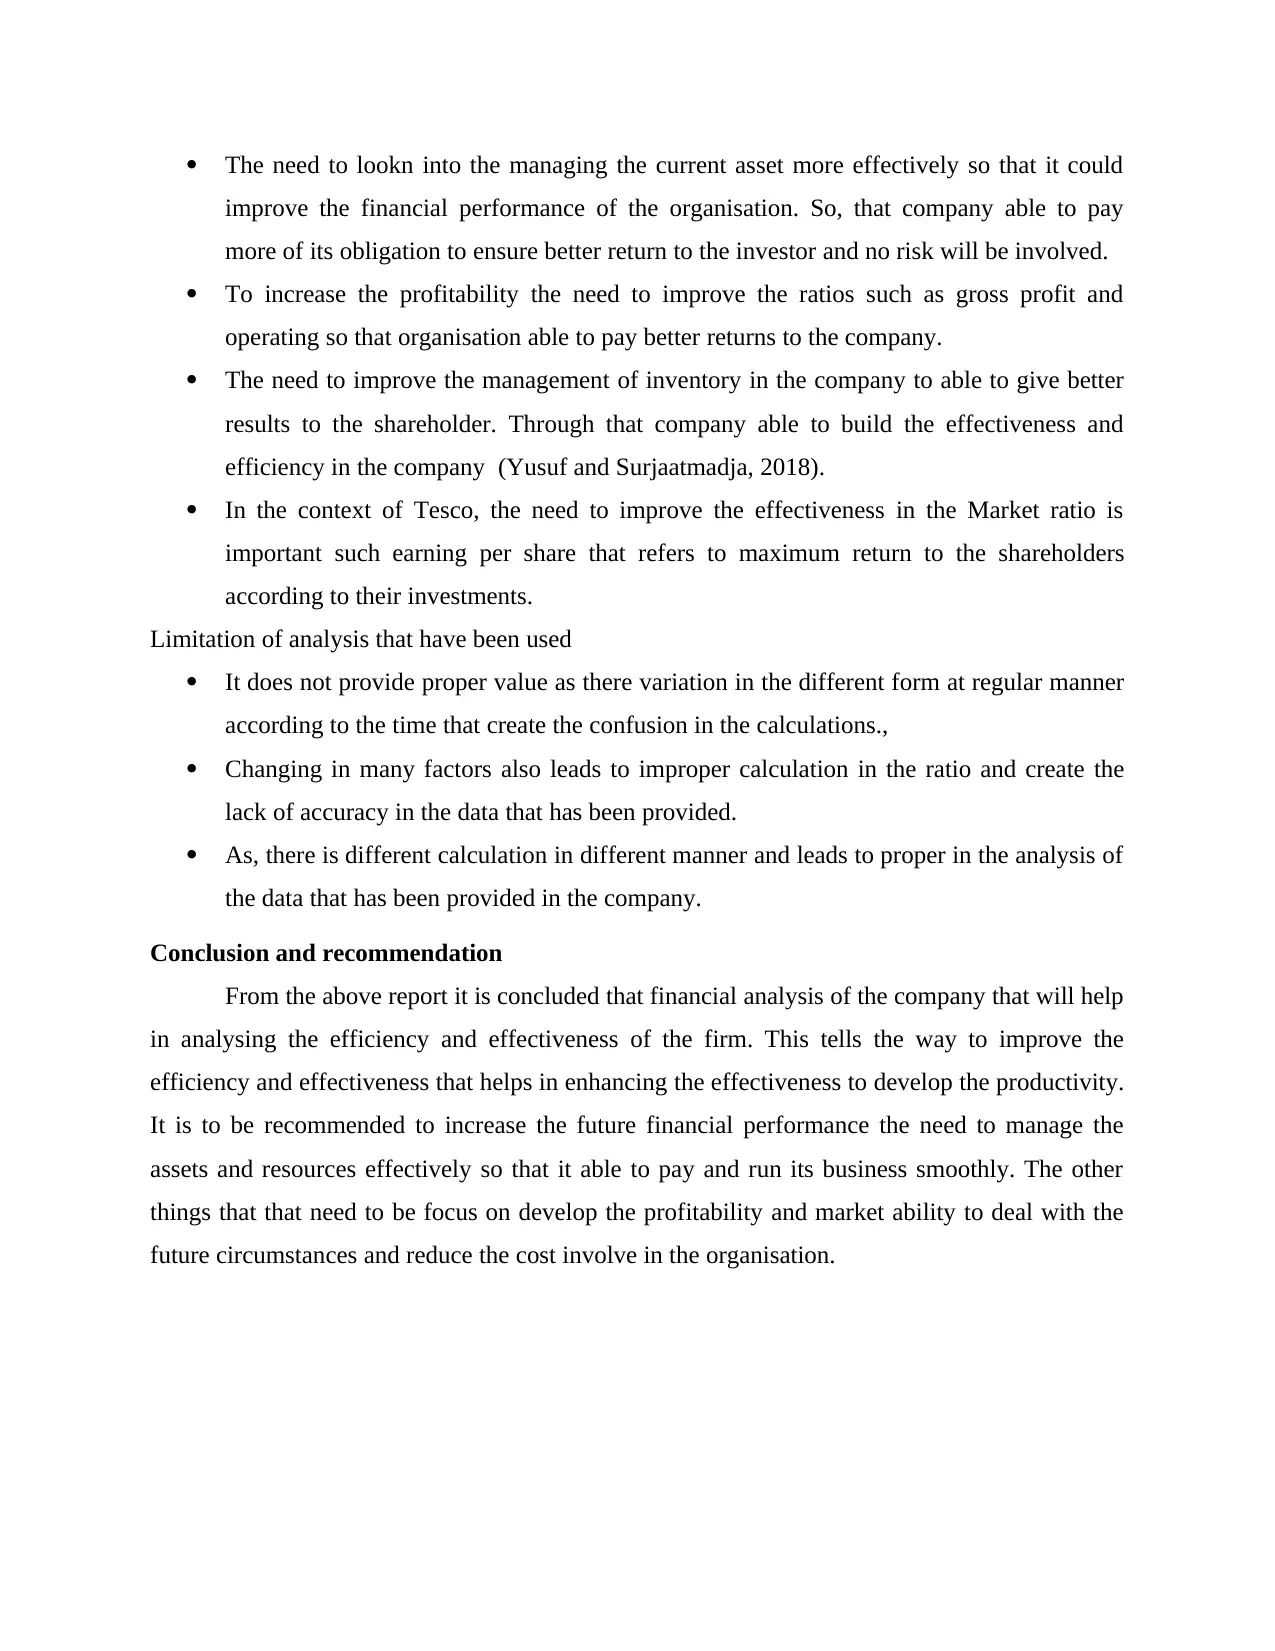
The need to lookn into the managing the current asset more effectively so that it could
improve the financial performance of the organisation. So, that company able to pay
more of its obligation to ensure better return to the investor and no risk will be involved.
To increase the profitability the need to improve the ratios such as gross profit and
operating so that organisation able to pay better returns to the company.
The need to improve the management of inventory in the company to able to give better
results to the shareholder. Through that company able to build the effectiveness and
efficiency in the company (Yusuf and Surjaatmadja, 2018).
In the context of Tesco, the need to improve the effectiveness in the Market ratio is
important such earning per share that refers to maximum return to the shareholders
according to their investments.
Limitation of analysis that have been used
It does not provide proper value as there variation in the different form at regular manner
according to the time that create the confusion in the calculations.,
Changing in many factors also leads to improper calculation in the ratio and create the
lack of accuracy in the data that has been provided.
As, there is different calculation in different manner and leads to proper in the analysis of
the data that has been provided in the company.
Conclusion and recommendation
From the above report it is concluded that financial analysis of the company that will help
in analysing the efficiency and effectiveness of the firm. This tells the way to improve the
efficiency and effectiveness that helps in enhancing the effectiveness to develop the productivity.
It is to be recommended to increase the future financial performance the need to manage the
assets and resources effectively so that it able to pay and run its business smoothly. The other
things that that need to be focus on develop the profitability and market ability to deal with the
future circumstances and reduce the cost involve in the organisation.
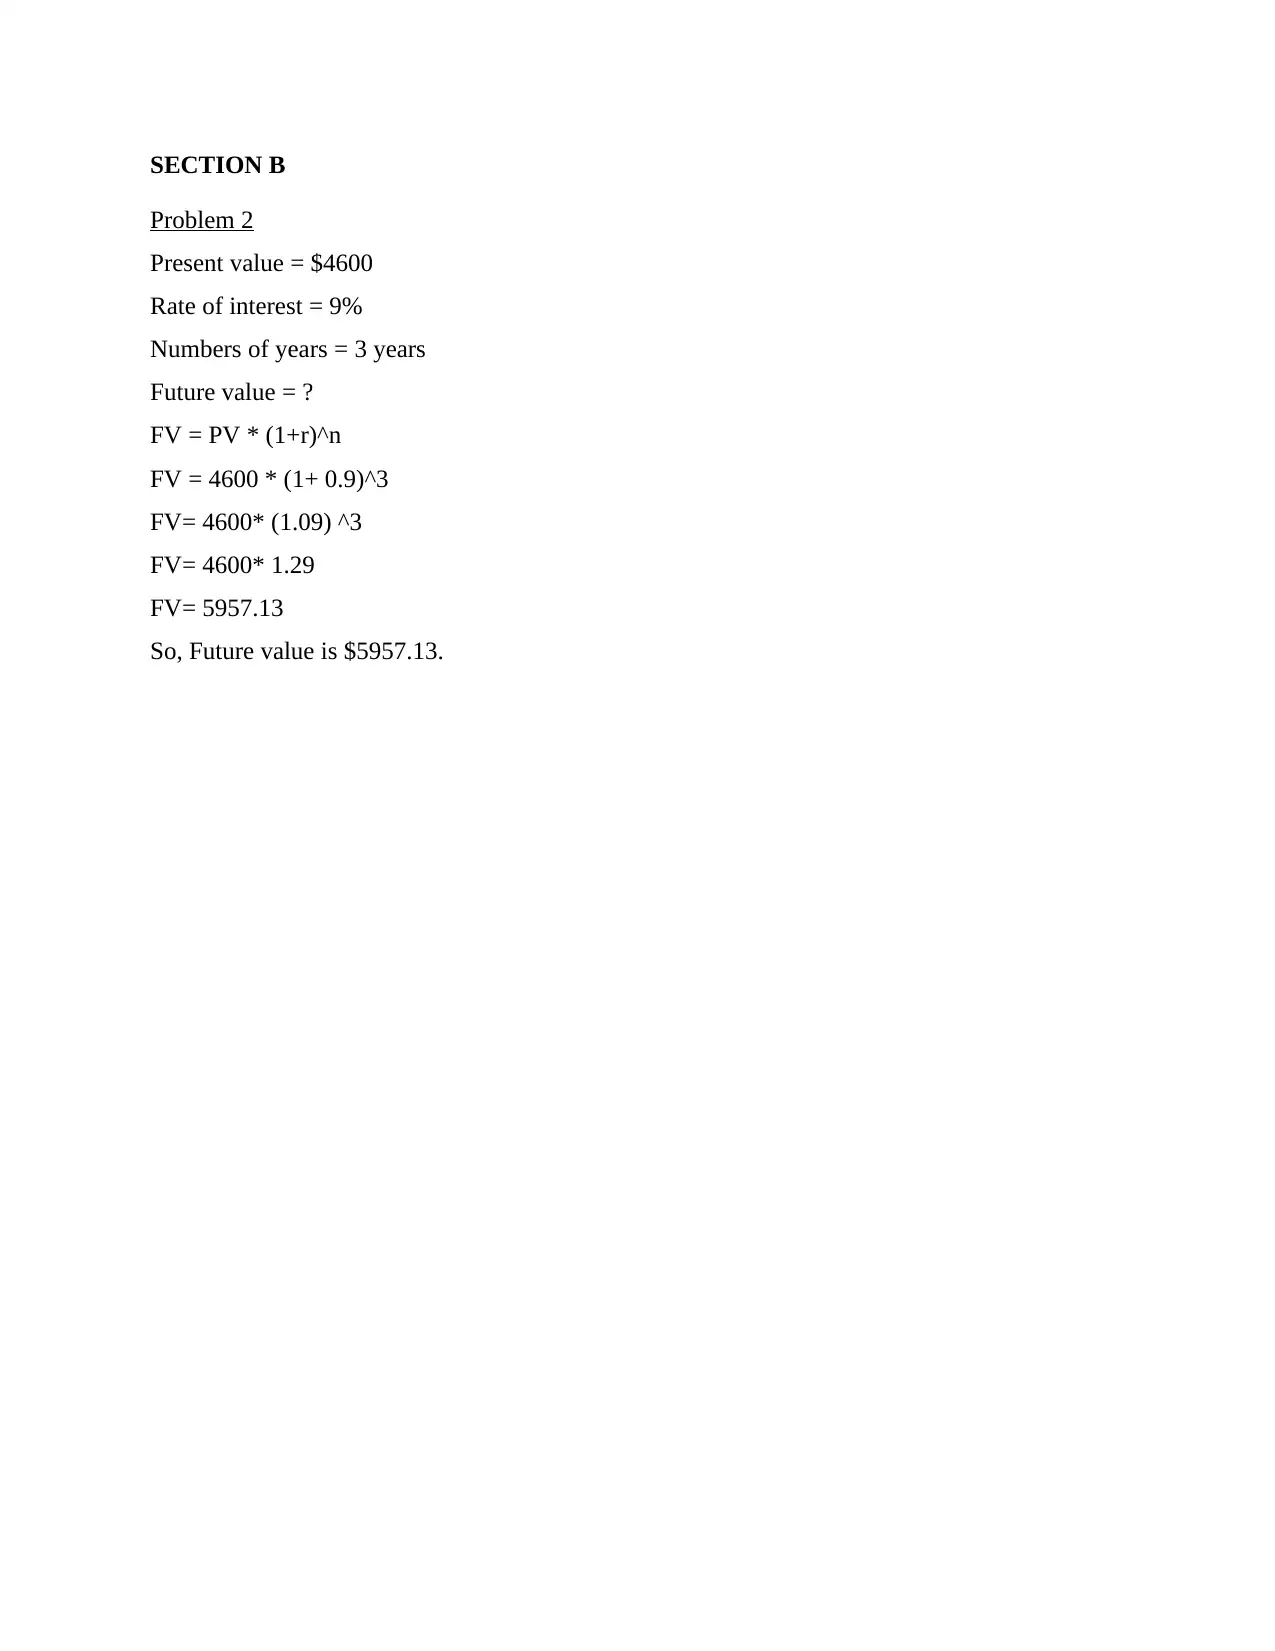
SECTION B
Problem 2
Present value = $4600
Rate of interest = 9%
Numbers of years = 3 years
Future value = ?
FV = PV * (1+r)^n
FV = 4600 * (1+ 0.9)^3
FV= 4600* (1.09) ^3
FV= 4600* 1.29
FV= 5957.13
So, Future value is $5957.13.
Problem 2
Present value = $4600
Rate of interest = 9%
Numbers of years = 3 years
Future value = ?
FV = PV * (1+r)^n
FV = 4600 * (1+ 0.9)^3
FV= 4600* (1.09) ^3
FV= 4600* 1.29
FV= 5957.13
So, Future value is $5957.13.
⊘ This is a preview!⊘
Do you want full access?
Subscribe today to unlock all pages.
Trusted by 1+ million students worldwide
1 out of 13
Related Documents


Your All-in-One AI-Powered Toolkit for Academic Success.
+13062052269
info@desklib.com
Available 24*7 on WhatsApp / Email
![[object Object]](/_next/static/media/star-bottom.7253800d.svg)
Unlock your academic potential
Copyright © 2020–2026 A2Z Services. All Rights Reserved. Developed and managed by ZUCOL.