Financial Analysis of Tesco PLC (2015-2018): BA4008 Coursework
VerifiedAdded on 2022/10/17
|11
|2220
|441
Report
AI Summary
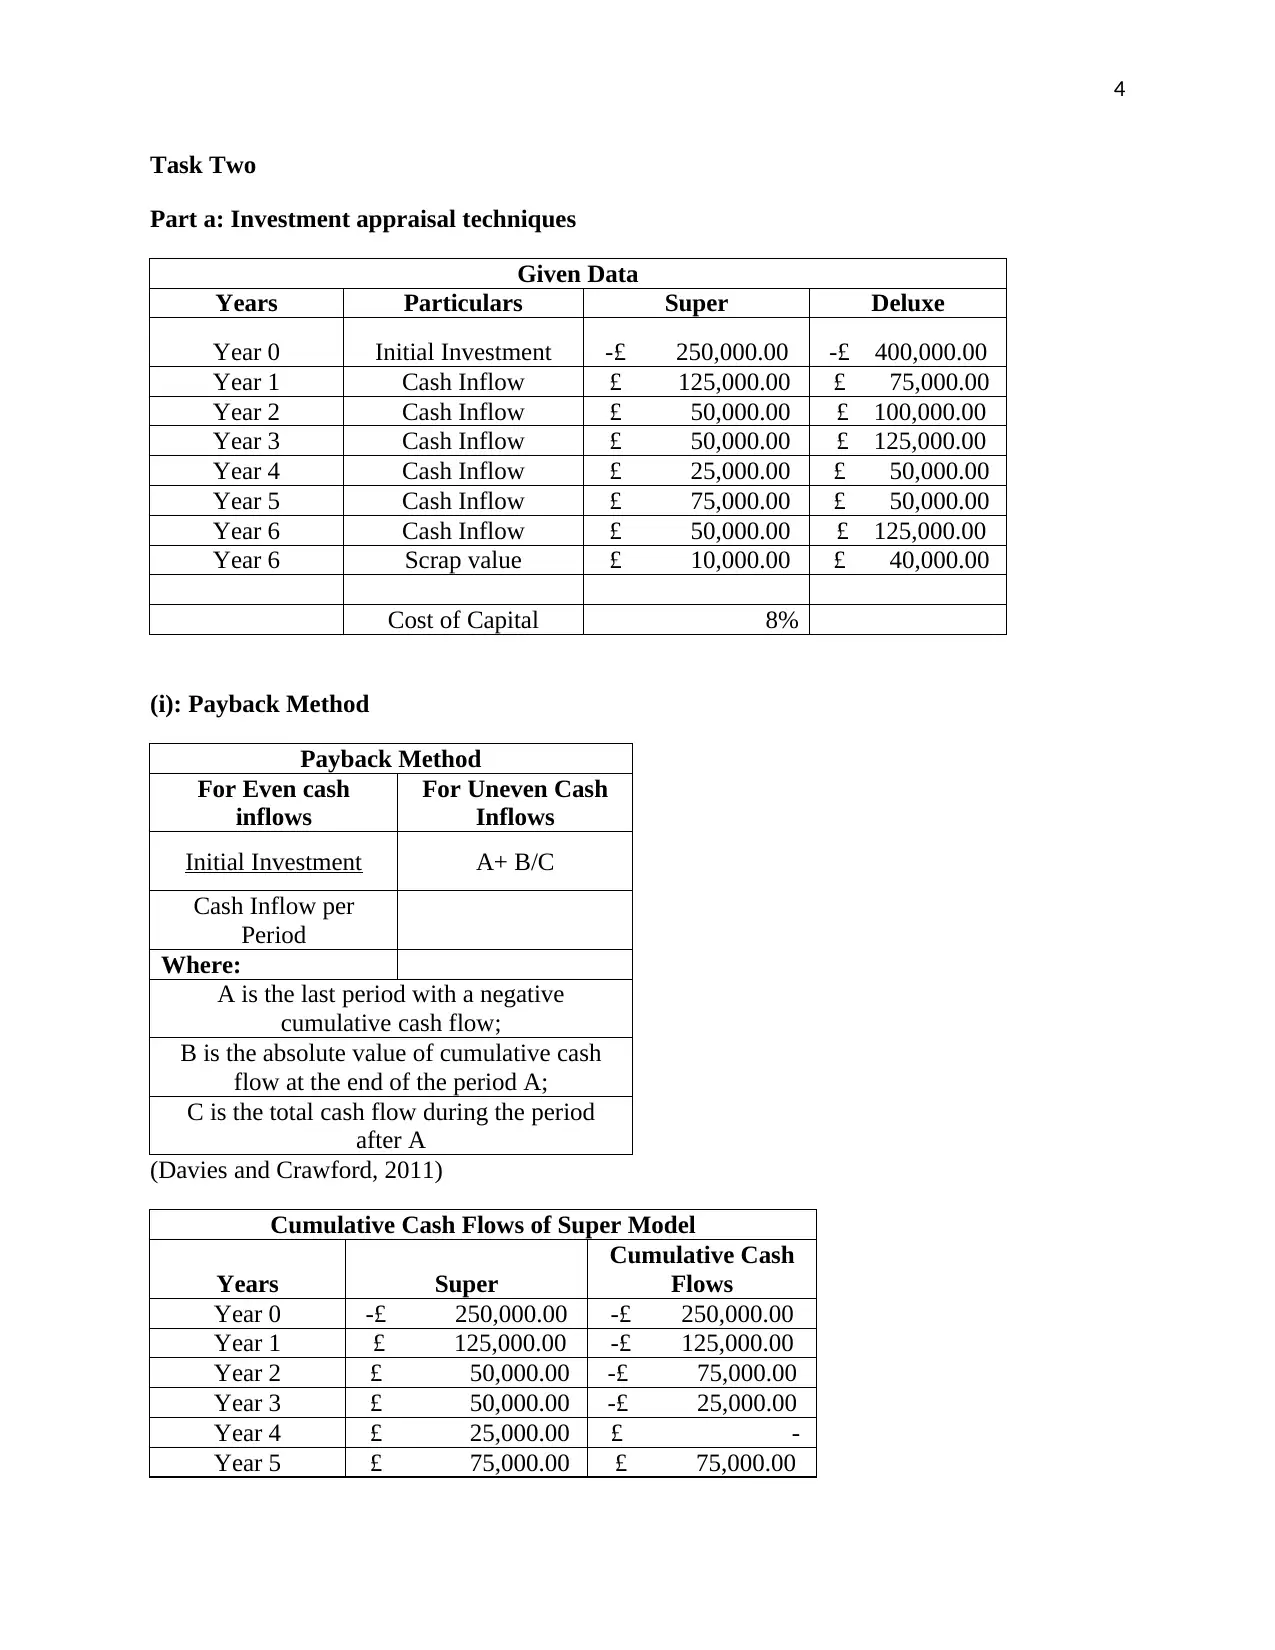
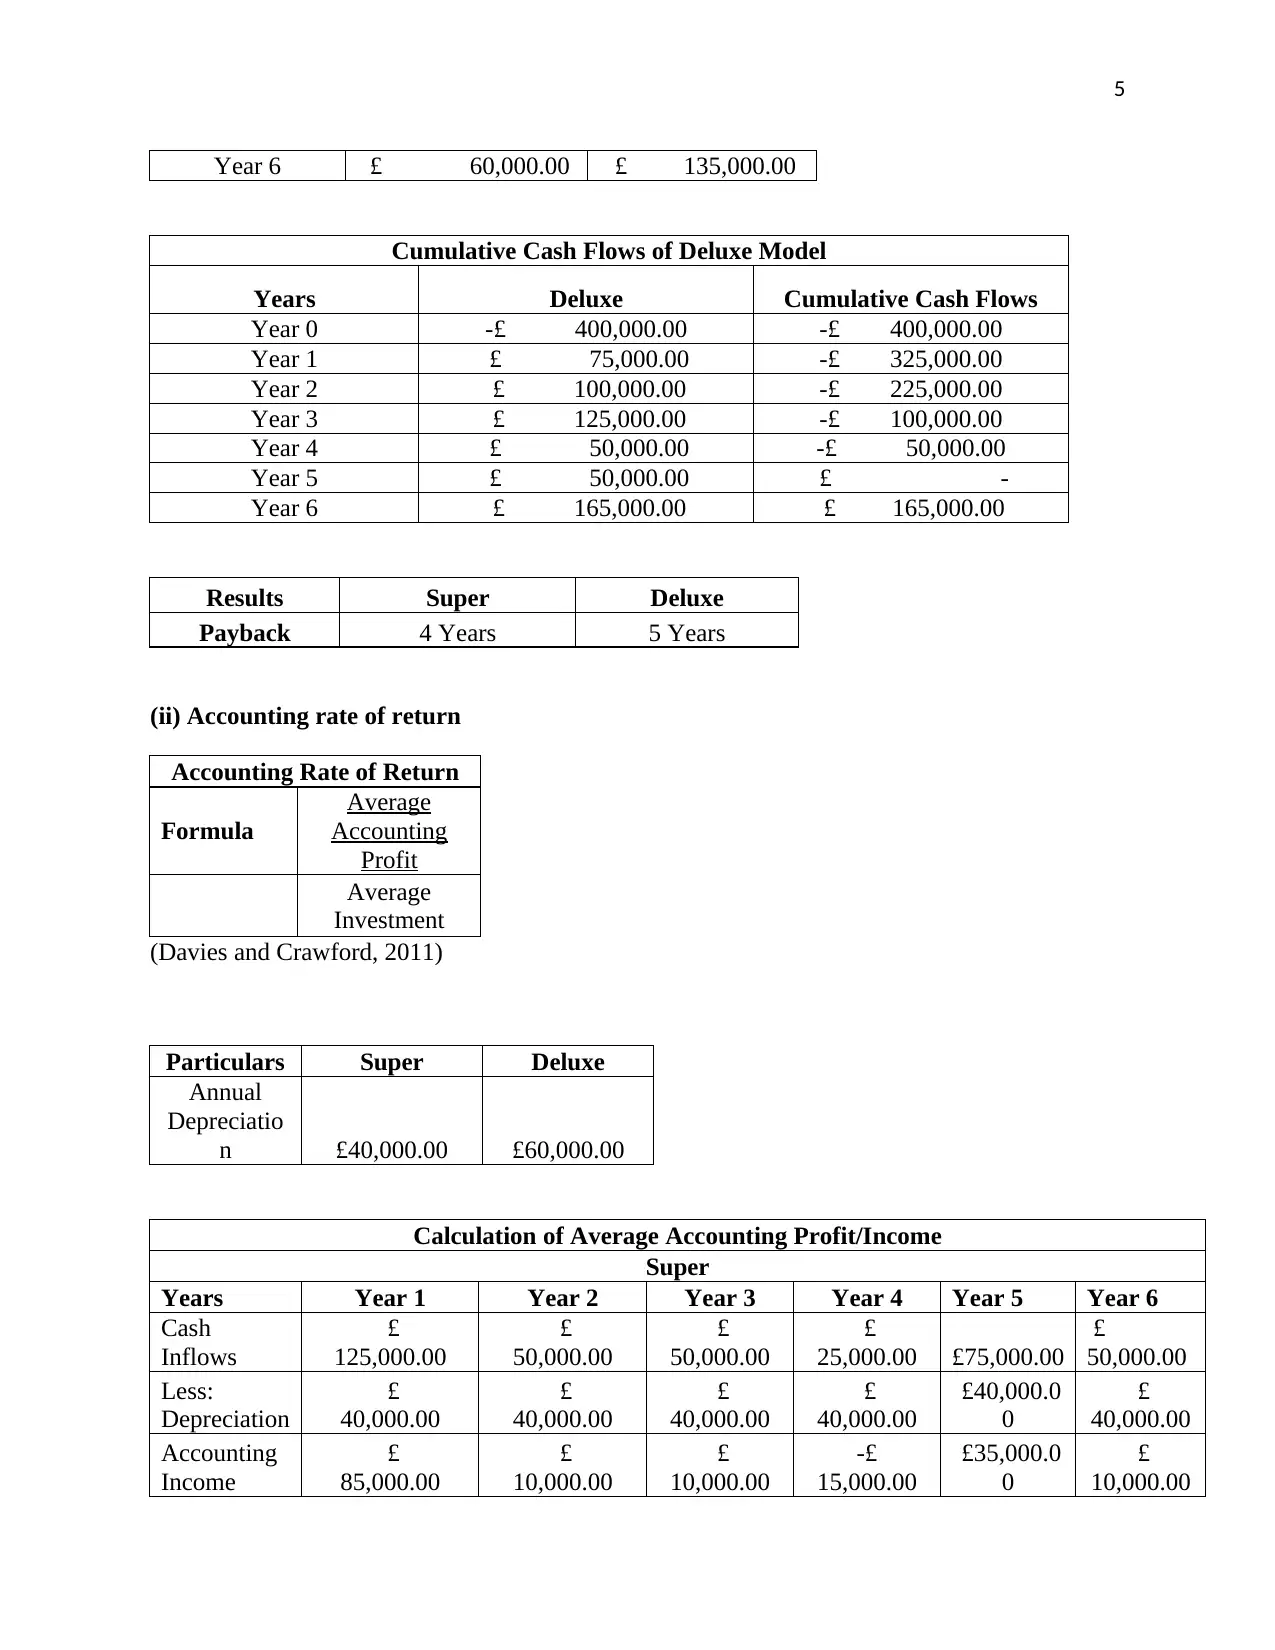
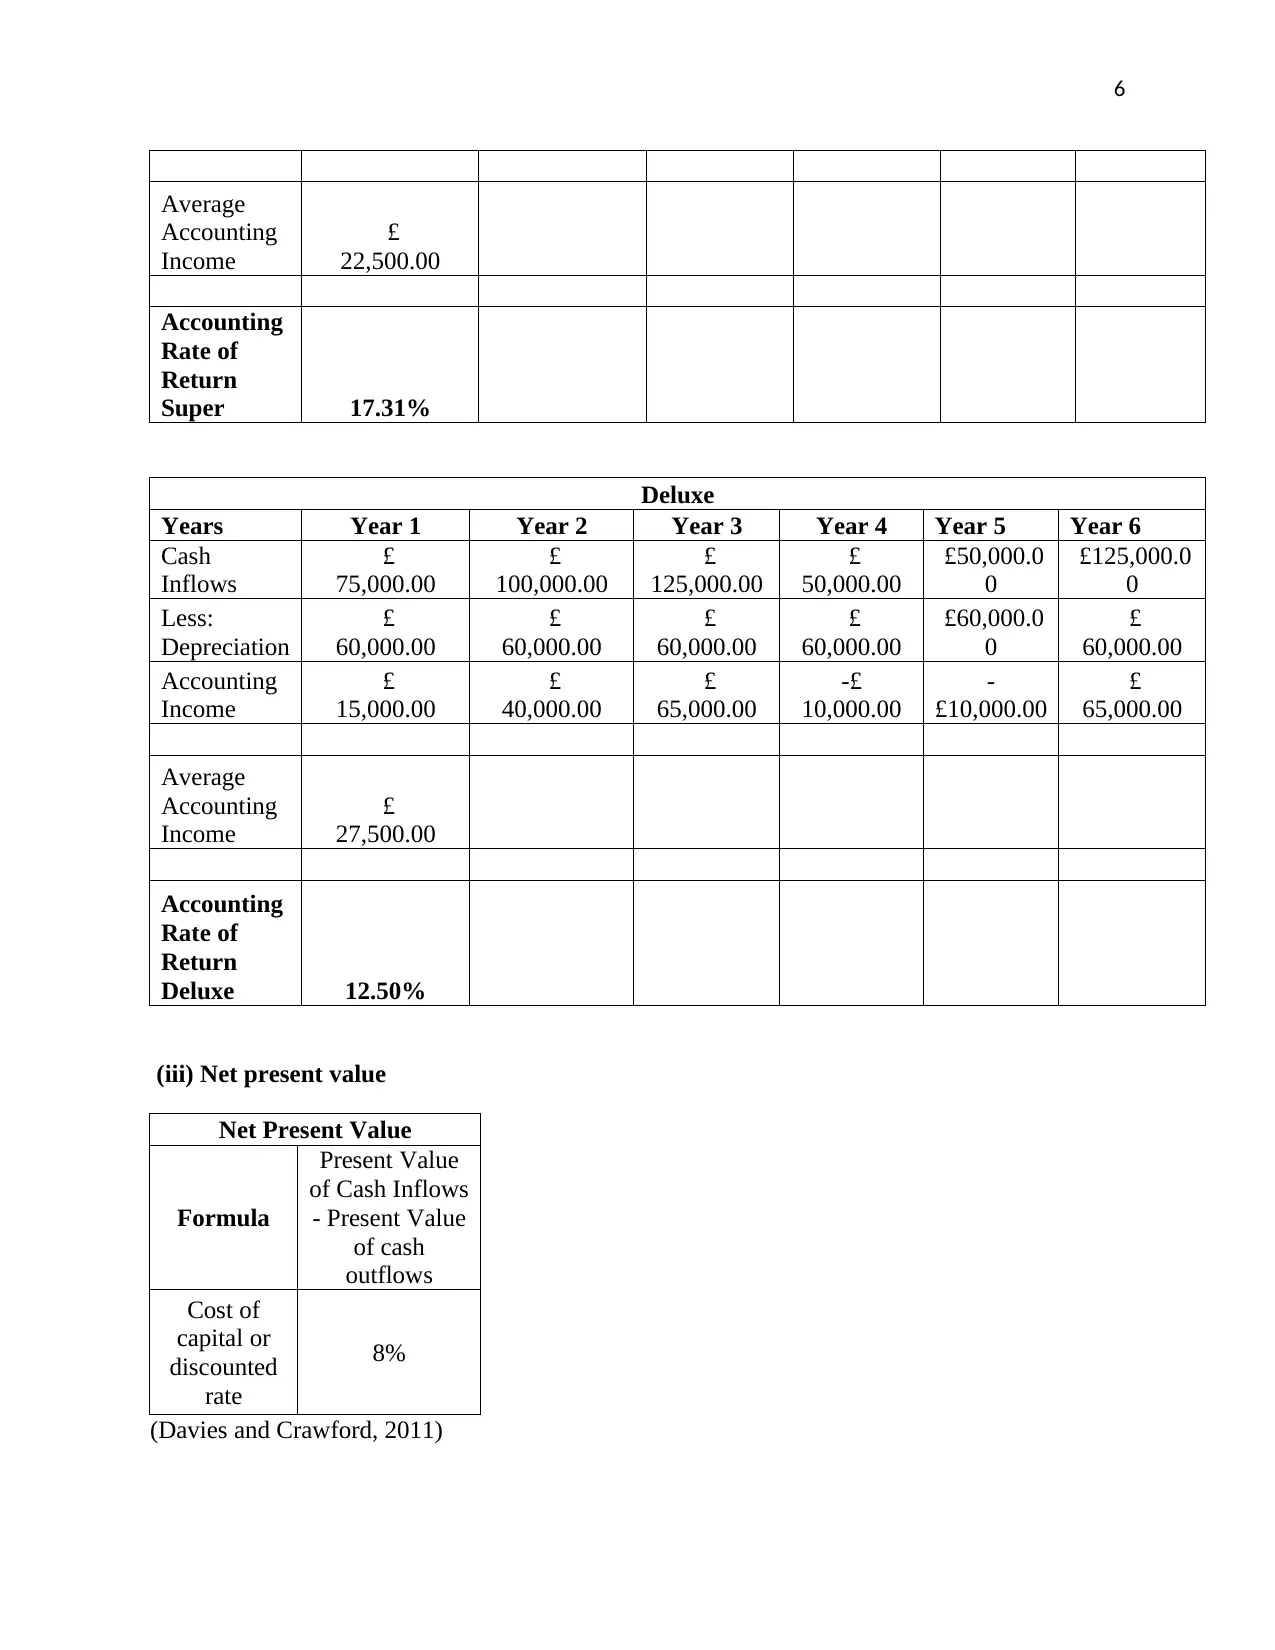
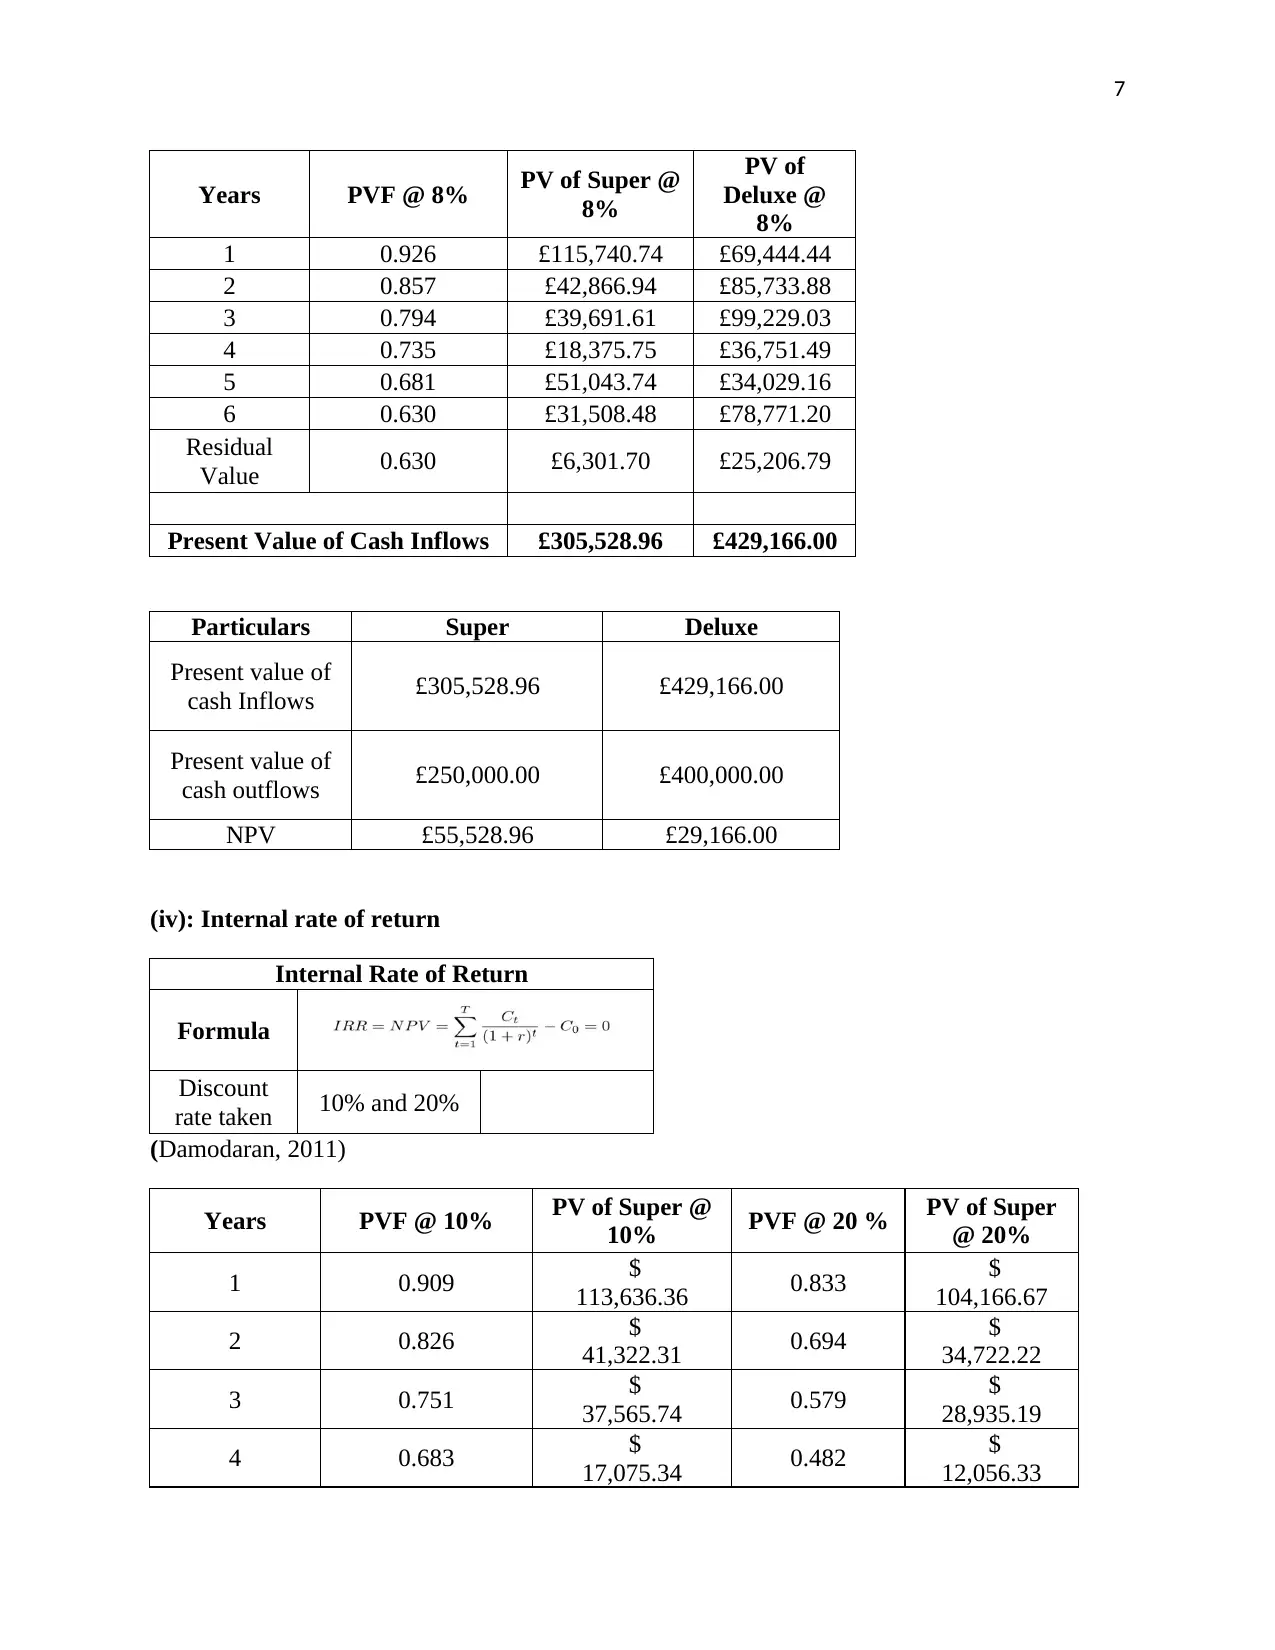
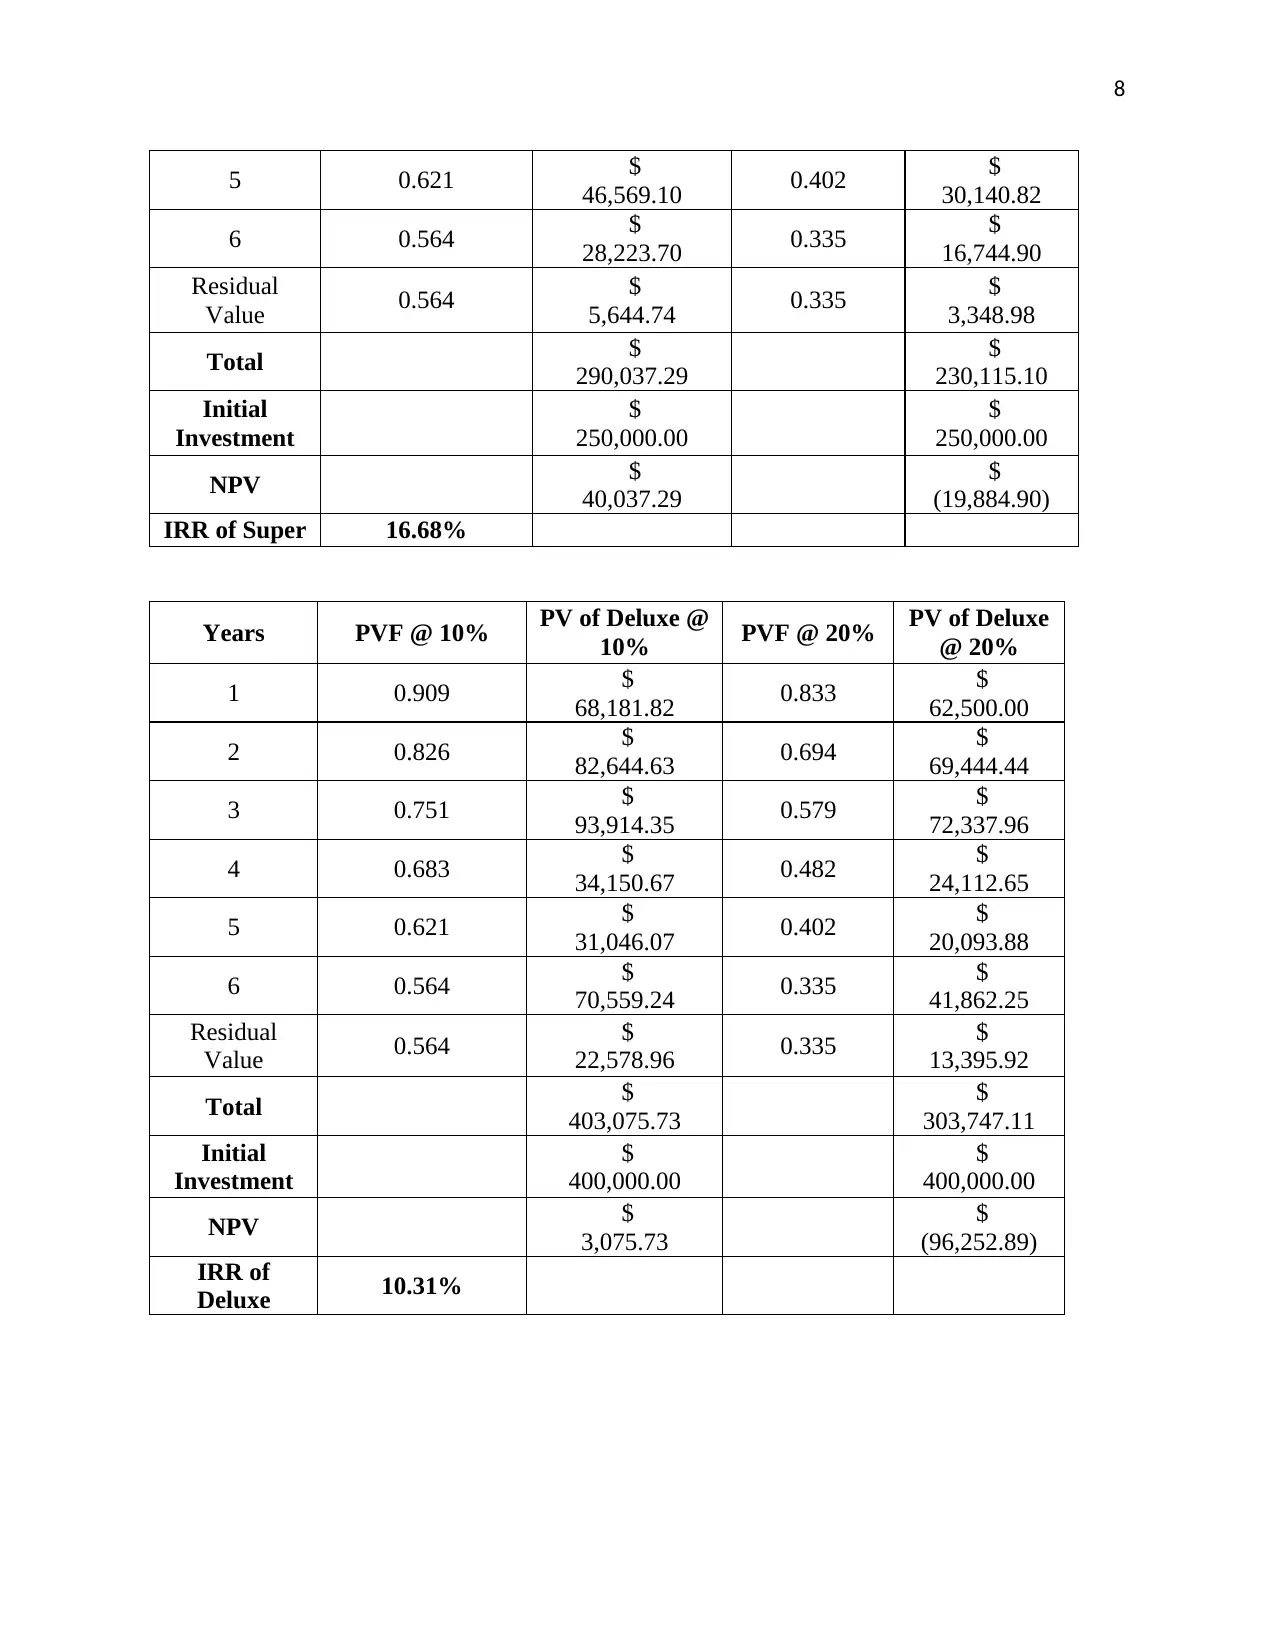
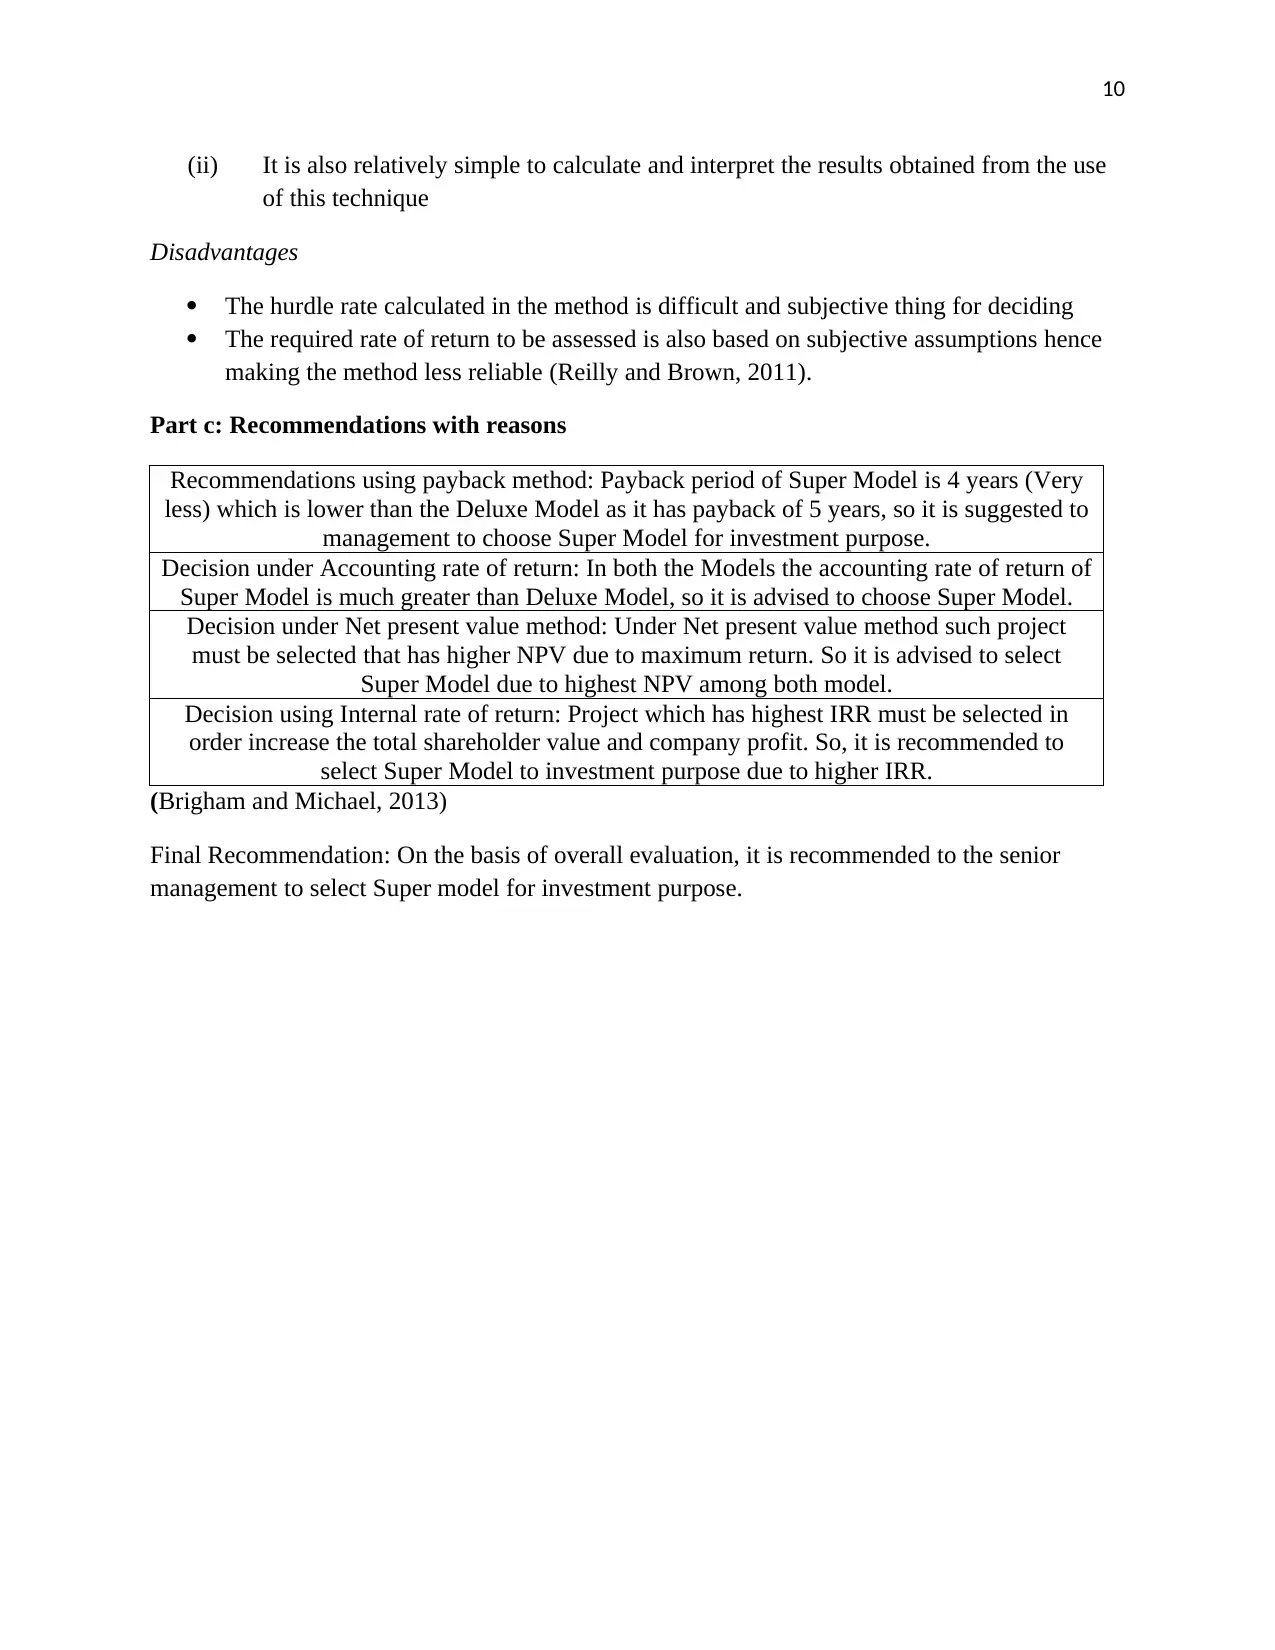
This report presents a comprehensive financial analysis of Tesco PLC over the period from 2015 to 2018, fulfilling the requirements of a BA4008 coursework assignment. The analysis begins with an evaluation of Tesco's performance, liquidity, and financial structure, utilizing key accounting ratios such as return on shareholders' funds, return on capital employed, and profit margins. The report examines the trends in these ratios, highlighting improvements in profitability and operational efficiency, while also acknowledging the impact of past accounting scandals and external economic factors. Furthermore, the report delves into investment appraisal techniques, including the payback method, accounting rate of return, net present value (NPV), and internal rate of return (IRR), to evaluate two investment models ('Super' and 'Deluxe'). The analysis calculates and compares the results of each method, providing recommendations to senior management regarding the selection of the most viable investment option. The report concludes with a summary of the advantages and disadvantages of each investment appraisal technique, justifying the final recommendation based on the overall evaluation and the specific context of Tesco's financial performance.
Contribute Materials
Your contribution can guide someone’s learning journey. Share your
documents today.

1
BA 4008 Business Decision Making
Coursework
BA 4008 Business Decision Making
Coursework
Secure Best Marks with AI Grader
Need help grading? Try our AI Grader for instant feedback on your assignments.

2
Task One
Part 1: Analysis and Evaluation of the Performance, Liquidity and Financial Structure of
Tesco over the Financial Period 2015-2018
Profitability Analysis
Tesco Plc has largely improved its profitability position as evident from increasing trend
of the ratios such as return on shareholder funds with increase in its statutory profit from 2015-
2018 enabling it to pay larger dividends for the shareholders (Tesco PLC: Understanding Tesco,
2018). There is also improvement in the returns realized from capital employed with high sales
growth realized in its core businesses over the financial period 2015-2018 (Tesco Plc: Annual
Report, 2018). The increase in return on total assets ratio over the selected financial period also
indicates that the company is able to derive increasing profits from the assets utilized and also
there has been increase in its gross profit margin over the years 2015-2018. Thus, it can be said
that the company in the financial year 2018 is able to recover from the losses suffered by it in the
financial year 2015 due to reported fraudulent accounting activities (BBC News, 2018). The
increase in the profits realized from per employee on unit basis also indicates that it is able to
realize increasing profits from its workforce.
Operational Analysis
The operational analysis of the company as depicted from the increasing trend of ratios of
interest coverage, stock turnover and creditors payment over the financial years 2015-2018 has
revealed that it is able to effectively meet its debt obligations, realize sales from its inventory and
is also paying its creditors in a regular manner which reveals that it is having a good operational
efficiency. Also, the decreasing trend of debtor collection also indicates that it is able to collect
its debt in a regular manner. The good operational efficiency of the company is also supported by
its increased retail operating cash flows during the financial years 2015-2018. The retail
operating cash has supported by the increase of £495m in the financial year 2018(Tesco Plc:
Annual Report, 2018).
Liquidity Analysis
The company has also reported improvement in its liquidity position from the financial
years 2015-2018 as analyzed with the trend of the ratios such as current and liquidity ratio. The
increase in the current and liquidity ratio depicts an increase in the current assets as compared to
current liabilities.
The company has also depicted a decrease in the capital expenditure in the financial year
2018 as compared to the previous year and thus it is able to deliver attractive returns as
illustrated from its annual report:

3
(Source: Tesco Plc: Annual Report, 2018)
Part 2: Limitations in the use of accounting ratios
The evaluation of the financial performance of Tesco Plc from the use of technique of
ratio analysis also suffers from the limitation of using only historical information and therefore
not reliable to analyze its future performance. The financial statements information are also
subjected to fluctuations from the economic conditions such as inflation and this make the
technique less effective for comparative analysis (Bragg, 2010).
Part 3: Evaluation of Tesco Performance over the Financial Years 2015-2018
It can be said from the analysis of the company performance over the selected financial
period that the company is taking strong measures top recover itself from the losses suffered in
the financial year 2015 due to occurrence of fraudulent accounting scandal. The Serious Fraud
Office (SFO) has reported that it has done about £246m accounting scandal in the supermarket
chain. The accounting scandal has resulted in the occurrence of high losses as depicted from its
weak profitability, operational and liquidity performance in the financial year 2015. However, it
has taken strong measures to recover from these losses by increase in its sales in its group
performance. Its share prices have however declined by 9 per cent in the financial year 2018 due
to challenging external environment conditions such as inflation and aftermath of Brexit (Eley,
2018). Its share prices has however risen from the financial year 2016 to 2018 due to increase in
its operating profit as illustrated below:
(Source: https://www.ft.com/content/a0863b1c-c6d0-11e8-ba8f-ee390057b8c9)

4
Task Two
Part a: Investment appraisal techniques
Given Data
Years Particulars Super Deluxe
Year 0 Initial Investment -£ 250,000.00 -£ 400,000.00
Year 1 Cash Inflow £ 125,000.00 £ 75,000.00
Year 2 Cash Inflow £ 50,000.00 £ 100,000.00
Year 3 Cash Inflow £ 50,000.00 £ 125,000.00
Year 4 Cash Inflow £ 25,000.00 £ 50,000.00
Year 5 Cash Inflow £ 75,000.00 £ 50,000.00
Year 6 Cash Inflow £ 50,000.00 £ 125,000.00
Year 6 Scrap value £ 10,000.00 £ 40,000.00
Cost of Capital 8%
(i): Payback Method
Payback Method
For Even cash
inflows
For Uneven Cash
Inflows
Initial Investment A+ B/C
Cash Inflow per
Period
Where:
A is the last period with a negative
cumulative cash flow;
B is the absolute value of cumulative cash
flow at the end of the period A;
C is the total cash flow during the period
after A
(Davies and Crawford, 2011)
Cumulative Cash Flows of Super Model
Years Super
Cumulative Cash
Flows
Year 0 -£ 250,000.00 -£ 250,000.00
Year 1 £ 125,000.00 -£ 125,000.00
Year 2 £ 50,000.00 -£ 75,000.00
Year 3 £ 50,000.00 -£ 25,000.00
Year 4 £ 25,000.00 £ -
Year 5 £ 75,000.00 £ 75,000.00
Secure Best Marks with AI Grader
Need help grading? Try our AI Grader for instant feedback on your assignments.

5
Year 6 £ 60,000.00 £ 135,000.00
Cumulative Cash Flows of Deluxe Model
Years Deluxe Cumulative Cash Flows
Year 0 -£ 400,000.00 -£ 400,000.00
Year 1 £ 75,000.00 -£ 325,000.00
Year 2 £ 100,000.00 -£ 225,000.00
Year 3 £ 125,000.00 -£ 100,000.00
Year 4 £ 50,000.00 -£ 50,000.00
Year 5 £ 50,000.00 £ -
Year 6 £ 165,000.00 £ 165,000.00
Results Super Deluxe
Payback 4 Years 5 Years
(ii) Accounting rate of return
Accounting Rate of Return
Formula
Average
Accounting
Profit
Average
Investment
(Davies and Crawford, 2011)
Particulars Super Deluxe
Annual
Depreciatio
n £40,000.00 £60,000.00
Calculation of Average Accounting Profit/Income
Super
Years Year 1 Year 2 Year 3 Year 4 Year 5 Year 6
Cash
Inflows
£
125,000.00
£
50,000.00
£
50,000.00
£
25,000.00 £75,000.00
£
50,000.00
Less:
Depreciation
£
40,000.00
£
40,000.00
£
40,000.00
£
40,000.00
£40,000.0
0
£
40,000.00
Accounting
Income
£
85,000.00
£
10,000.00
£
10,000.00
-£
15,000.00
£35,000.0
0
£
10,000.00

6
Average
Accounting
Income
£
22,500.00
Accounting
Rate of
Return
Super 17.31%
Deluxe
Years Year 1 Year 2 Year 3 Year 4 Year 5 Year 6
Cash
Inflows
£
75,000.00
£
100,000.00
£
125,000.00
£
50,000.00
£50,000.0
0
£125,000.0
0
Less:
Depreciation
£
60,000.00
£
60,000.00
£
60,000.00
£
60,000.00
£60,000.0
0
£
60,000.00
Accounting
Income
£
15,000.00
£
40,000.00
£
65,000.00
-£
10,000.00
-
£10,000.00
£
65,000.00
Average
Accounting
Income
£
27,500.00
Accounting
Rate of
Return
Deluxe 12.50%
(iii) Net present value
Net Present Value
Formula
Present Value
of Cash Inflows
- Present Value
of cash
outflows
Cost of
capital or
discounted
rate
8%
(Davies and Crawford, 2011)
Average
Accounting
Income
£
22,500.00
Accounting
Rate of
Return
Super 17.31%
Deluxe
Years Year 1 Year 2 Year 3 Year 4 Year 5 Year 6
Cash
Inflows
£
75,000.00
£
100,000.00
£
125,000.00
£
50,000.00
£50,000.0
0
£125,000.0
0
Less:
Depreciation
£
60,000.00
£
60,000.00
£
60,000.00
£
60,000.00
£60,000.0
0
£
60,000.00
Accounting
Income
£
15,000.00
£
40,000.00
£
65,000.00
-£
10,000.00
-
£10,000.00
£
65,000.00
Average
Accounting
Income
£
27,500.00
Accounting
Rate of
Return
Deluxe 12.50%
(iii) Net present value
Net Present Value
Formula
Present Value
of Cash Inflows
- Present Value
of cash
outflows
Cost of
capital or
discounted
rate
8%
(Davies and Crawford, 2011)

7
Years PVF @ 8% PV of Super @
8%
PV of
Deluxe @
8%
1 0.926 £115,740.74 £69,444.44
2 0.857 £42,866.94 £85,733.88
3 0.794 £39,691.61 £99,229.03
4 0.735 £18,375.75 £36,751.49
5 0.681 £51,043.74 £34,029.16
6 0.630 £31,508.48 £78,771.20
Residual
Value 0.630 £6,301.70 £25,206.79
Present Value of Cash Inflows £305,528.96 £429,166.00
Particulars Super Deluxe
Present value of
cash Inflows £305,528.96 £429,166.00
Present value of
cash outflows £250,000.00 £400,000.00
NPV £55,528.96 £29,166.00
(iv): Internal rate of return
Internal Rate of Return
Formula
Discount
rate taken 10% and 20%
(Damodaran, 2011)
Years PVF @ 10% PV of Super @
10% PVF @ 20 % PV of Super
@ 20%
1 0.909 $
113,636.36 0.833 $
104,166.67
2 0.826 $
41,322.31 0.694 $
34,722.22
3 0.751 $
37,565.74 0.579 $
28,935.19
4 0.683 $
17,075.34 0.482 $
12,056.33
Paraphrase This Document
Need a fresh take? Get an instant paraphrase of this document with our AI Paraphraser

8
5 0.621 $
46,569.10 0.402 $
30,140.82
6 0.564 $
28,223.70 0.335 $
16,744.90
Residual
Value 0.564 $
5,644.74 0.335 $
3,348.98
Total $
290,037.29
$
230,115.10
Initial
Investment
$
250,000.00
$
250,000.00
NPV $
40,037.29
$
(19,884.90)
IRR of Super 16.68%
Years PVF @ 10% PV of Deluxe @
10% PVF @ 20% PV of Deluxe
@ 20%
1 0.909 $
68,181.82 0.833 $
62,500.00
2 0.826 $
82,644.63 0.694 $
69,444.44
3 0.751 $
93,914.35 0.579 $
72,337.96
4 0.683 $
34,150.67 0.482 $
24,112.65
5 0.621 $
31,046.07 0.402 $
20,093.88
6 0.564 $
70,559.24 0.335 $
41,862.25
Residual
Value 0.564 $
22,578.96 0.335 $
13,395.92
Total $
403,075.73
$
303,747.11
Initial
Investment
$
400,000.00
$
400,000.00
NPV $
3,075.73
$
(96,252.89)
IRR of
Deluxe 10.31%
5 0.621 $
46,569.10 0.402 $
30,140.82
6 0.564 $
28,223.70 0.335 $
16,744.90
Residual
Value 0.564 $
5,644.74 0.335 $
3,348.98
Total $
290,037.29
$
230,115.10
Initial
Investment
$
250,000.00
$
250,000.00
NPV $
40,037.29
$
(19,884.90)
IRR of Super 16.68%
Years PVF @ 10% PV of Deluxe @
10% PVF @ 20% PV of Deluxe
@ 20%
1 0.909 $
68,181.82 0.833 $
62,500.00
2 0.826 $
82,644.63 0.694 $
69,444.44
3 0.751 $
93,914.35 0.579 $
72,337.96
4 0.683 $
34,150.67 0.482 $
24,112.65
5 0.621 $
31,046.07 0.402 $
20,093.88
6 0.564 $
70,559.24 0.335 $
41,862.25
Residual
Value 0.564 $
22,578.96 0.335 $
13,395.92
Total $
403,075.73
$
303,747.11
Initial
Investment
$
400,000.00
$
400,000.00
NPV $
3,075.73
$
(96,252.89)
IRR of
Deluxe 10.31%

9
Part b: Report to Senior Management
b)Advantages & Disadvantages of Investment Appraisal Techniques
(i) Pay back
Advantages
It is relatively simpler to use as it can easily compare the several projects and then
selected the feasible investment proposal that has shortest payback time.
Disadvantages
It does not consider the time value of money
It does not take into account the negative cash flows received after payback period
(Reilly and Brown, 2011).
(ii)Accounting Rate of Return
Advantages
It is easy to calculate and also simple to apply for selecting the best investment project
It is useful for measuring the profitability of the investment on the basis of accounting
profit
Disadvantages
It ignores time value of money
It also does not consider the cash flow from investment (Brigham and Michael, 2013)
(iii) Net Present Value
Advantages
It considers the time value of money
It helps in assessing the potential profitability and risk of the investment project
Disadvantages
It is relatively difficult to implement due to complexity in calculating the adequate
discount rate
It does not result in giving accurate decisions for projects having unequal life
(iv) Internal Rate of Return
Advantages
(i) It considers the time value of money

10
(ii) It is also relatively simple to calculate and interpret the results obtained from the use
of this technique
Disadvantages
The hurdle rate calculated in the method is difficult and subjective thing for deciding
The required rate of return to be assessed is also based on subjective assumptions hence
making the method less reliable (Reilly and Brown, 2011).
Part c: Recommendations with reasons
Recommendations using payback method: Payback period of Super Model is 4 years (Very
less) which is lower than the Deluxe Model as it has payback of 5 years, so it is suggested to
management to choose Super Model for investment purpose.
Decision under Accounting rate of return: In both the Models the accounting rate of return of
Super Model is much greater than Deluxe Model, so it is advised to choose Super Model.
Decision under Net present value method: Under Net present value method such project
must be selected that has higher NPV due to maximum return. So it is advised to select
Super Model due to highest NPV among both model.
Decision using Internal rate of return: Project which has highest IRR must be selected in
order increase the total shareholder value and company profit. So, it is recommended to
select Super Model to investment purpose due to higher IRR.
(Brigham and Michael, 2013)
Final Recommendation: On the basis of overall evaluation, it is recommended to the senior
management to select Super model for investment purpose.
Secure Best Marks with AI Grader
Need help grading? Try our AI Grader for instant feedback on your assignments.

11
Reference
BBC News. 2018. SFO seeks retrial of former Tesco bosses. [Online]. Available at:
https://www.bbc.com/news/business-43253799 [Accessed on: 25 January 2019].
Bragg, S. 2010. Business Ratios and Formulas: A Comprehensive Guide. US: John Wiley &
Sons.
Brigham, F., and Michael C. 2013. Financial management: Theory & practice. Canada: Cengage
Learning.
Brigham, F., and Michael C. 2013. Financial management: Theory & practice. Canada: Cengage
Learning.
Damodaran, A, 2011. Applied corporate finance. USA: John Wiley & sons.
Davies, T. and Crawford, I., 2011. Business accounting and finance. USA: Pearson.
Eley, J. 2018. Tesco shares fall after operating profits disappoint. [Online]. Available at:
https://www.ft.com/content/a0863b1c-c6d0-11e8-ba8f-ee390057b8c9 [Accessed on: 25 January
2019].
Reilly.F.K. and Brown.K.C. 2011. Investment analysis & portfolio management. UK: South
western Cengage learning.
Tesco Plc: Annual Report. 2018. [Online]. Available at:
https://www.tescoplc.com/media/474793/tesco_ar_2018.pdf [Accessed on: 25 January 2019].
Tesco PLC: Understanding Tesco. 2018. [Online]. Available at:
https://www.tescoplc.com/investors/understanding-tesco/ [Accessed on: 25 January 2019].
1 out of 11
Related Documents

Your All-in-One AI-Powered Toolkit for Academic Success.
+13062052269
info@desklib.com
Available 24*7 on WhatsApp / Email
Unlock your academic potential
© 2024 | Zucol Services PVT LTD | All rights reserved.