Analysis and Interpretation of Financial Ratios: Tesco PLC Performance
VerifiedAdded on  2023/06/08
|9
|2180
|280
Report
AI Summary
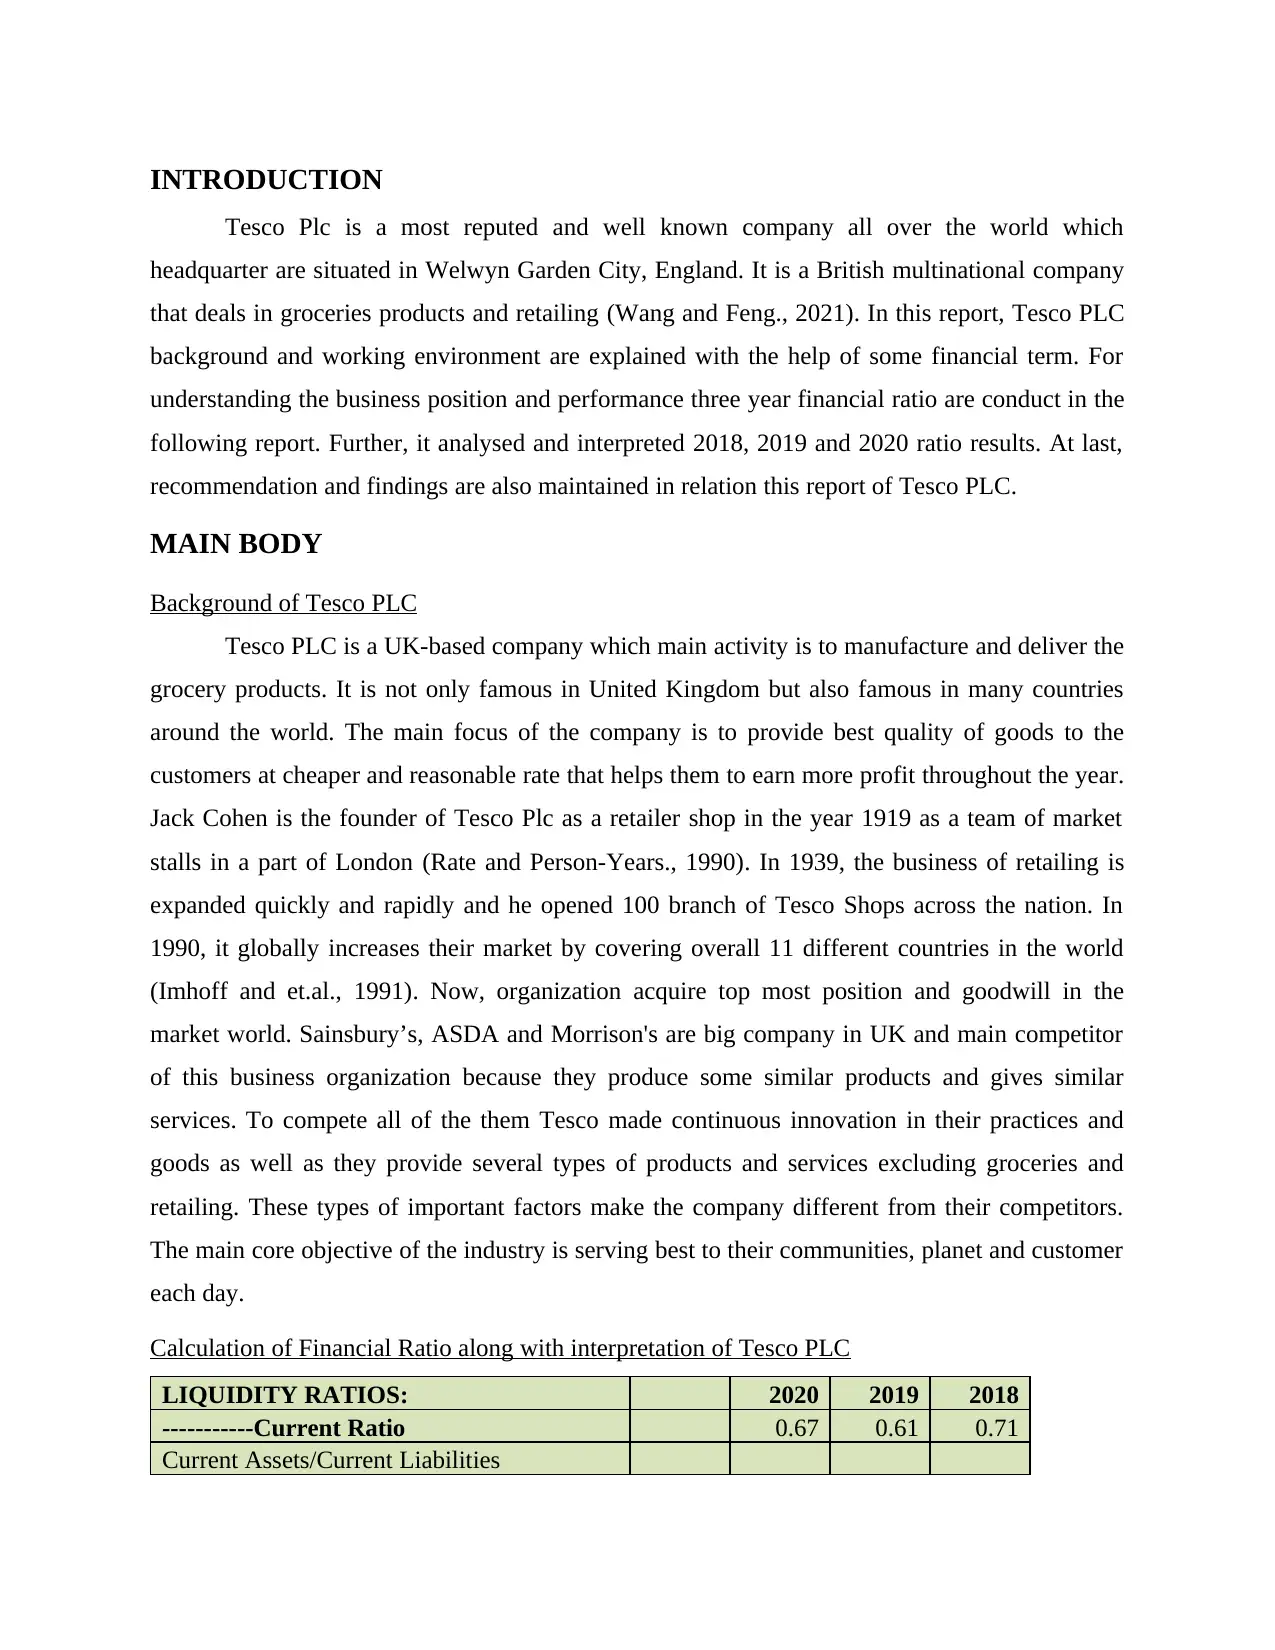
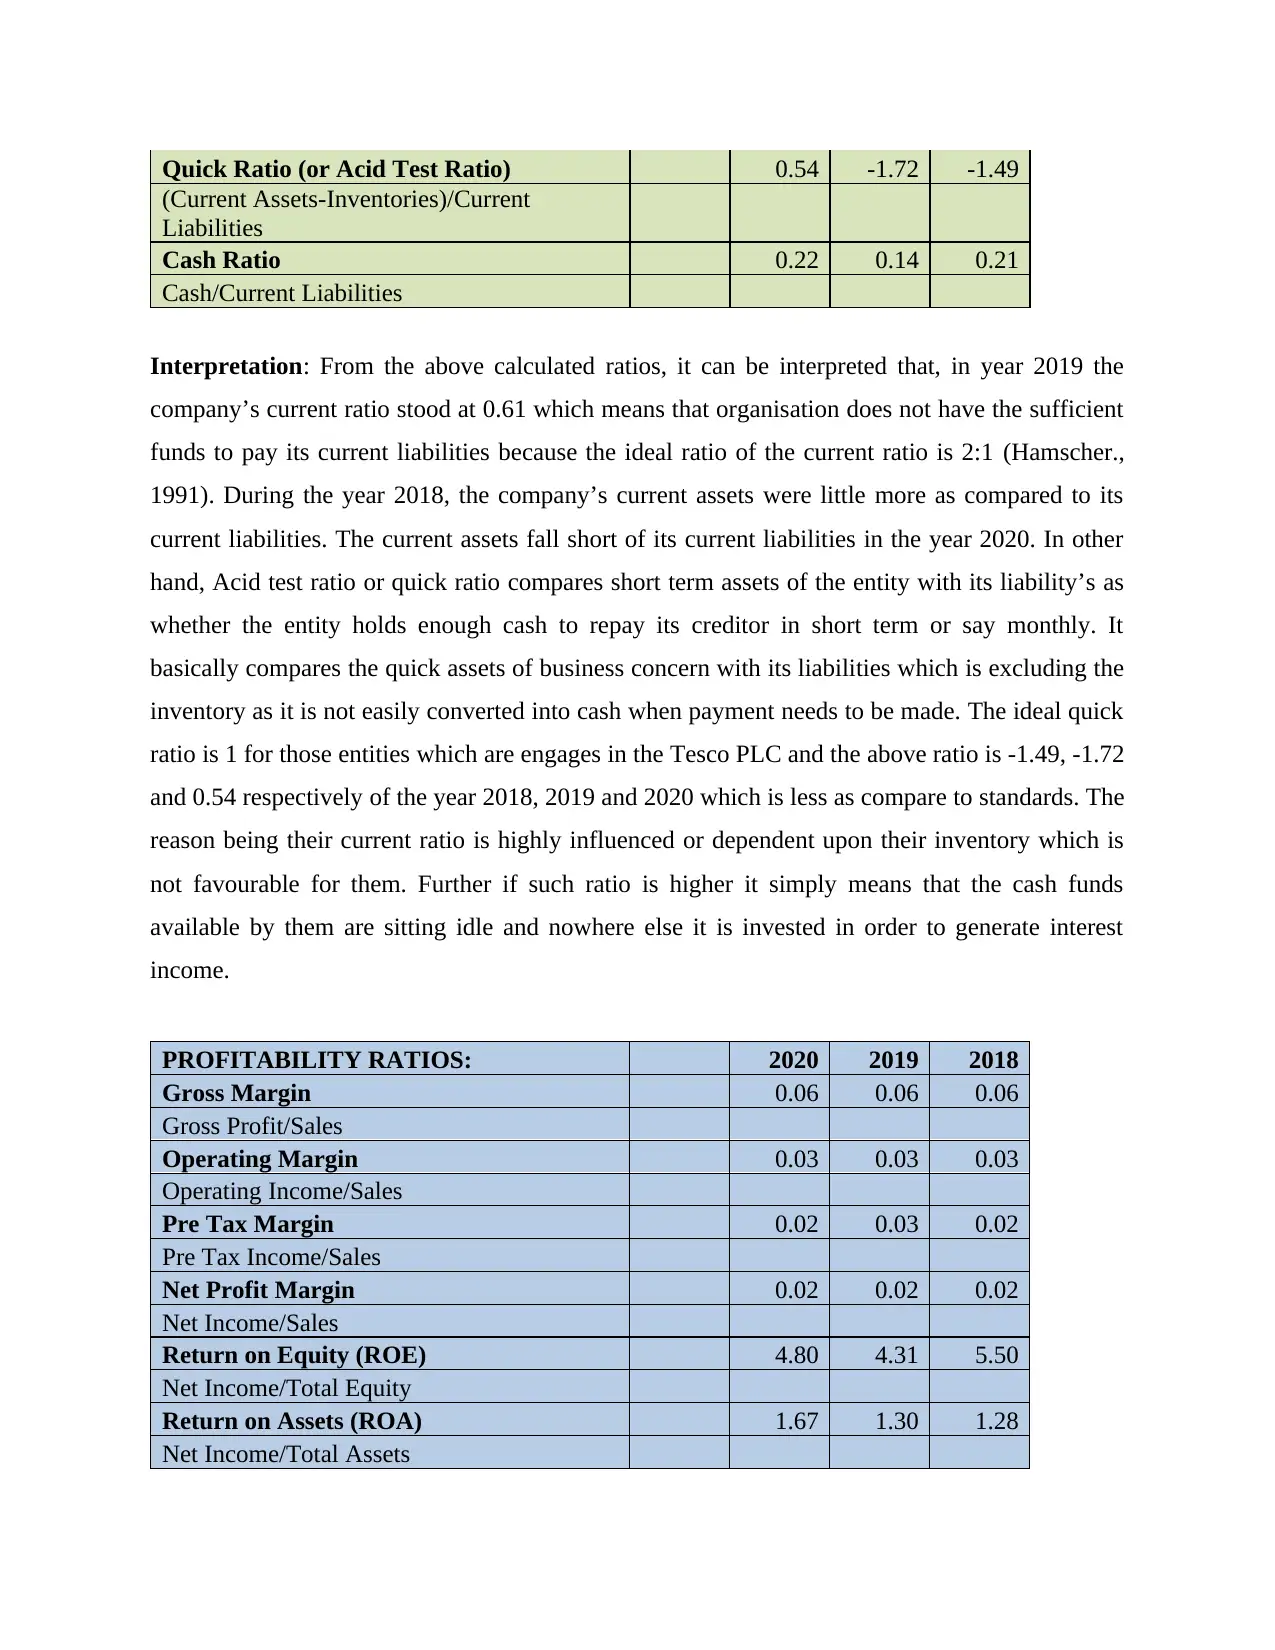
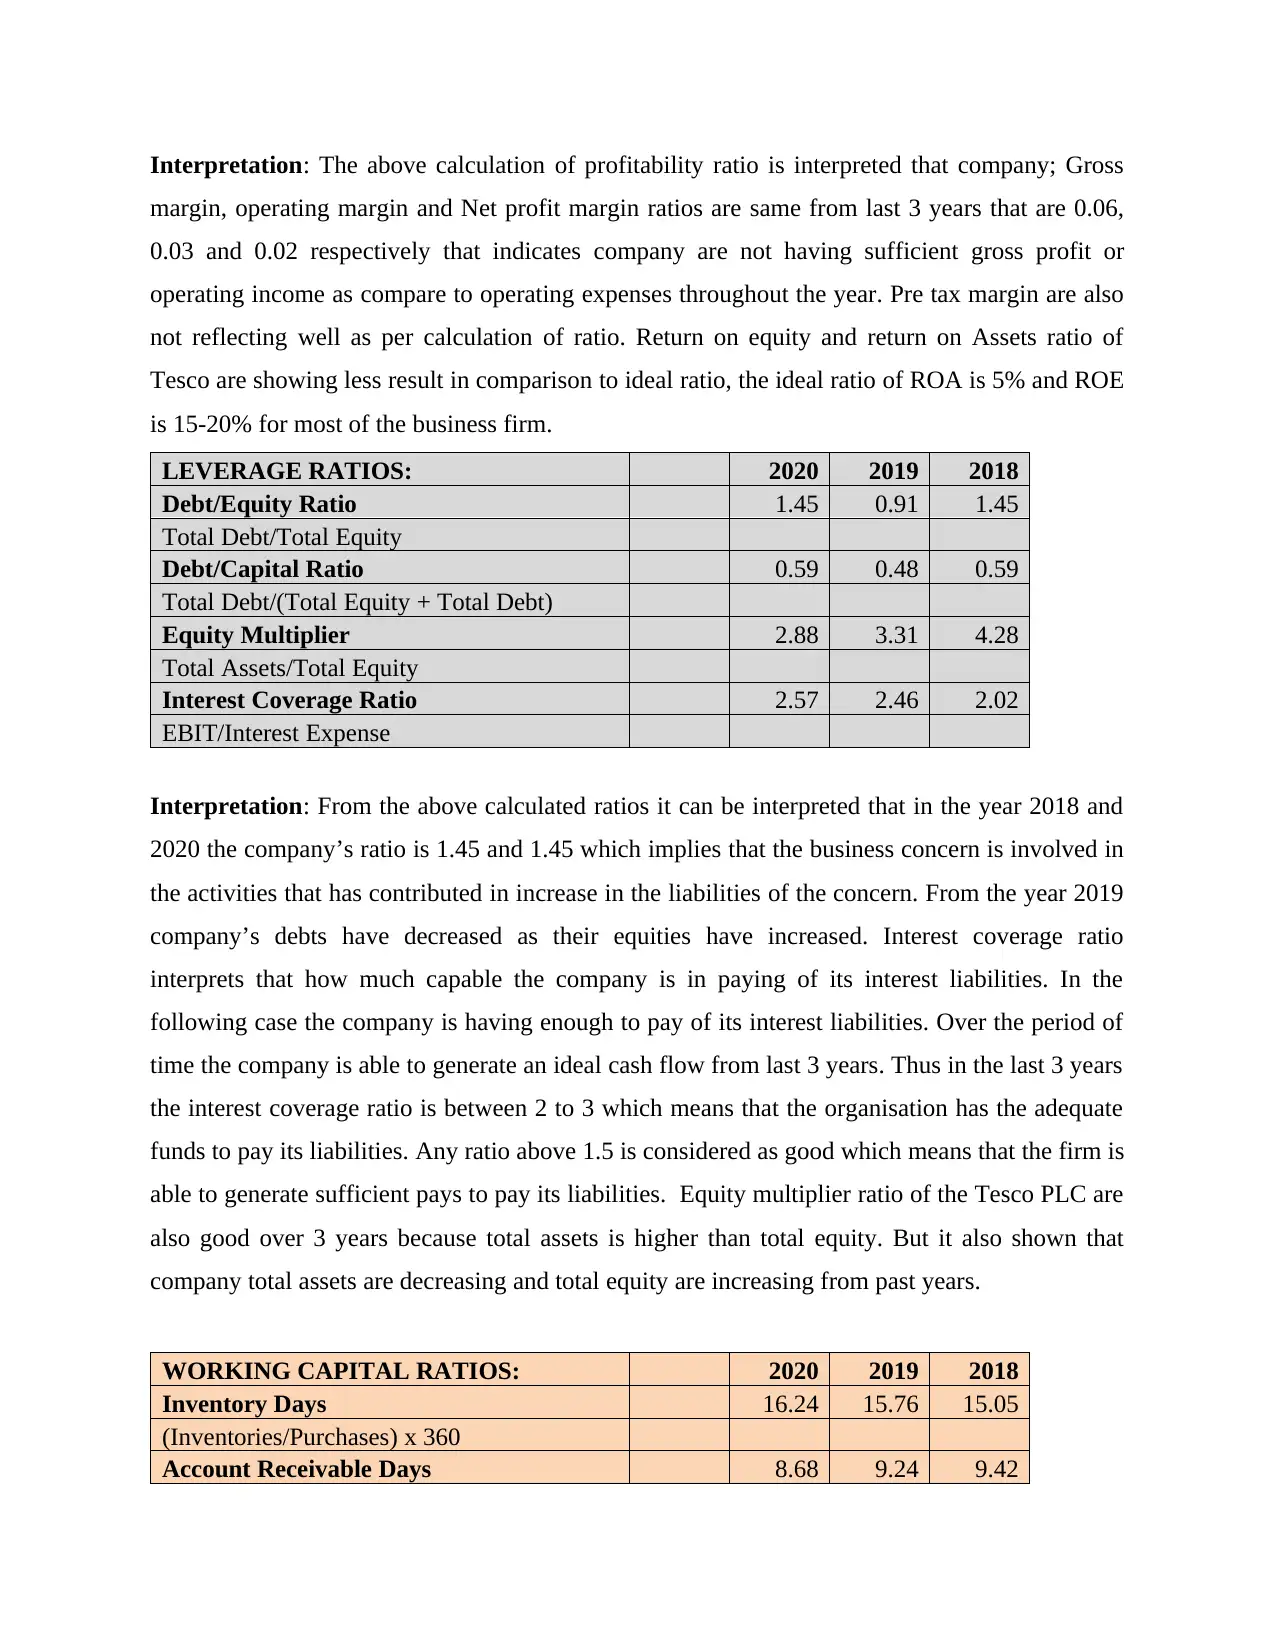
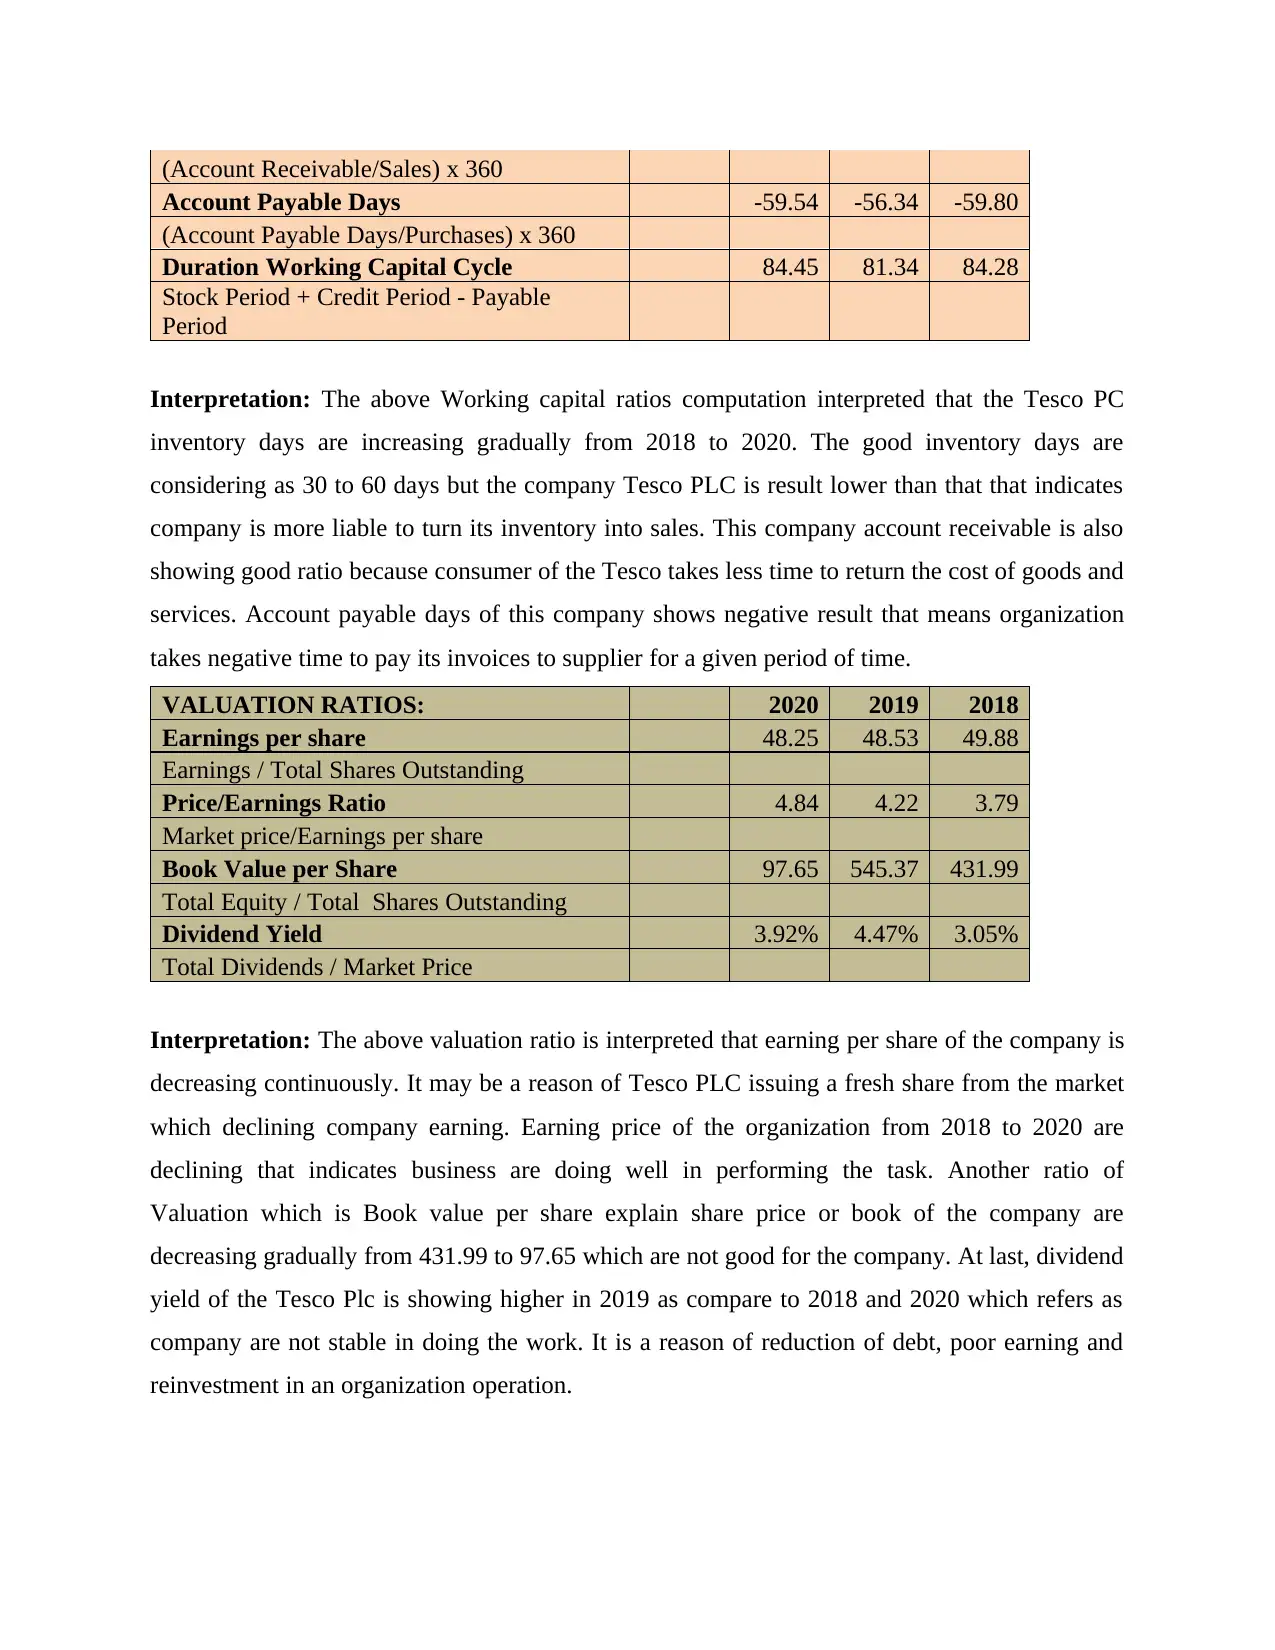
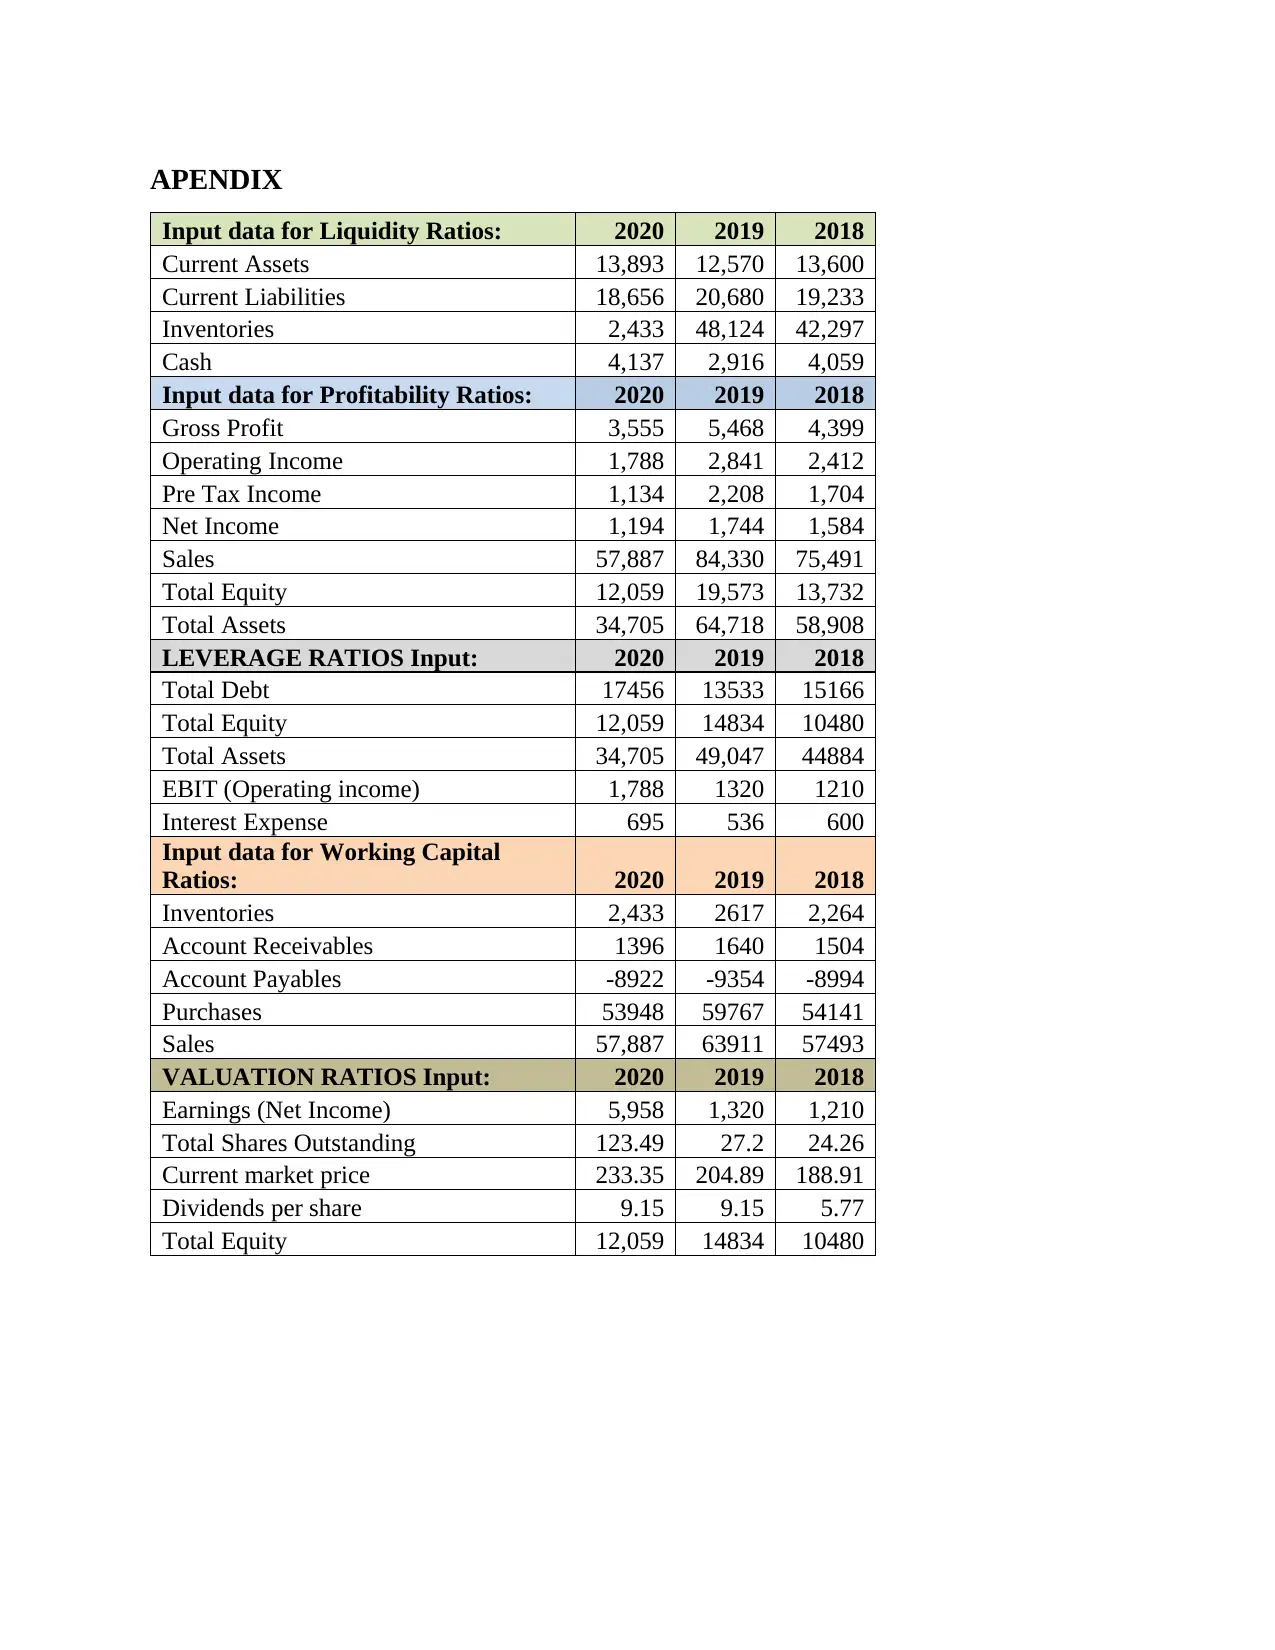
This report presents a comprehensive financial analysis of Tesco PLC, examining its performance from 2018 to 2020. The analysis encompasses various financial ratios, categorized into liquidity, profitability, leverage, working capital, and valuation ratios. The report begins with an introduction to Tesco PLC, followed by the calculation and interpretation of each ratio category. Liquidity ratios, such as the current and quick ratios, are assessed to determine the company's ability to meet short-term obligations. Profitability ratios, including gross margin and net profit margin, are analyzed to evaluate the company's efficiency in generating profits. Leverage ratios, like the debt-to-equity ratio, are used to assess the company's financial risk. Working capital ratios, such as inventory days and account receivable days, are reviewed to understand the company's operational efficiency. Valuation ratios, including earnings per share and dividend yield, are used to assess the company's market value. The report concludes with recommendations based on the findings and highlights areas for improvement, such as maintaining liquidity and efficiency. The report utilizes financial data from the years 2018, 2019, and 2020 to provide a comparative analysis of Tesco PLC's financial performance over the specified period. The analysis provides insight into the financial health of the company.
Contribute Materials
Your contribution can guide someone’s learning journey. Share your
documents today.

Analysis and
interpretation of
financial ratios
interpretation of
financial ratios
Secure Best Marks with AI Grader
Need help grading? Try our AI Grader for instant feedback on your assignments.

Table of Contents
INTRODUCTION...........................................................................................................................3
MAIN BODY..................................................................................................................................3
Background of Tesco PLC...........................................................................................................3
Calculation of Financial Ratio along with interpretation of Tesco PLC.....................................3
Recommendation.........................................................................................................................7
CONCLUSION................................................................................................................................7
REFERENCES................................................................................................................................8
APENDIX........................................................................................................................................9

INTRODUCTION
Tesco Plc is a most reputed and well known company all over the world which
headquarter are situated in Welwyn Garden City, England. It is a British multinational company
that deals in groceries products and retailing (Wang and Feng., 2021). In this report, Tesco PLC
background and working environment are explained with the help of some financial term. For
understanding the business position and performance three year financial ratio are conduct in the
following report. Further, it analysed and interpreted 2018, 2019 and 2020 ratio results. At last,
recommendation and findings are also maintained in relation this report of Tesco PLC.
MAIN BODY
Background of Tesco PLC
Tesco PLC is a UK-based company which main activity is to manufacture and deliver the
grocery products. It is not only famous in United Kingdom but also famous in many countries
around the world. The main focus of the company is to provide best quality of goods to the
customers at cheaper and reasonable rate that helps them to earn more profit throughout the year.
Jack Cohen is the founder of Tesco Plc as a retailer shop in the year 1919 as a team of market
stalls in a part of London (Rate and Person-Years., 1990). In 1939, the business of retailing is
expanded quickly and rapidly and he opened 100 branch of Tesco Shops across the nation. In
1990, it globally increases their market by covering overall 11 different countries in the world
(Imhoff and et.al., 1991). Now, organization acquire top most position and goodwill in the
market world. Sainsbury’s, ASDA and Morrison's are big company in UK and main competitor
of this business organization because they produce some similar products and gives similar
services. To compete all of the them Tesco made continuous innovation in their practices and
goods as well as they provide several types of products and services excluding groceries and
retailing. These types of important factors make the company different from their competitors.
The main core objective of the industry is serving best to their communities, planet and customer
each day.
Calculation of Financial Ratio along with interpretation of Tesco PLC
LIQUIDITY RATIOS: 2020 2019 2018
-----------Current Ratio 0.67 0.61 0.71
Current Assets/Current Liabilities

Quick Ratio (or Acid Test Ratio) 0.54 -1.72 -1.49
(Current Assets-Inventories)/Current
Liabilities
Cash Ratio 0.22 0.14 0.21
Cash/Current Liabilities
Interpretation: From the above calculated ratios, it can be interpreted that, in year 2019 the
company’s current ratio stood at 0.61 which means that organisation does not have the sufficient
funds to pay its current liabilities because the ideal ratio of the current ratio is 2:1 (Hamscher.,
1991). During the year 2018, the company’s current assets were little more as compared to its
current liabilities. The current assets fall short of its current liabilities in the year 2020. In other
hand, Acid test ratio or quick ratio compares short term assets of the entity with its liability’s as
whether the entity holds enough cash to repay its creditor in short term or say monthly. It
basically compares the quick assets of business concern with its liabilities which is excluding the
inventory as it is not easily converted into cash when payment needs to be made. The ideal quick
ratio is 1 for those entities which are engages in the Tesco PLC and the above ratio is -1.49, -1.72
and 0.54 respectively of the year 2018, 2019 and 2020 which is less as compare to standards. The
reason being their current ratio is highly influenced or dependent upon their inventory which is
not favourable for them. Further if such ratio is higher it simply means that the cash funds
available by them are sitting idle and nowhere else it is invested in order to generate interest
income.
PROFITABILITY RATIOS: 2020 2019 2018
Gross Margin 0.06 0.06 0.06
Gross Profit/Sales
Operating Margin 0.03 0.03 0.03
Operating Income/Sales
Pre Tax Margin 0.02 0.03 0.02
Pre Tax Income/Sales
Net Profit Margin 0.02 0.02 0.02
Net Income/Sales
Return on Equity (ROE) 4.80 4.31 5.50
Net Income/Total Equity
Return on Assets (ROA) 1.67 1.30 1.28
Net Income/Total Assets
Secure Best Marks with AI Grader
Need help grading? Try our AI Grader for instant feedback on your assignments.

Interpretation: The above calculation of profitability ratio is interpreted that company; Gross
margin, operating margin and Net profit margin ratios are same from last 3 years that are 0.06,
0.03 and 0.02 respectively that indicates company are not having sufficient gross profit or
operating income as compare to operating expenses throughout the year. Pre tax margin are also
not reflecting well as per calculation of ratio. Return on equity and return on Assets ratio of
Tesco are showing less result in comparison to ideal ratio, the ideal ratio of ROA is 5% and ROE
is 15-20% for most of the business firm.
LEVERAGE RATIOS: 2020 2019 2018
Debt/Equity Ratio 1.45 0.91 1.45
Total Debt/Total Equity
Debt/Capital Ratio 0.59 0.48 0.59
Total Debt/(Total Equity + Total Debt)
Equity Multiplier 2.88 3.31 4.28
Total Assets/Total Equity
Interest Coverage Ratio 2.57 2.46 2.02
EBIT/Interest Expense
Interpretation: From the above calculated ratios it can be interpreted that in the year 2018 and
2020 the company’s ratio is 1.45 and 1.45 which implies that the business concern is involved in
the activities that has contributed in increase in the liabilities of the concern. From the year 2019
company’s debts have decreased as their equities have increased. Interest coverage ratio
interprets that how much capable the company is in paying of its interest liabilities. In the
following case the company is having enough to pay of its interest liabilities. Over the period of
time the company is able to generate an ideal cash flow from last 3 years. Thus in the last 3 years
the interest coverage ratio is between 2 to 3 which means that the organisation has the adequate
funds to pay its liabilities. Any ratio above 1.5 is considered as good which means that the firm is
able to generate sufficient pays to pay its liabilities. Equity multiplier ratio of the Tesco PLC are
also good over 3 years because total assets is higher than total equity. But it also shown that
company total assets are decreasing and total equity are increasing from past years.
WORKING CAPITAL RATIOS: 2020 2019 2018
Inventory Days 16.24 15.76 15.05
(Inventories/Purchases) x 360
Account Receivable Days 8.68 9.24 9.42

(Account Receivable/Sales) x 360
Account Payable Days -59.54 -56.34 -59.80
(Account Payable Days/Purchases) x 360
Duration Working Capital Cycle 84.45 81.34 84.28
Stock Period + Credit Period - Payable
Period
Interpretation: The above Working capital ratios computation interpreted that the Tesco PC
inventory days are increasing gradually from 2018 to 2020. The good inventory days are
considering as 30 to 60 days but the company Tesco PLC is result lower than that that indicates
company is more liable to turn its inventory into sales. This company account receivable is also
showing good ratio because consumer of the Tesco takes less time to return the cost of goods and
services. Account payable days of this company shows negative result that means organization
takes negative time to pay its invoices to supplier for a given period of time.
VALUATION RATIOS: 2020 2019 2018
Earnings per share 48.25 48.53 49.88
Earnings / Total Shares Outstanding
Price/Earnings Ratio 4.84 4.22 3.79
Market price/Earnings per share
Book Value per Share 97.65 545.37 431.99
Total Equity / Total Shares Outstanding
Dividend Yield 3.92% 4.47% 3.05%
Total Dividends / Market Price
Interpretation: The above valuation ratio is interpreted that earning per share of the company is
decreasing continuously. It may be a reason of Tesco PLC issuing a fresh share from the market
which declining company earning. Earning price of the organization from 2018 to 2020 are
declining that indicates business are doing well in performing the task. Another ratio of
Valuation which is Book value per share explain share price or book of the company are
decreasing gradually from 431.99 to 97.65 which are not good for the company. At last, dividend
yield of the Tesco Plc is showing higher in 2019 as compare to 2018 and 2020 which refers as
company are not stable in doing the work. It is a reason of reduction of debt, poor earning and
reinvestment in an organization operation.

Recommendation
From the above prepared report, it can be recommended that since Return on equity is being
observed to be maximum in year 2018 and next year is observed to decline which reflects that
the company must look after reasons resulting in such outcomes. It is also noticed that the
company has made certain decisions which helped it to get back to the previous position in next
year. Current ratio is recorded as 0.71 in year 2018 which declined to a figure of 0.61 in year
2019 and which again increased in year 2020. Quick ratio has been observed to improve from
year 2018 to year 2020 from negative figure turning into positive figure. Thus it is recommended
that Tesco must find reasons which are resulting in such fluctuations and in what way it could be
improved such that company is able to maintain its liquidity and efficiency in competitive
market.
CONCLUSION
From the above report, it can be concluded that Tesco Plc is a higher profit earning firm
from past years. The company are better performing and manufacturer of goods and services.
The above report interpretate the company position from past 3years by calculating five types of
ratios that are liquidity ratio, profitability ratio, valuation ratio, working capital ratio and leverage
ratio.
Paraphrase This Document
Need a fresh take? Get an instant paraphrase of this document with our AI Paraphraser

REFERENCES
Books and Journals
Wang, M. and Feng, Z., 2021. Pitfalls in X-ray absorption spectroscopy analysis and
interpretation: A practical guide for general users. Current Opinion in Electrochemistry, 30,
p.100803.
Imhoff Jr and et.al., 1991. Operating leases: Impact of constructive capitalization. Accounting
Horizons, 5(1), p.51.
Hamscher, W., 1991, January. Model-based financial data interpretation. In Proceedings First
International Conference on Artificial Intelligence Applications on Wall Street (pp. 178-
179). IEEE Computer Society.
Rate, C. and Person-Years, S.M.R., 1990. Risk of suicide among US veterans after returning
from the Iraq or Afghanistan war zones. US Army, 264(17), pp.2241-2244.
Greco, S., Matarazzo, B. and Slowinski, R., 2002. Rough approximation by dominance
relations. International journal of intelligent systems, 17(2), pp.153-171.
Viswanathan, K.S. and Cummins, J.D., 2003. Ownership structure changes in the insurance
industry: An analysis of demutualization. Journal of Risk and Insurance, 70(3), pp.401-437.
Kerlikowske, K. and et.al., 1996. Likelihood ratios for modern screening mammography: risk of
breast cancer based on age and mammographic interpretation. Jama, 276(1), pp.39-43.

APENDIX
Input data for Liquidity Ratios: 2020 2019 2018
Current Assets 13,893 12,570 13,600
Current Liabilities 18,656 20,680 19,233
Inventories 2,433 48,124 42,297
Cash 4,137 2,916 4,059
Input data for Profitability Ratios: 2020 2019 2018
Gross Profit 3,555 5,468 4,399
Operating Income 1,788 2,841 2,412
Pre Tax Income 1,134 2,208 1,704
Net Income 1,194 1,744 1,584
Sales 57,887 84,330 75,491
Total Equity 12,059 19,573 13,732
Total Assets 34,705 64,718 58,908
LEVERAGE RATIOS Input: 2020 2019 2018
Total Debt 17456 13533 15166
Total Equity 12,059 14834 10480
Total Assets 34,705 49,047 44884
EBIT (Operating income) 1,788 1320 1210
Interest Expense 695 536 600
Input data for Working Capital
Ratios: 2020 2019 2018
Inventories 2,433 2617 2,264
Account Receivables 1396 1640 1504
Account Payables -8922 -9354 -8994
Purchases 53948 59767 54141
Sales 57,887 63911 57493
VALUATION RATIOS Input: 2020 2019 2018
Earnings (Net Income) 5,958 1,320 1,210
Total Shares Outstanding 123.49 27.2 24.26
Current market price 233.35 204.89 188.91
Dividends per share 9.15 9.15 5.77
Total Equity 12,059 14834 10480
1 out of 9
Related Documents

Your All-in-One AI-Powered Toolkit for Academic Success.
 +13062052269
info@desklib.com
Available 24*7 on WhatsApp / Email
Unlock your academic potential
© 2024  |  Zucol Services PVT LTD  |  All rights reserved.