Comprehensive Financial Analysis of Tesco: Strategic Implications
VerifiedAdded on 2022/08/14
|12
|3098
|15
Report
AI Summary
This report provides a comprehensive financial analysis of Tesco, utilizing ratio analysis to evaluate its performance from 2017 to 2019. It delves into profitability ratios, including operating profit margin, net profit margin, and return on total assets, revealing an increasing trend in operational efficiency and overall profitability. Liquidity ratios, such as current and quick ratios, are examined, indicating a declining trend due to decreasing current assets and increasing liabilities. Efficiency ratios, including inventory turnover, asset turnover, and accounts receivable turnover, demonstrate effective asset management and revenue generation. Leverage ratios, including debt and debt-to-equity ratios, reveal a favorable shift towards reduced leverage and increased reliance on equity financing. The analysis informs strategic decisions, highlighting areas of improvement and suggesting directions for future growth and financial stability. The report emphasizes the company's financial health and strategic direction, offering valuable insights for business and finance students and professionals.
1
ECONOMIC AND FINANCIAL
MANAGEMENT
ECONOMIC AND FINANCIAL
MANAGEMENT
Paraphrase This Document
Need a fresh take? Get an instant paraphrase of this document with our AI Paraphraser
2
Table of Contents
Introduction................................................................................................................................3
Ratio analysis.............................................................................................................................3
Profitability ratios...................................................................................................................3
Liquidity ratios.......................................................................................................................4
Efficiency ratios.....................................................................................................................6
Leverage ratios.......................................................................................................................7
Strategic decisions......................................................................................................................8
Conclusion..................................................................................................................................9
References................................................................................................................................11
3
Introduction
The analysis is required to be performed in relation to the company and in that there will be
consideration of all the financial aspects. In this, the company can use various techniques that
are available and they include ratios analysis and trend analysis. The report will be involving
the evaluation of performance in the context of Tesco. In that, all the increase and decrease
which is taking place will be identified. On the basis of the evaluation, there will be the
determination of the strategic decisions which are taken on that basis. All of that will be
explained by which further expansion and improvement will be made possible.
Ratio analysis
The ratio is the technique that is used by the company to make the evaluation of the
performance which is carried and the position that is maintained. In this, there is the use of
the information which is collected from the financial statement that is made by the company.
There will be an undertaking of the comparison among various values which are derived
(Kim and Im, 2017). There are various types of ratios that are involved and they will be taken
into account in the evaluation of various areas. The main aspects which need to be considered
and shall be involved are identified and explained below in an appropriate manner.
Profitability ratios
The profitability of the company is the main aspect of the business and so it is required that
the same shall be maintained in a proper manner. In this, there are various factors by which it
is affected and so that same shall be taken into account in making the analysis. This is done
with the calculation of the ratios which lie in this category (Delen, Kuzey and Uyar, 2013).
There will be consideration of the several profits which are made and with that all the
elements because of which profits arise are also accounted for. The calculations in this
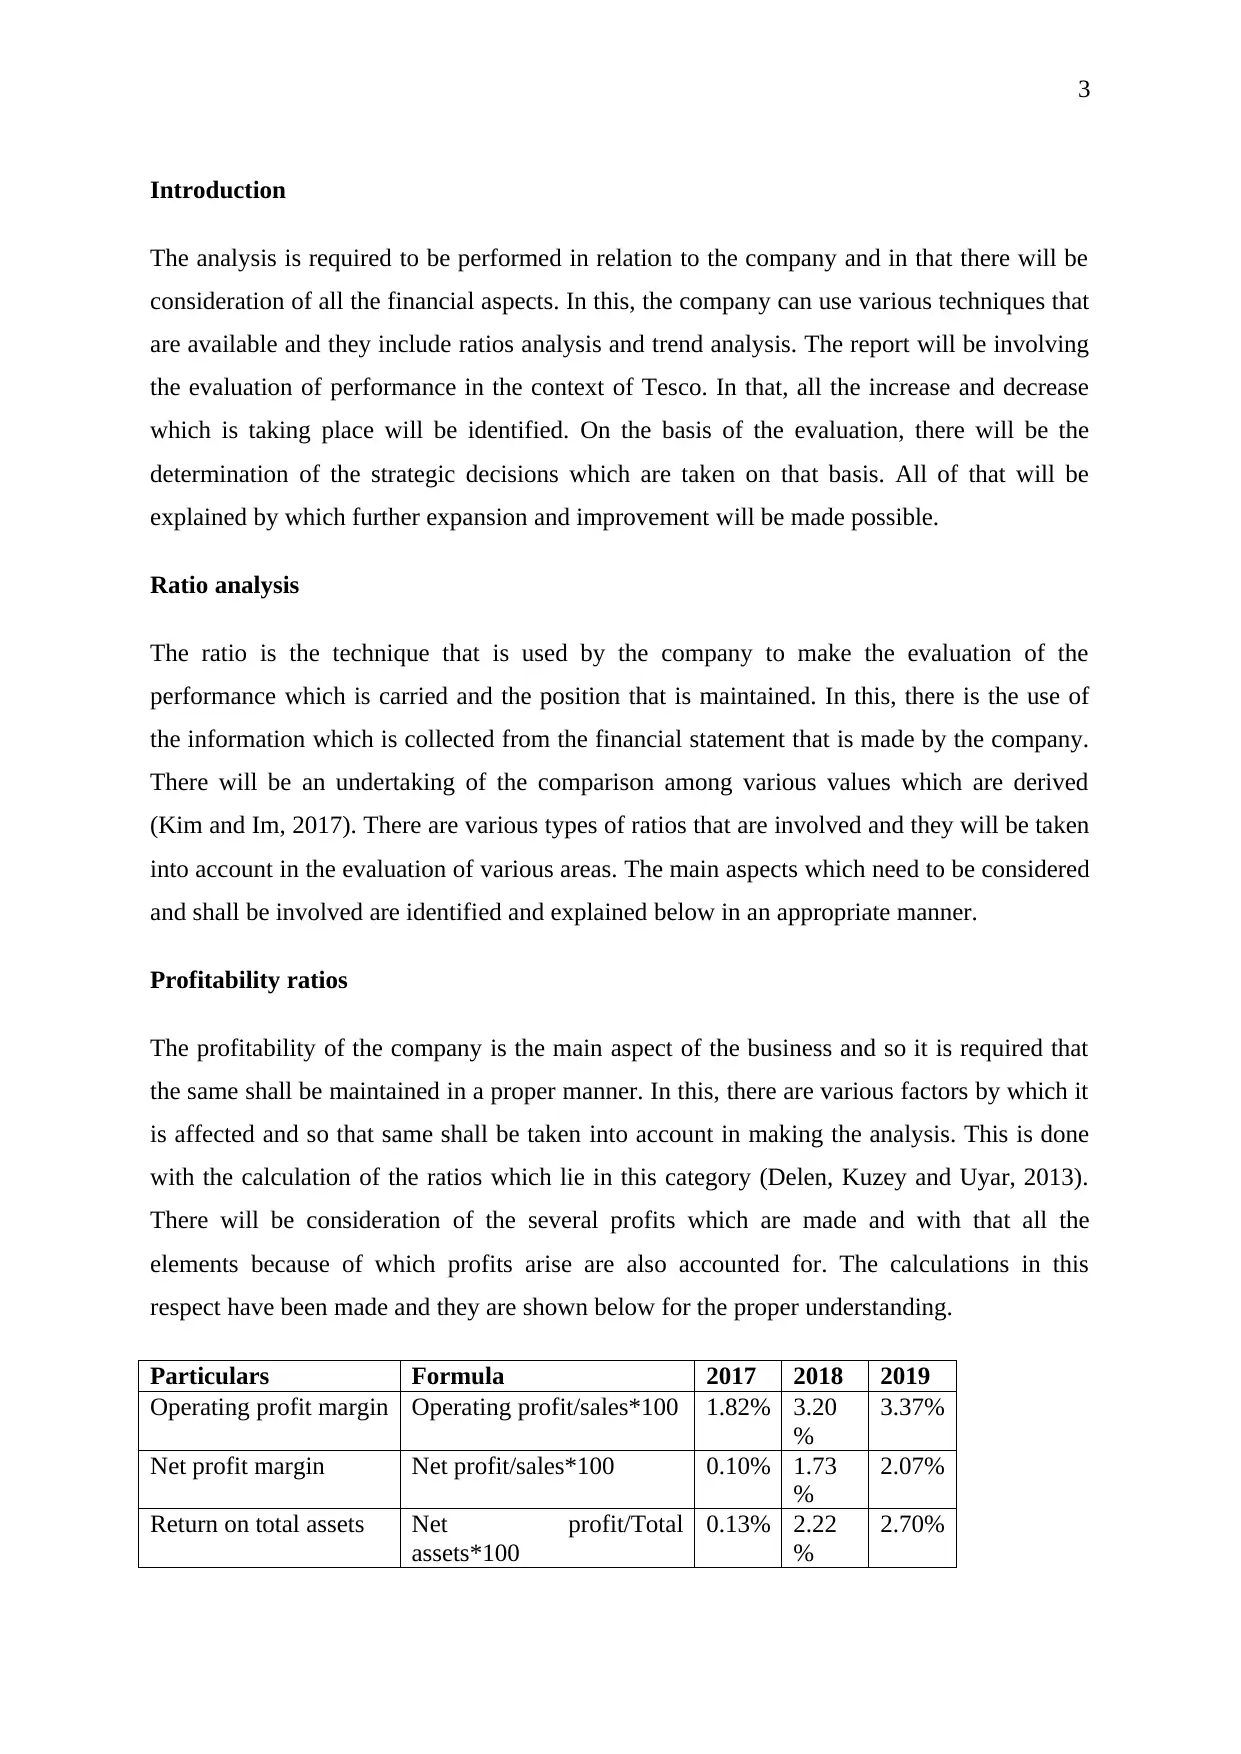
respect have been made and they are shown below for the proper understanding.
Particulars Formula 2017 2018 2019
Operating profit margin Operating profit/sales*100 1.82% 3.20
%
3.37%
Net profit margin Net profit/sales*100 0.10% 1.73
%
2.07%
Return on total assets Net profit/Total
assets*100
0.13% 2.22
%
2.70%
Introduction
The analysis is required to be performed in relation to the company and in that there will be
consideration of all the financial aspects. In this, the company can use various techniques that
are available and they include ratios analysis and trend analysis. The report will be involving
the evaluation of performance in the context of Tesco. In that, all the increase and decrease
which is taking place will be identified. On the basis of the evaluation, there will be the
determination of the strategic decisions which are taken on that basis. All of that will be
explained by which further expansion and improvement will be made possible.
Ratio analysis
The ratio is the technique that is used by the company to make the evaluation of the
performance which is carried and the position that is maintained. In this, there is the use of
the information which is collected from the financial statement that is made by the company.
There will be an undertaking of the comparison among various values which are derived
(Kim and Im, 2017). There are various types of ratios that are involved and they will be taken
into account in the evaluation of various areas. The main aspects which need to be considered
and shall be involved are identified and explained below in an appropriate manner.
Profitability ratios
The profitability of the company is the main aspect of the business and so it is required that
the same shall be maintained in a proper manner. In this, there are various factors by which it
is affected and so that same shall be taken into account in making the analysis. This is done
with the calculation of the ratios which lie in this category (Delen, Kuzey and Uyar, 2013).
There will be consideration of the several profits which are made and with that all the
elements because of which profits arise are also accounted for. The calculations in this
respect have been made and they are shown below for the proper understanding.
Particulars Formula 2017 2018 2019
Operating profit margin Operating profit/sales*100 1.82% 3.20
%
3.37%
Net profit margin Net profit/sales*100 0.10% 1.73
%
2.07%
Return on total assets Net profit/Total
assets*100
0.13% 2.22
%
2.70%
⊘ This is a preview!⊘
Do you want full access?
Subscribe today to unlock all pages.
Trusted by 1+ million students worldwide
4
2017 2018 2019
0.00%
0.50%
1.00%
1.50%
2.00%
2.50%
3.00%
3.50%
4.00%
1.82%
3.20% 3.37%
0.10%
1.73%
2.07%
0.13%
2.22%
2.70%
Profitability ratios
Operating profit
margin
Linear (Operating
profit margin)
Net profit margin
Linear (Net profit
margin)
Return on total assets
Linear (Return on total
assets)
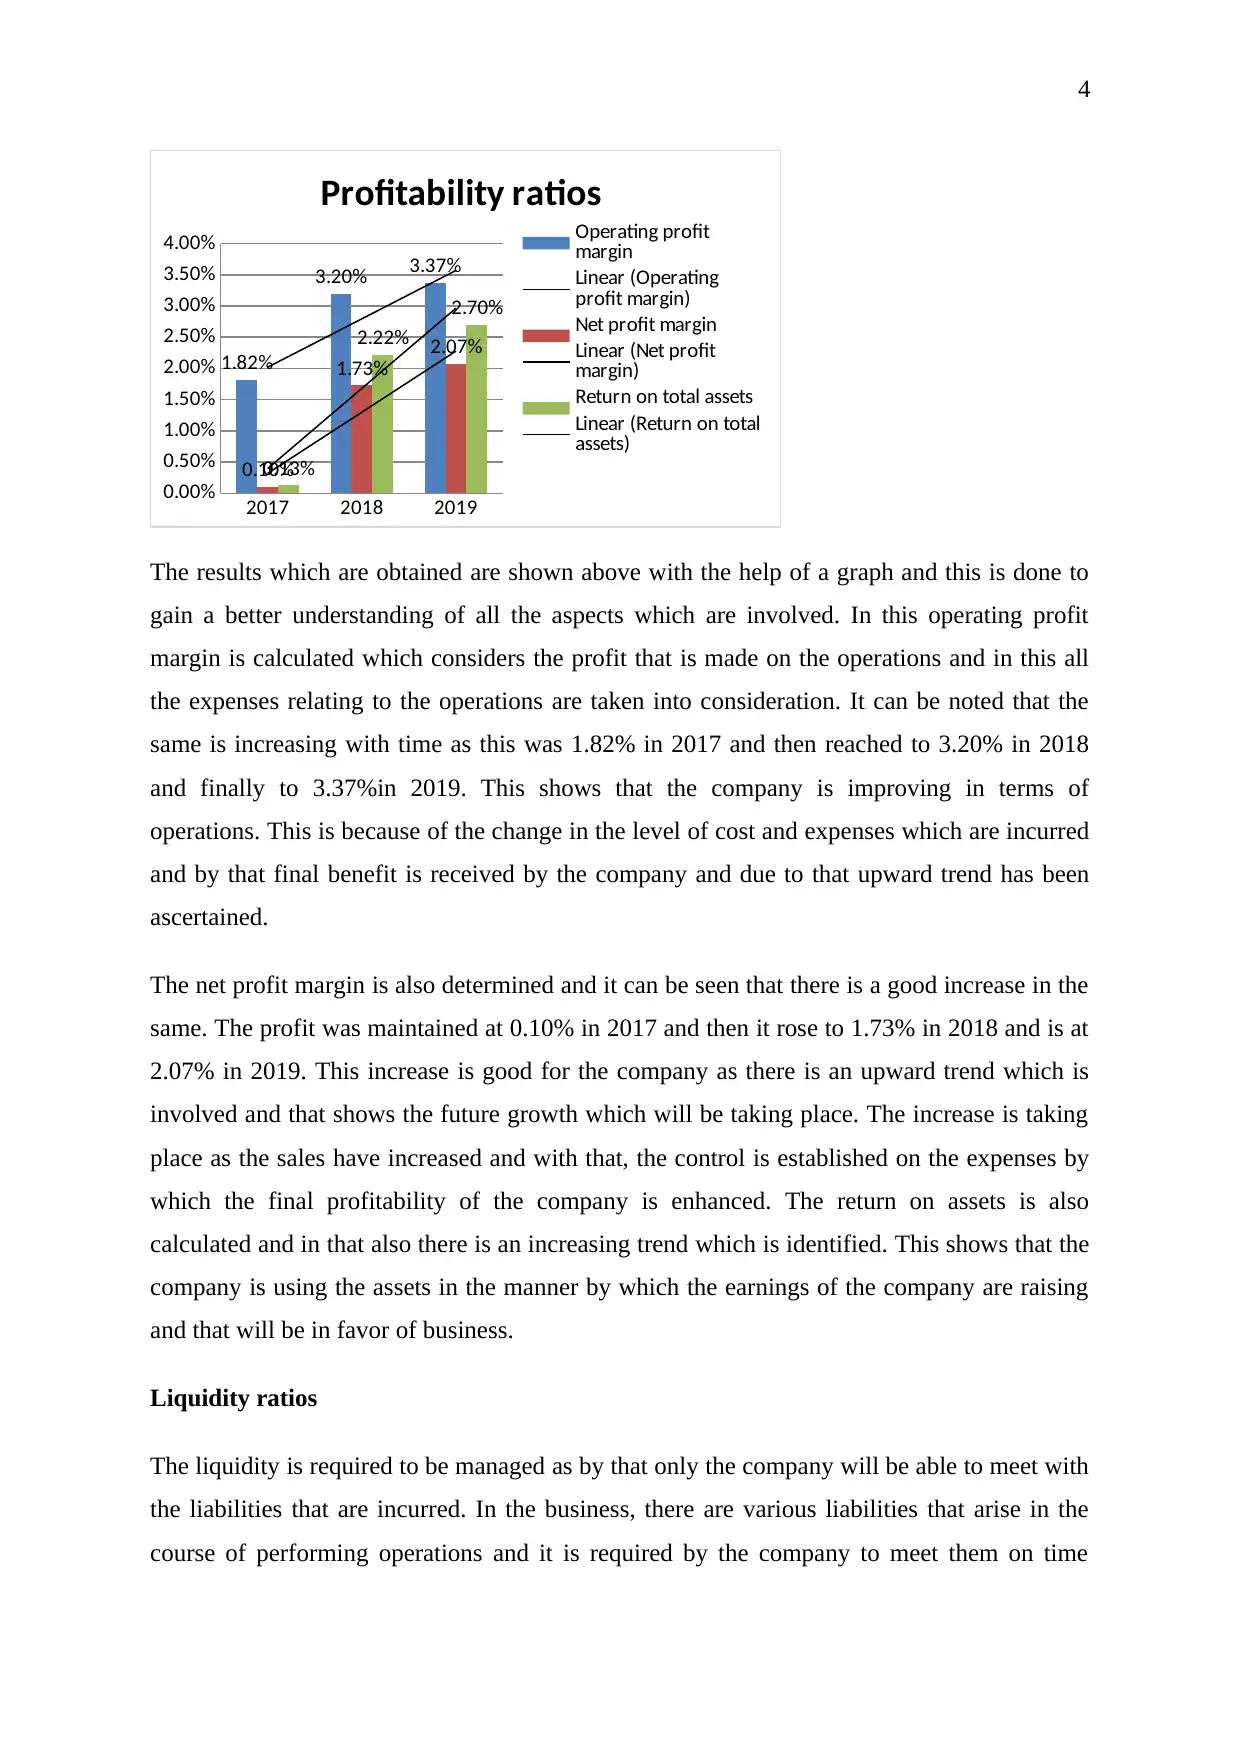
The results which are obtained are shown above with the help of a graph and this is done to
gain a better understanding of all the aspects which are involved. In this operating profit
margin is calculated which considers the profit that is made on the operations and in this all
the expenses relating to the operations are taken into consideration. It can be noted that the
same is increasing with time as this was 1.82% in 2017 and then reached to 3.20% in 2018
and finally to 3.37%in 2019. This shows that the company is improving in terms of
operations. This is because of the change in the level of cost and expenses which are incurred
and by that final benefit is received by the company and due to that upward trend has been
ascertained.
The net profit margin is also determined and it can be seen that there is a good increase in the
same. The profit was maintained at 0.10% in 2017 and then it rose to 1.73% in 2018 and is at
2.07% in 2019. This increase is good for the company as there is an upward trend which is
involved and that shows the future growth which will be taking place. The increase is taking
place as the sales have increased and with that, the control is established on the expenses by
which the final profitability of the company is enhanced. The return on assets is also
calculated and in that also there is an increasing trend which is identified. This shows that the
company is using the assets in the manner by which the earnings of the company are raising
and that will be in favor of business.
Liquidity ratios
The liquidity is required to be managed as by that only the company will be able to meet with
the liabilities that are incurred. In the business, there are various liabilities that arise in the
course of performing operations and it is required by the company to meet them on time
2017 2018 2019
0.00%
0.50%
1.00%
1.50%
2.00%
2.50%
3.00%
3.50%
4.00%
1.82%
3.20% 3.37%
0.10%
1.73%
2.07%
0.13%
2.22%
2.70%
Profitability ratios
Operating profit
margin
Linear (Operating
profit margin)
Net profit margin
Linear (Net profit
margin)
Return on total assets
Linear (Return on total
assets)
The results which are obtained are shown above with the help of a graph and this is done to
gain a better understanding of all the aspects which are involved. In this operating profit
margin is calculated which considers the profit that is made on the operations and in this all
the expenses relating to the operations are taken into consideration. It can be noted that the
same is increasing with time as this was 1.82% in 2017 and then reached to 3.20% in 2018
and finally to 3.37%in 2019. This shows that the company is improving in terms of
operations. This is because of the change in the level of cost and expenses which are incurred
and by that final benefit is received by the company and due to that upward trend has been
ascertained.
The net profit margin is also determined and it can be seen that there is a good increase in the
same. The profit was maintained at 0.10% in 2017 and then it rose to 1.73% in 2018 and is at
2.07% in 2019. This increase is good for the company as there is an upward trend which is
involved and that shows the future growth which will be taking place. The increase is taking
place as the sales have increased and with that, the control is established on the expenses by
which the final profitability of the company is enhanced. The return on assets is also
calculated and in that also there is an increasing trend which is identified. This shows that the
company is using the assets in the manner by which the earnings of the company are raising
and that will be in favor of business.
Liquidity ratios
The liquidity is required to be managed as by that only the company will be able to meet with
the liabilities that are incurred. In the business, there are various liabilities that arise in the
course of performing operations and it is required by the company to meet them on time
Paraphrase This Document
Need a fresh take? Get an instant paraphrase of this document with our AI Paraphraser
5
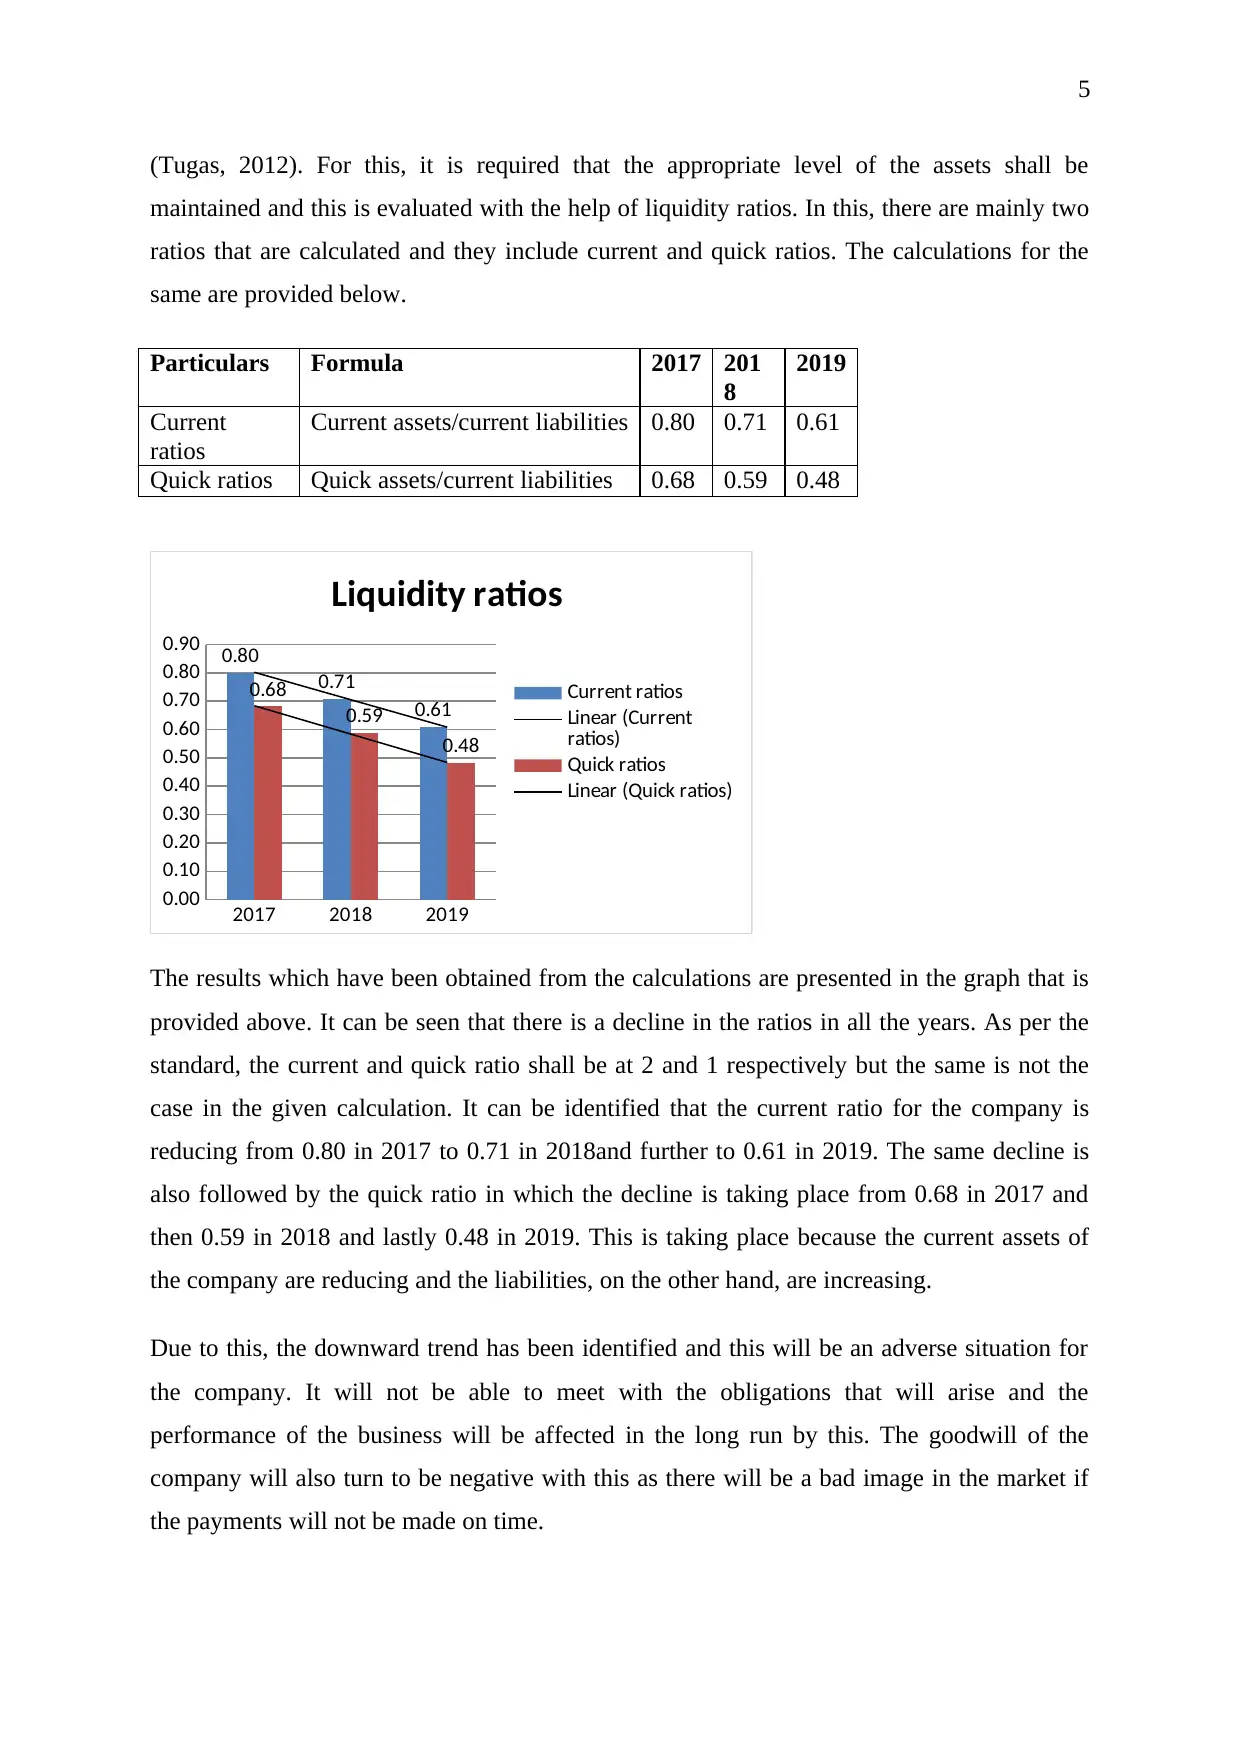
(Tugas, 2012). For this, it is required that the appropriate level of the assets shall be
maintained and this is evaluated with the help of liquidity ratios. In this, there are mainly two
ratios that are calculated and they include current and quick ratios. The calculations for the
same are provided below.
Particulars Formula 2017 201
8
2019
Current
ratios
Current assets/current liabilities 0.80 0.71 0.61
Quick ratios Quick assets/current liabilities 0.68 0.59 0.48
2017 2018 2019
0.00
0.10
0.20
0.30
0.40
0.50
0.60
0.70
0.80
0.90 0.80
0.71
0.61
0.68
0.59
0.48
Liquidity ratios
Current ratios
Linear (Current
ratios)
Quick ratios
Linear (Quick ratios)
The results which have been obtained from the calculations are presented in the graph that is
provided above. It can be seen that there is a decline in the ratios in all the years. As per the
standard, the current and quick ratio shall be at 2 and 1 respectively but the same is not the
case in the given calculation. It can be identified that the current ratio for the company is
reducing from 0.80 in 2017 to 0.71 in 2018and further to 0.61 in 2019. The same decline is
also followed by the quick ratio in which the decline is taking place from 0.68 in 2017 and
then 0.59 in 2018 and lastly 0.48 in 2019. This is taking place because the current assets of
the company are reducing and the liabilities, on the other hand, are increasing.
Due to this, the downward trend has been identified and this will be an adverse situation for
the company. It will not be able to meet with the obligations that will arise and the
performance of the business will be affected in the long run by this. The goodwill of the
company will also turn to be negative with this as there will be a bad image in the market if
the payments will not be made on time.
6
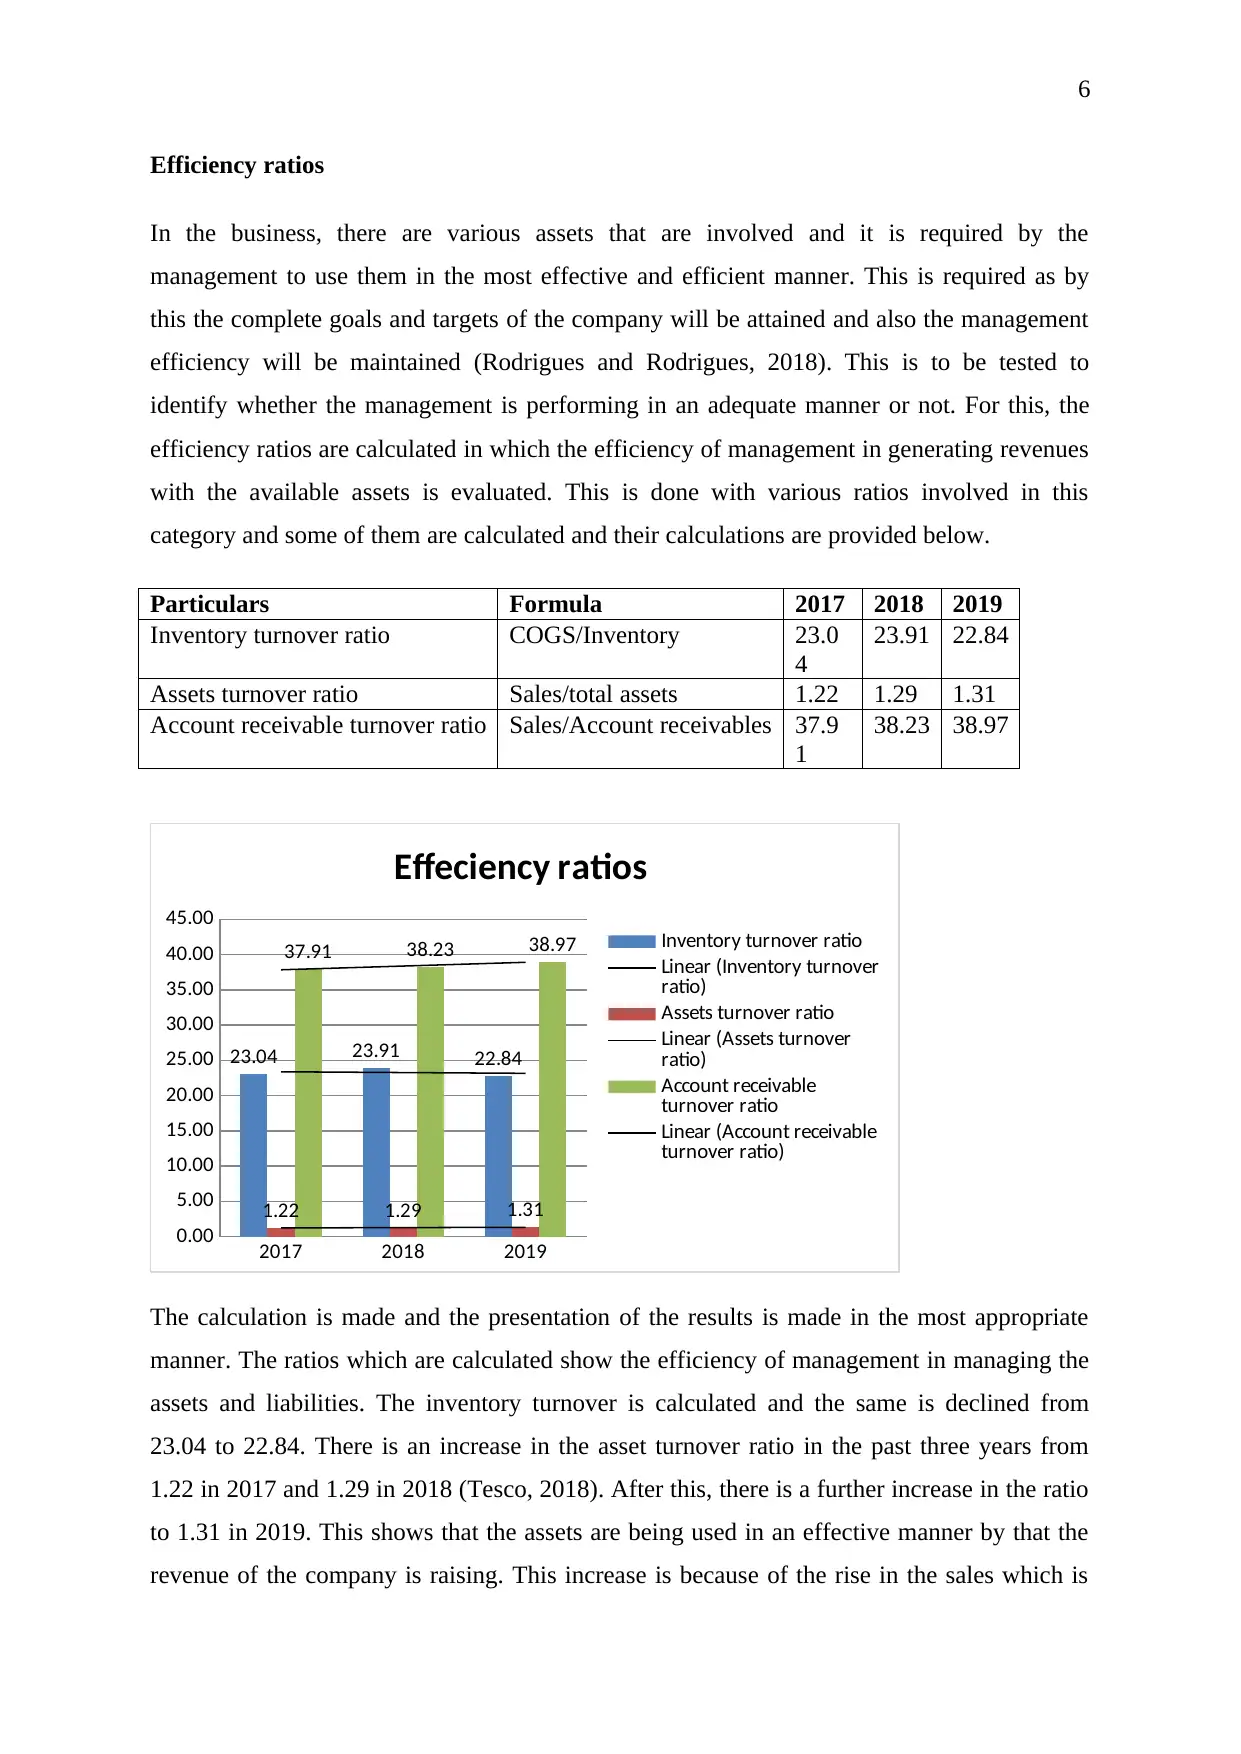
Efficiency ratios
In the business, there are various assets that are involved and it is required by the
management to use them in the most effective and efficient manner. This is required as by
this the complete goals and targets of the company will be attained and also the management
efficiency will be maintained (Rodrigues and Rodrigues, 2018). This is to be tested to
identify whether the management is performing in an adequate manner or not. For this, the
efficiency ratios are calculated in which the efficiency of management in generating revenues
with the available assets is evaluated. This is done with various ratios involved in this
category and some of them are calculated and their calculations are provided below.
Particulars Formula 2017 2018 2019
Inventory turnover ratio COGS/Inventory 23.0
4
23.91 22.84
Assets turnover ratio Sales/total assets 1.22 1.29 1.31
Account receivable turnover ratio Sales/Account receivables 37.9
1
38.23 38.97
2017 2018 2019
0.00
5.00
10.00
15.00
20.00
25.00
30.00
35.00
40.00
45.00
23.04 23.91 22.84
1.22 1.29 1.31
37.91 38.23 38.97
Effeciency ratios
Inventory turnover ratio
Linear (Inventory turnover
ratio)
Assets turnover ratio
Linear (Assets turnover
ratio)
Account receivable
turnover ratio
Linear (Account receivable
turnover ratio)
The calculation is made and the presentation of the results is made in the most appropriate
manner. The ratios which are calculated show the efficiency of management in managing the
assets and liabilities. The inventory turnover is calculated and the same is declined from
23.04 to 22.84. There is an increase in the asset turnover ratio in the past three years from
1.22 in 2017 and 1.29 in 2018 (Tesco, 2018). After this, there is a further increase in the ratio
to 1.31 in 2019. This shows that the assets are being used in an effective manner by that the
revenue of the company is raising. This increase is because of the rise in the sales which is
⊘ This is a preview!⊘
Do you want full access?
Subscribe today to unlock all pages.
Trusted by 1+ million students worldwide
7
made and also the assets have faced a rise. Due to this, the ratio is increasing and that is good
for the company.
They will be beneficial as this proves that management is using all the assets in the best
possible manner. The assets will further help in increasing the sales and that additional
benefits will be attained. The account receivable turnover ratio is also calculated and by that
also the efficiency of the management in making a collection is evaluated. There is an
increase in this ratio and that shows that there is an increase in the sales and account
receivable is not increasing in the same manner. There is proper efficiency which is
maintained by the management and this has been noted in the same.
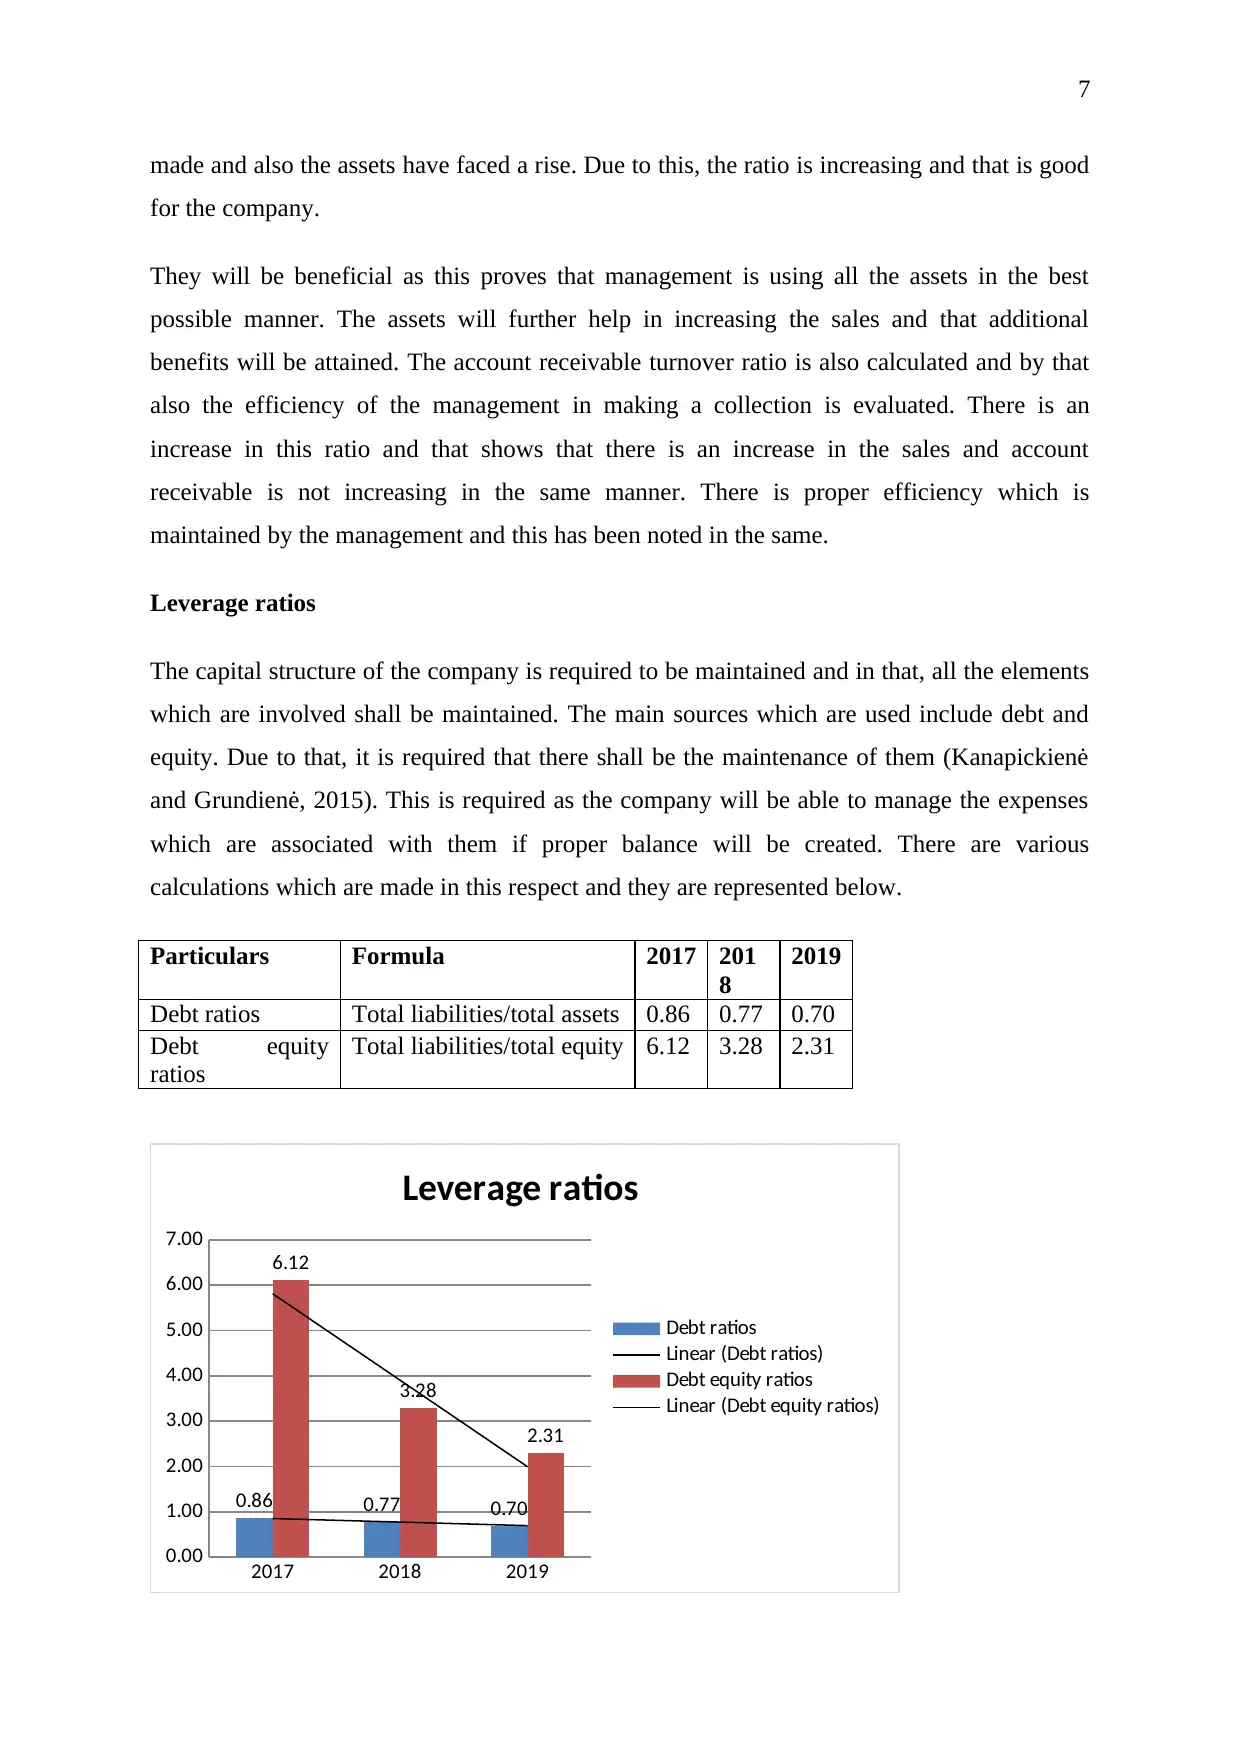
Leverage ratios
The capital structure of the company is required to be maintained and in that, all the elements
which are involved shall be maintained. The main sources which are used include debt and
equity. Due to that, it is required that there shall be the maintenance of them (Kanapickienė
and Grundienė, 2015). This is required as the company will be able to manage the expenses
which are associated with them if proper balance will be created. There are various
calculations which are made in this respect and they are represented below.
Particulars Formula 2017 201
8
2019
Debt ratios Total liabilities/total assets 0.86 0.77 0.70
Debt equity
ratios
Total liabilities/total equity 6.12 3.28 2.31
2017 2018 2019
0.00
1.00
2.00
3.00
4.00
5.00
6.00
7.00
0.86 0.77 0.70
6.12
3.28
2.31
Leverage ratios
Debt ratios
Linear (Debt ratios)
Debt equity ratios
Linear (Debt equity ratios)
made and also the assets have faced a rise. Due to this, the ratio is increasing and that is good
for the company.
They will be beneficial as this proves that management is using all the assets in the best
possible manner. The assets will further help in increasing the sales and that additional
benefits will be attained. The account receivable turnover ratio is also calculated and by that
also the efficiency of the management in making a collection is evaluated. There is an
increase in this ratio and that shows that there is an increase in the sales and account
receivable is not increasing in the same manner. There is proper efficiency which is
maintained by the management and this has been noted in the same.
Leverage ratios
The capital structure of the company is required to be maintained and in that, all the elements
which are involved shall be maintained. The main sources which are used include debt and
equity. Due to that, it is required that there shall be the maintenance of them (Kanapickienė
and Grundienė, 2015). This is required as the company will be able to manage the expenses
which are associated with them if proper balance will be created. There are various
calculations which are made in this respect and they are represented below.
Particulars Formula 2017 201
8
2019
Debt ratios Total liabilities/total assets 0.86 0.77 0.70
Debt equity
ratios
Total liabilities/total equity 6.12 3.28 2.31
2017 2018 2019
0.00
1.00
2.00
3.00
4.00
5.00
6.00
7.00
0.86 0.77 0.70
6.12
3.28
2.31
Leverage ratios
Debt ratios
Linear (Debt ratios)
Debt equity ratios
Linear (Debt equity ratios)
Paraphrase This Document
Need a fresh take? Get an instant paraphrase of this document with our AI Paraphraser
8
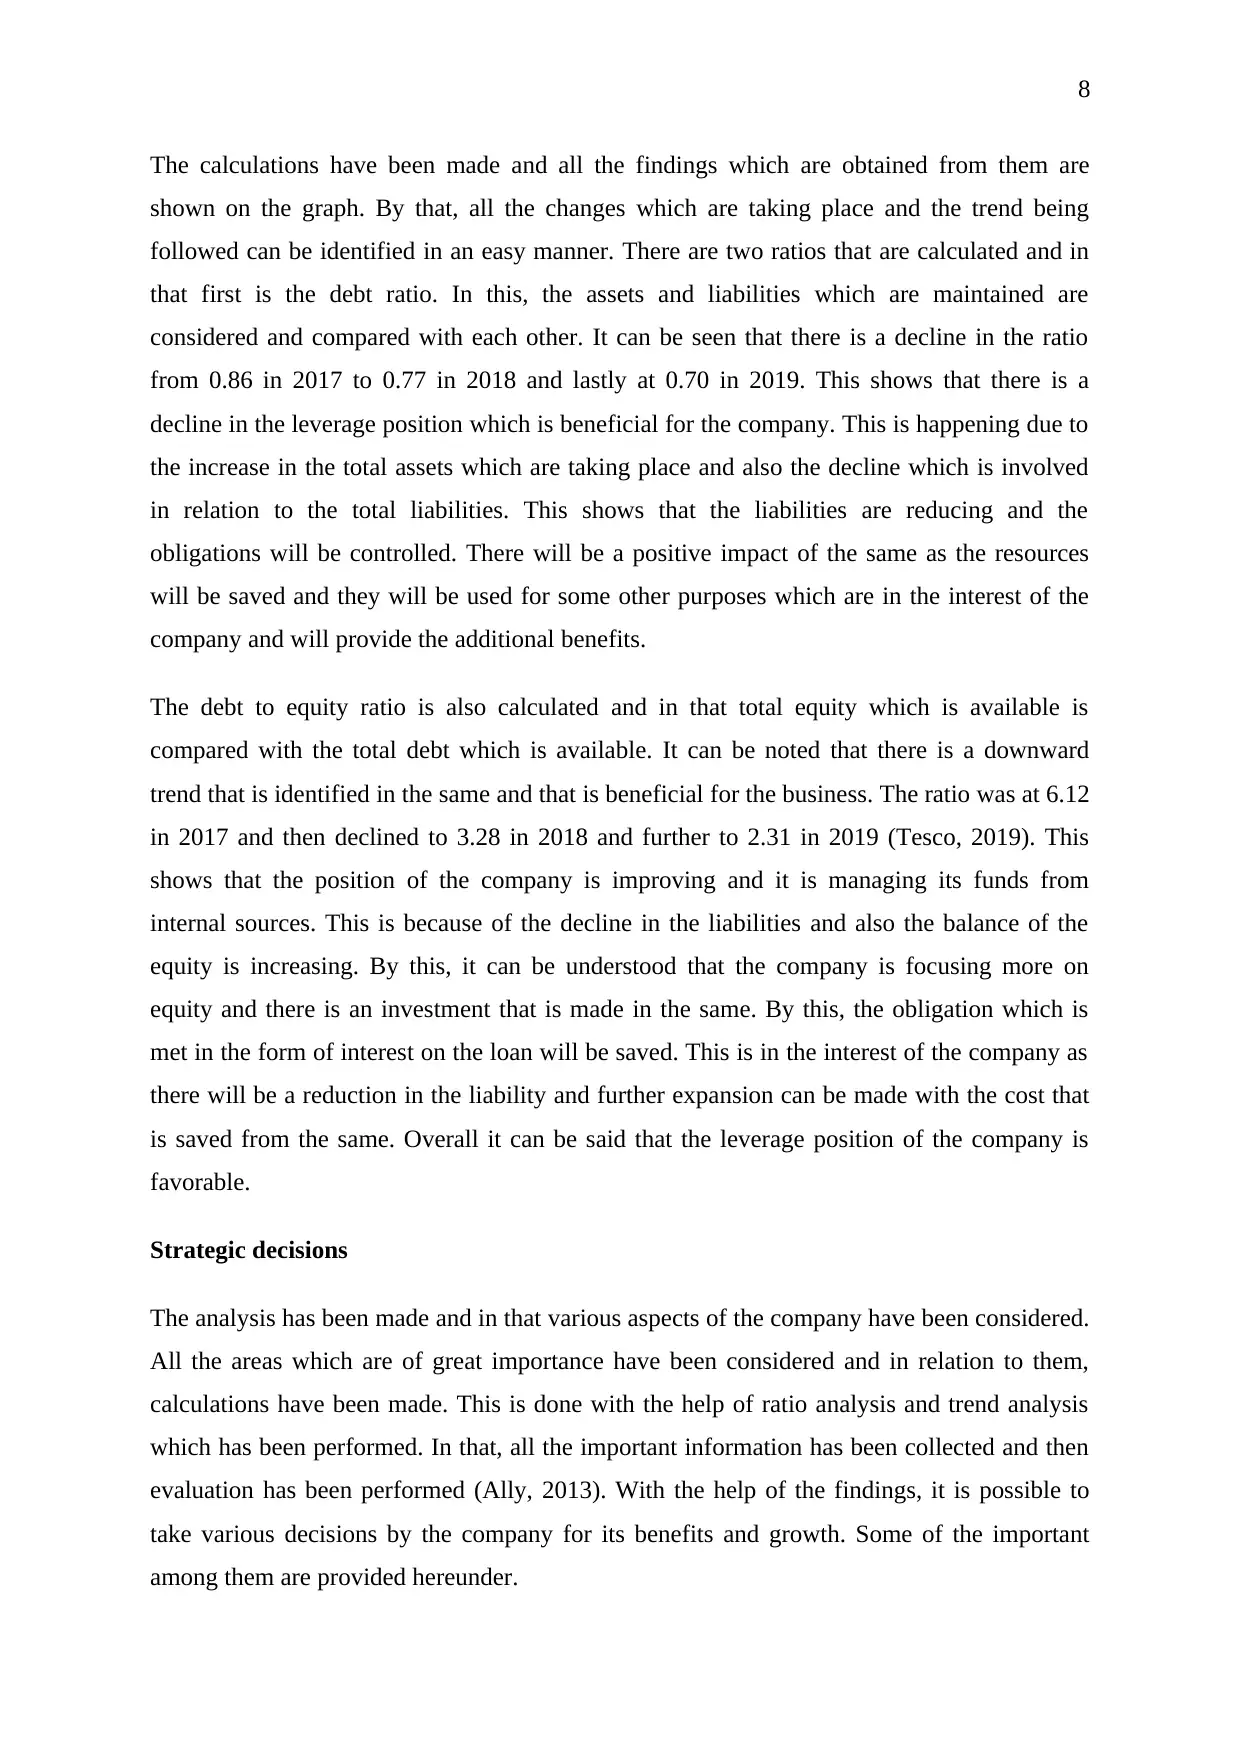
The calculations have been made and all the findings which are obtained from them are
shown on the graph. By that, all the changes which are taking place and the trend being
followed can be identified in an easy manner. There are two ratios that are calculated and in
that first is the debt ratio. In this, the assets and liabilities which are maintained are
considered and compared with each other. It can be seen that there is a decline in the ratio
from 0.86 in 2017 to 0.77 in 2018 and lastly at 0.70 in 2019. This shows that there is a
decline in the leverage position which is beneficial for the company. This is happening due to
the increase in the total assets which are taking place and also the decline which is involved
in relation to the total liabilities. This shows that the liabilities are reducing and the
obligations will be controlled. There will be a positive impact of the same as the resources
will be saved and they will be used for some other purposes which are in the interest of the
company and will provide the additional benefits.
The debt to equity ratio is also calculated and in that total equity which is available is
compared with the total debt which is available. It can be noted that there is a downward
trend that is identified in the same and that is beneficial for the business. The ratio was at 6.12
in 2017 and then declined to 3.28 in 2018 and further to 2.31 in 2019 (Tesco, 2019). This
shows that the position of the company is improving and it is managing its funds from
internal sources. This is because of the decline in the liabilities and also the balance of the
equity is increasing. By this, it can be understood that the company is focusing more on
equity and there is an investment that is made in the same. By this, the obligation which is
met in the form of interest on the loan will be saved. This is in the interest of the company as
there will be a reduction in the liability and further expansion can be made with the cost that
is saved from the same. Overall it can be said that the leverage position of the company is
favorable.
Strategic decisions
The analysis has been made and in that various aspects of the company have been considered.
All the areas which are of great importance have been considered and in relation to them,
calculations have been made. This is done with the help of ratio analysis and trend analysis
which has been performed. In that, all the important information has been collected and then
evaluation has been performed (Ally, 2013). With the help of the findings, it is possible to
take various decisions by the company for its benefits and growth. Some of the important
among them are provided hereunder.
9
It has been noted that there is a decline in the liquidity position of the company and there is
the need to make the improvement in the same. This will be made possible with the help of
investment that will be made in the current assets of the company. The assets will be
increased and by that, it will be possible to make the payments on time (Elbanna, Child and
Dayan, 2013). This will enhance the ability to make the payments and there will be no
balances that will remain overdue. The proper system will be established and by that, the
current liabilities of the business will have to be controlled. The overall liquidity position of
the company will be improving with the help of this and that will provide the long term
advantages to the company.
The profitability of the company is improving and it shall be ensured that the same is
maintained in the coming period. For this, there will be the development of proper policies
and procedures that will have to be followed (Saer and Deman, 2012). According to them, the
profits will have to be allocated in the best manner and there will be proper savings which
will be made from them. The investments which are beneficial will be made with the help of
available funds. This will be enhancing the income of the company further and also the
growth will be made possible. Such investments will be made by which the development will
be made and competition which is available in the market will be dealt with in the best
possible manner.
The customers are required to be satisfied as they are the main aspects and will be required
for the success of the business. This will be ensured by issuing the standards by which the
requirements of the customers will be met on time (Bailey and Peck, 2013). There will be
proper policies and according to them, the company will be required to deliver the products
as per the customer requirements. The proper monitoring system will be made according to
which the quality of the products will be tested and it will be ensured that the best quality
products are met. This will enhance customer satisfaction and long term sustainability of the
business will be ensured.
Conclusion
The report has been made on Tesco and in that financial analysis has been performed. There
is the calculation of the ratios in respect of leverage, liquidity, profitability, and efficiency. It
is identified that evaluation shall be made as the financial performance is identified with that.
All the trends which are involved in the company and in the ratios have been identified. With
⊘ This is a preview!⊘
Do you want full access?
Subscribe today to unlock all pages.
Trusted by 1+ million students worldwide
10
that, the overall evaluation is made and performance is identified. The results which have
been identified have been sued for the making of strategic decision and they have also been
reflected in the report for further use.
that, the overall evaluation is made and performance is identified. The results which have
been identified have been sued for the making of strategic decision and they have also been
reflected in the report for further use.
Paraphrase This Document
Need a fresh take? Get an instant paraphrase of this document with our AI Paraphraser
11
References
Ally, Z. (2013) Comparative analysis of the financial performance of commercial banks in
Tanzania. Research Journal of Finance and Accounting, 4(19), pp.133-143.
Bailey, B.C. and Peck, S.I. (2013) Boardroom strategic decision‐making style: Understanding
the antecedents. Corporate Governance: An International Review, 21(2), pp.131-146.
Delen, D., Kuzey, C. and Uyar, A. (2013) Measuring firm performance using financial ratios:
A decision tree approach. Expert Systems with Applications, 40(10), pp.3970-3983.
Elbanna, S., Child, J. and Dayan, M. (2013) A model of antecedents and consequences of
intuition in strategic decision-making: Evidence from Egypt. Long Range Planning, 46(1-2),
pp.149-176.
Kanapickienė, R. and Grundienė, Ž. (2015) The model of fraud detection in financial
statements by means of financial ratios. Procedia: social and behavioral sciences, pp.321-
327.
Kim, J. and Im, C. (2017) Study on corporate social responsibility (CSR): Focus on tax
avoidance and financial ratio analysis. Sustainability, 9(10), p.1710.
Rodrigues, L. and Rodrigues, L. (2018) Economic-financial performance of the Brazilian
sugarcane energy industry: An empirical evaluation using financial ratio, cluster and
discriminant analysis. Biomass and bioenergy, 108, pp.289-296.
Saer, I.M. and Deman, N. (2012) Financial ratios as an evaluation instrument of business
quality in small and medium-sized enterprises. International Journal of Management
Cases, 14(4), pp.373-385.
Tesco. (2018) Annual report. [Online] Available at:
https://www.tescoplc.com/media/474793/tesco_ar_2018.pdf [Accessed 14 February 2020]
Tesco. (2019) Annual report. [Online] Available at:
https://www.tescoplc.com/media/476422/tesco_ara2019_full_report_web.pdf [Accessed 14
February 2020]
12
Tugas, F.C. (2012) A Comparative Analysis of the Financial Ratios of Listed Firms
Belonging to the Education Subsector in the Philippines for the Years 2009-
2011. International Journal of Business and Social Science, 3(21).
Tugas, F.C. (2012) A Comparative Analysis of the Financial Ratios of Listed Firms
Belonging to the Education Subsector in the Philippines for the Years 2009-
2011. International Journal of Business and Social Science, 3(21).
⊘ This is a preview!⊘
Do you want full access?
Subscribe today to unlock all pages.
Trusted by 1+ million students worldwide
1 out of 12
Related Documents


Your All-in-One AI-Powered Toolkit for Academic Success.
+13062052269
info@desklib.com
Available 24*7 on WhatsApp / Email
![[object Object]](/_next/static/media/star-bottom.7253800d.svg)
Unlock your academic potential
Copyright © 2020–2026 A2Z Services. All Rights Reserved. Developed and managed by ZUCOL.