Financial Performance, Position and Reporting of Tesco: Analysis
VerifiedAdded on 2020/07/23
|10
|1828
|37
Report
AI Summary
This report provides a comprehensive analysis of Tesco's financial performance, focusing on key financial ratios such as net profit ratio, current ratio, total assets turnover ratio, debt-equity ratio, and earnings per share. The analysis compares Tesco's performance with competitors like Sainsbury and John Lewis, highlighting areas of strength and weakness. The report also examines the market perception of the company, including share price trends and dividend history, to assess investor confidence and overall financial health. The conclusion summarizes the importance of ratio analysis in evaluating a company's performance and making informed business decisions. This report is a valuable resource for understanding Tesco's financial standing and the factors influencing its performance in the UK retail market.
FINANCIAL PERFORMANCE,
POSITION AND REPORTING
POSITION AND REPORTING
Paraphrase This Document
Need a fresh take? Get an instant paraphrase of this document with our AI Paraphraser
TABLE OF CONTENTS
INTRODUCTION...........................................................................................................................1
Ratio analysis...................................................................................................................................1
Market perception of company........................................................................................................6
CONCLUSION................................................................................................................................6
REFERENCES................................................................................................................................8
Figure 1Net profit ratio....................................................................................................................1
Figure 2Current ratio.......................................................................................................................2
Figure 3Total assets turnover ratio..................................................................................................3
Figure 4Debt equity ratio.................................................................................................................4
Figure 5Earning per share................................................................................................................4
INTRODUCTION
Tesco is one of the leading player in the UK retail industry. Fierce competiton and lack of
proper management are two of the factors due to which firm failed to perform well in its
businesss. In the current report ratio analysis is done and comments are made on firm
performance. In order to measure company performance in better manner its comparison is made
with peer firms and by doing areas where is in better condition then rivals is identified. At end of
the report, share price analysis is done and comments are made on it. Apart from this, trend in
which dividend paid is also analyzed. At end of the report, conclusion section is prepared.
Ratio analysis
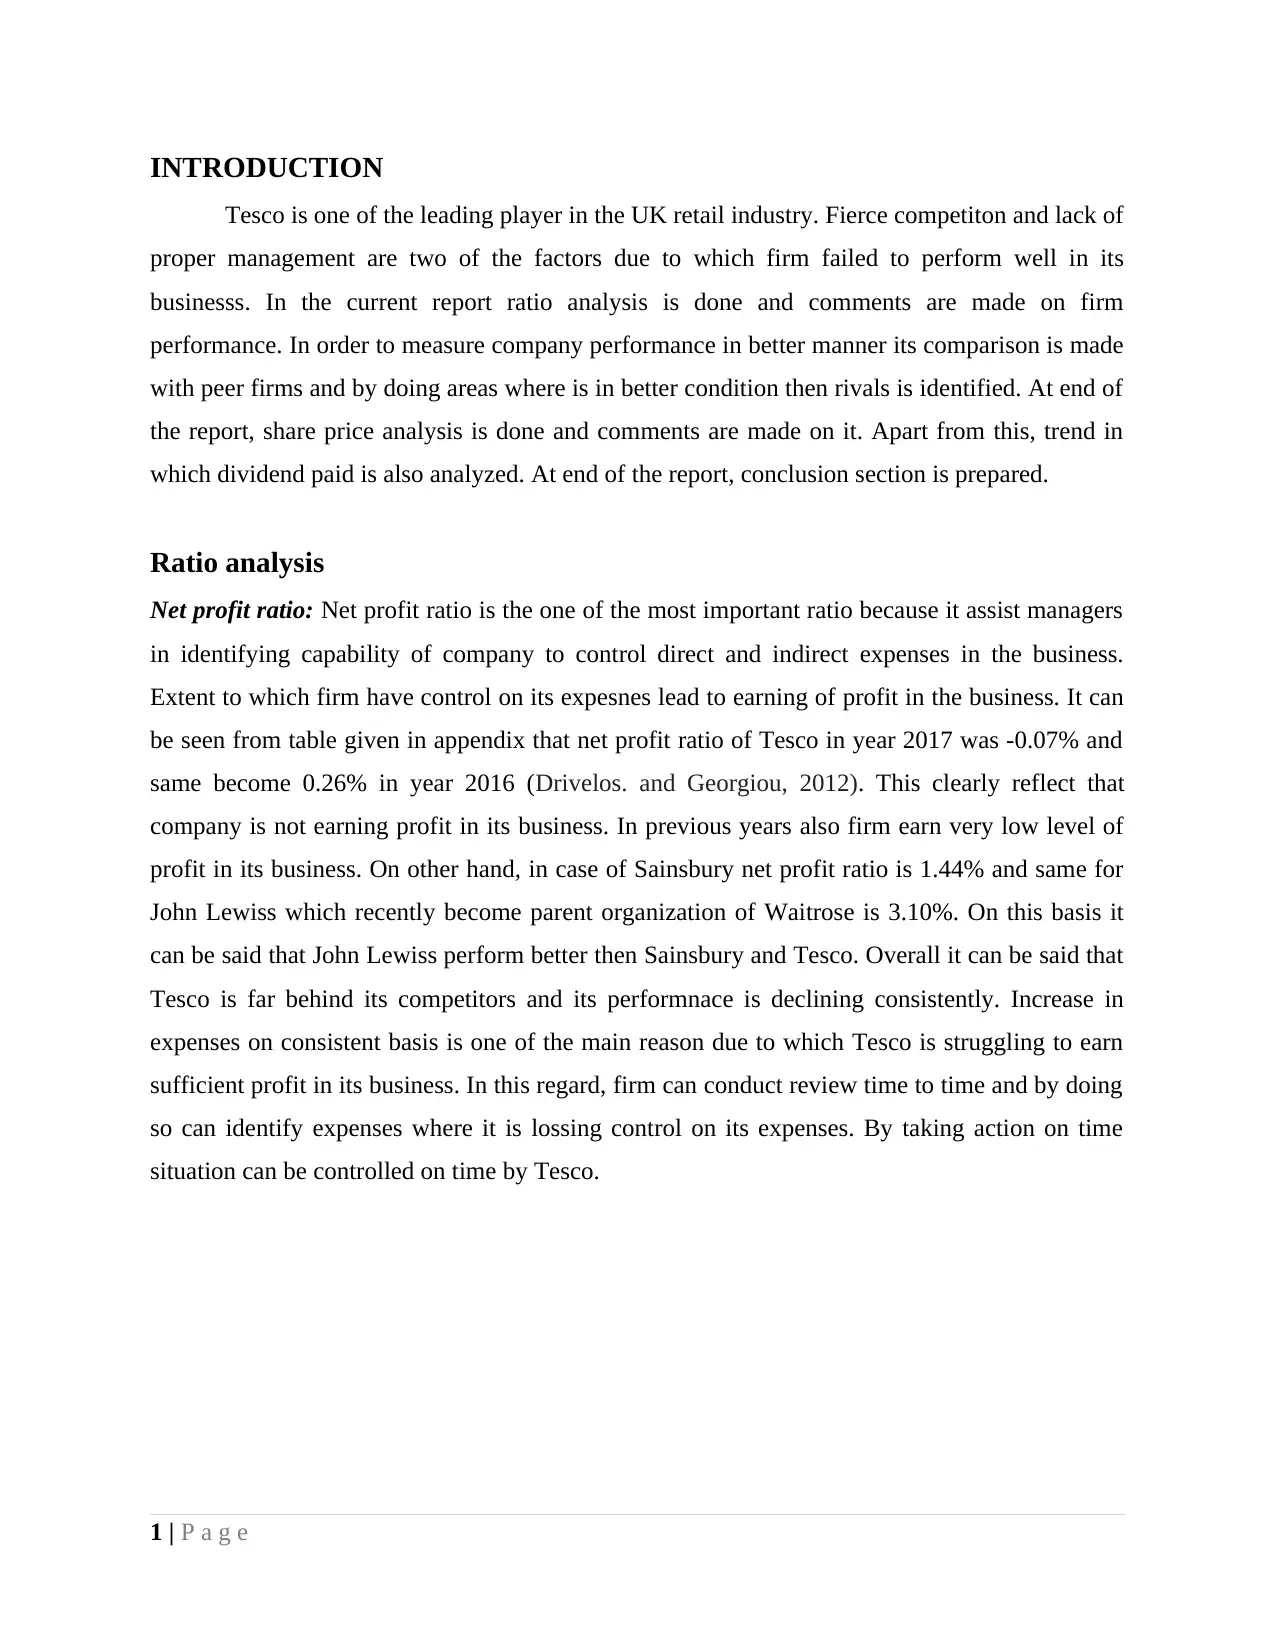
Net profit ratio: Net profit ratio is the one of the most important ratio because it assist managers
in identifying capability of company to control direct and indirect expenses in the business.
Extent to which firm have control on its expesnes lead to earning of profit in the business. It can
be seen from table given in appendix that net profit ratio of Tesco in year 2017 was -0.07% and
same become 0.26% in year 2016 (Drivelos. and Georgiou, 2012). This clearly reflect that
company is not earning profit in its business. In previous years also firm earn very low level of
profit in its business. On other hand, in case of Sainsbury net profit ratio is 1.44% and same for
John Lewiss which recently become parent organization of Waitrose is 3.10%. On this basis it
can be said that John Lewiss perform better then Sainsbury and Tesco. Overall it can be said that
Tesco is far behind its competitors and its performnace is declining consistently. Increase in
expenses on consistent basis is one of the main reason due to which Tesco is struggling to earn
sufficient profit in its business. In this regard, firm can conduct review time to time and by doing
so can identify expenses where it is lossing control on its expenses. By taking action on time
situation can be controlled on time by Tesco.
1 | P a g e
Tesco is one of the leading player in the UK retail industry. Fierce competiton and lack of
proper management are two of the factors due to which firm failed to perform well in its
businesss. In the current report ratio analysis is done and comments are made on firm
performance. In order to measure company performance in better manner its comparison is made
with peer firms and by doing areas where is in better condition then rivals is identified. At end of
the report, share price analysis is done and comments are made on it. Apart from this, trend in
which dividend paid is also analyzed. At end of the report, conclusion section is prepared.
Ratio analysis
Net profit ratio: Net profit ratio is the one of the most important ratio because it assist managers
in identifying capability of company to control direct and indirect expenses in the business.
Extent to which firm have control on its expesnes lead to earning of profit in the business. It can
be seen from table given in appendix that net profit ratio of Tesco in year 2017 was -0.07% and
same become 0.26% in year 2016 (Drivelos. and Georgiou, 2012). This clearly reflect that
company is not earning profit in its business. In previous years also firm earn very low level of
profit in its business. On other hand, in case of Sainsbury net profit ratio is 1.44% and same for
John Lewiss which recently become parent organization of Waitrose is 3.10%. On this basis it
can be said that John Lewiss perform better then Sainsbury and Tesco. Overall it can be said that
Tesco is far behind its competitors and its performnace is declining consistently. Increase in
expenses on consistent basis is one of the main reason due to which Tesco is struggling to earn
sufficient profit in its business. In this regard, firm can conduct review time to time and by doing
so can identify expenses where it is lossing control on its expenses. By taking action on time
situation can be controlled on time by Tesco.
1 | P a g e
⊘ This is a preview!⊘
Do you want full access?
Subscribe today to unlock all pages.
Trusted by 1+ million students worldwide
Tesco Sainsbury John Lewiss Partnership
-0.50%
0.00%
0.50%
1.00%
1.50%
2.00%
2.50%
3.00%
3.50%
-0.07%
1.44%
3.10%
Net profit ratio
Figure 1Net profit ratio
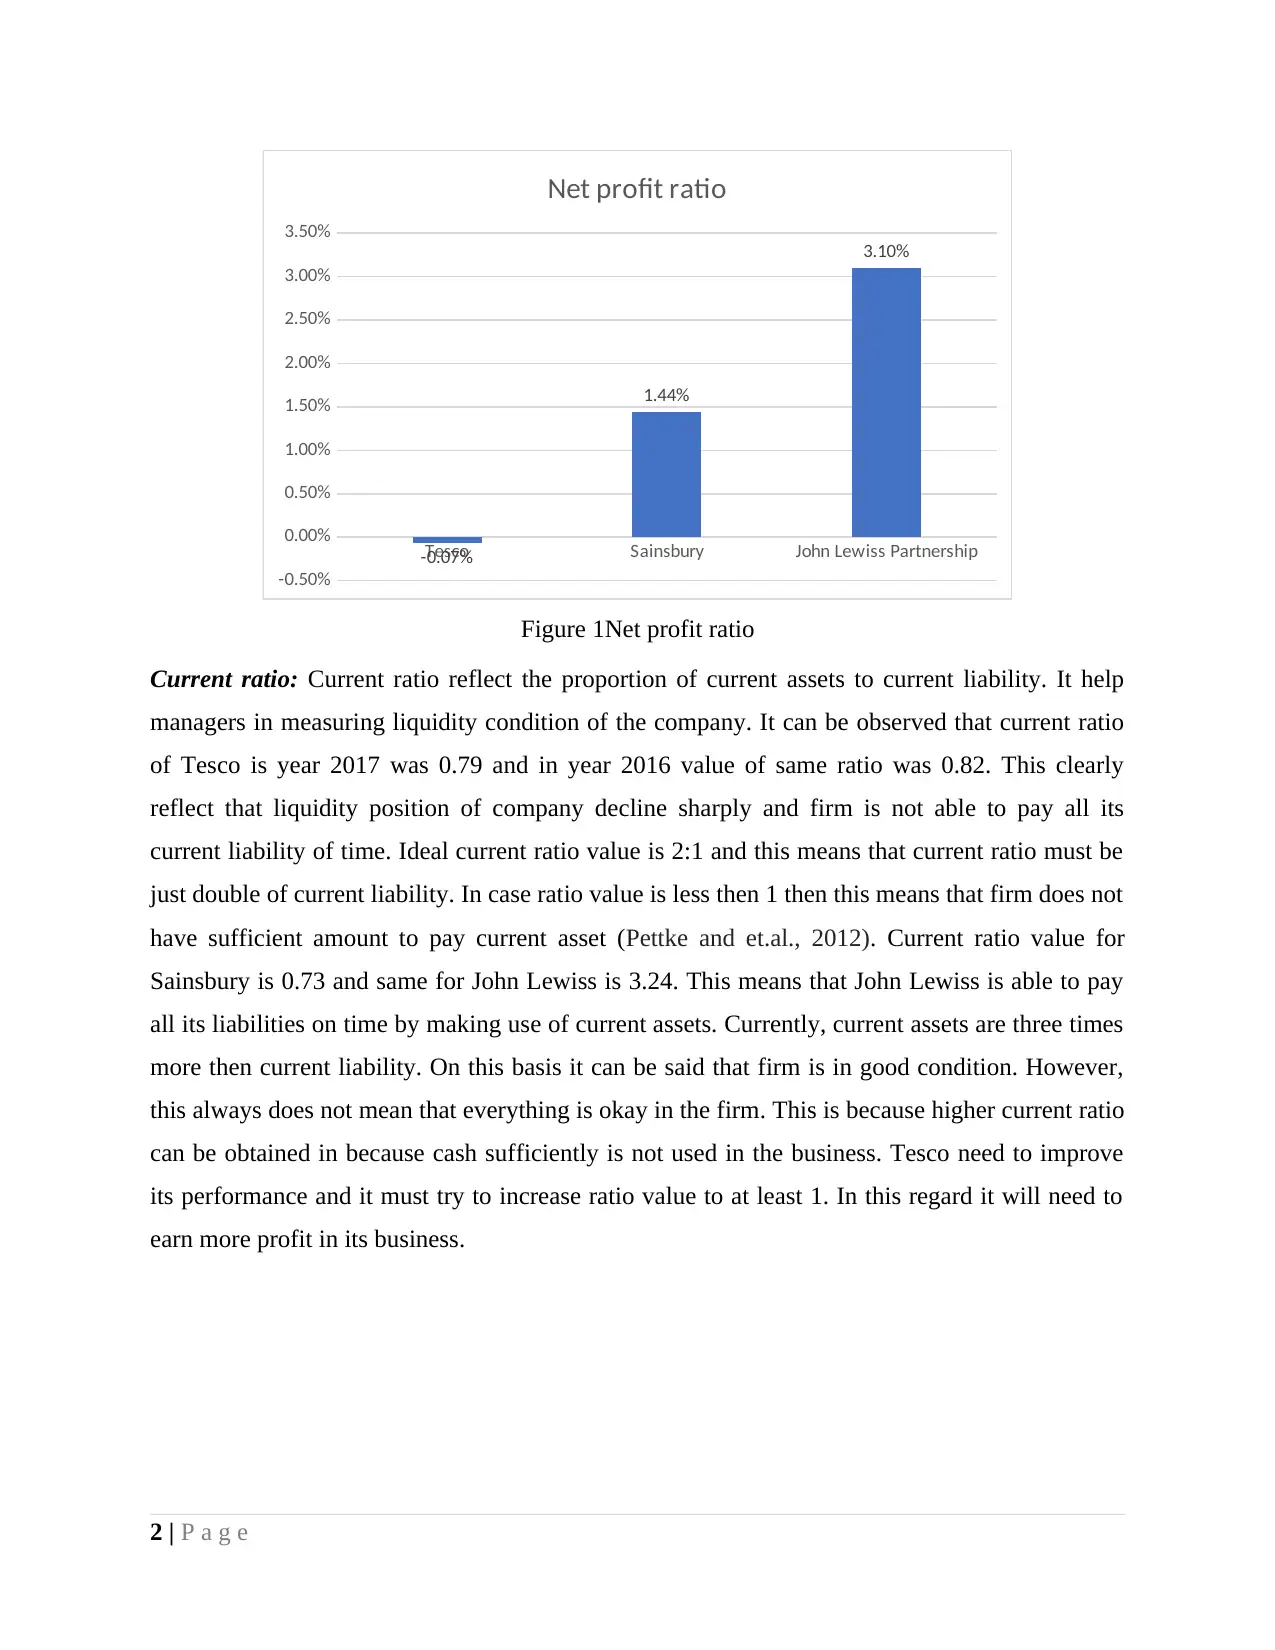
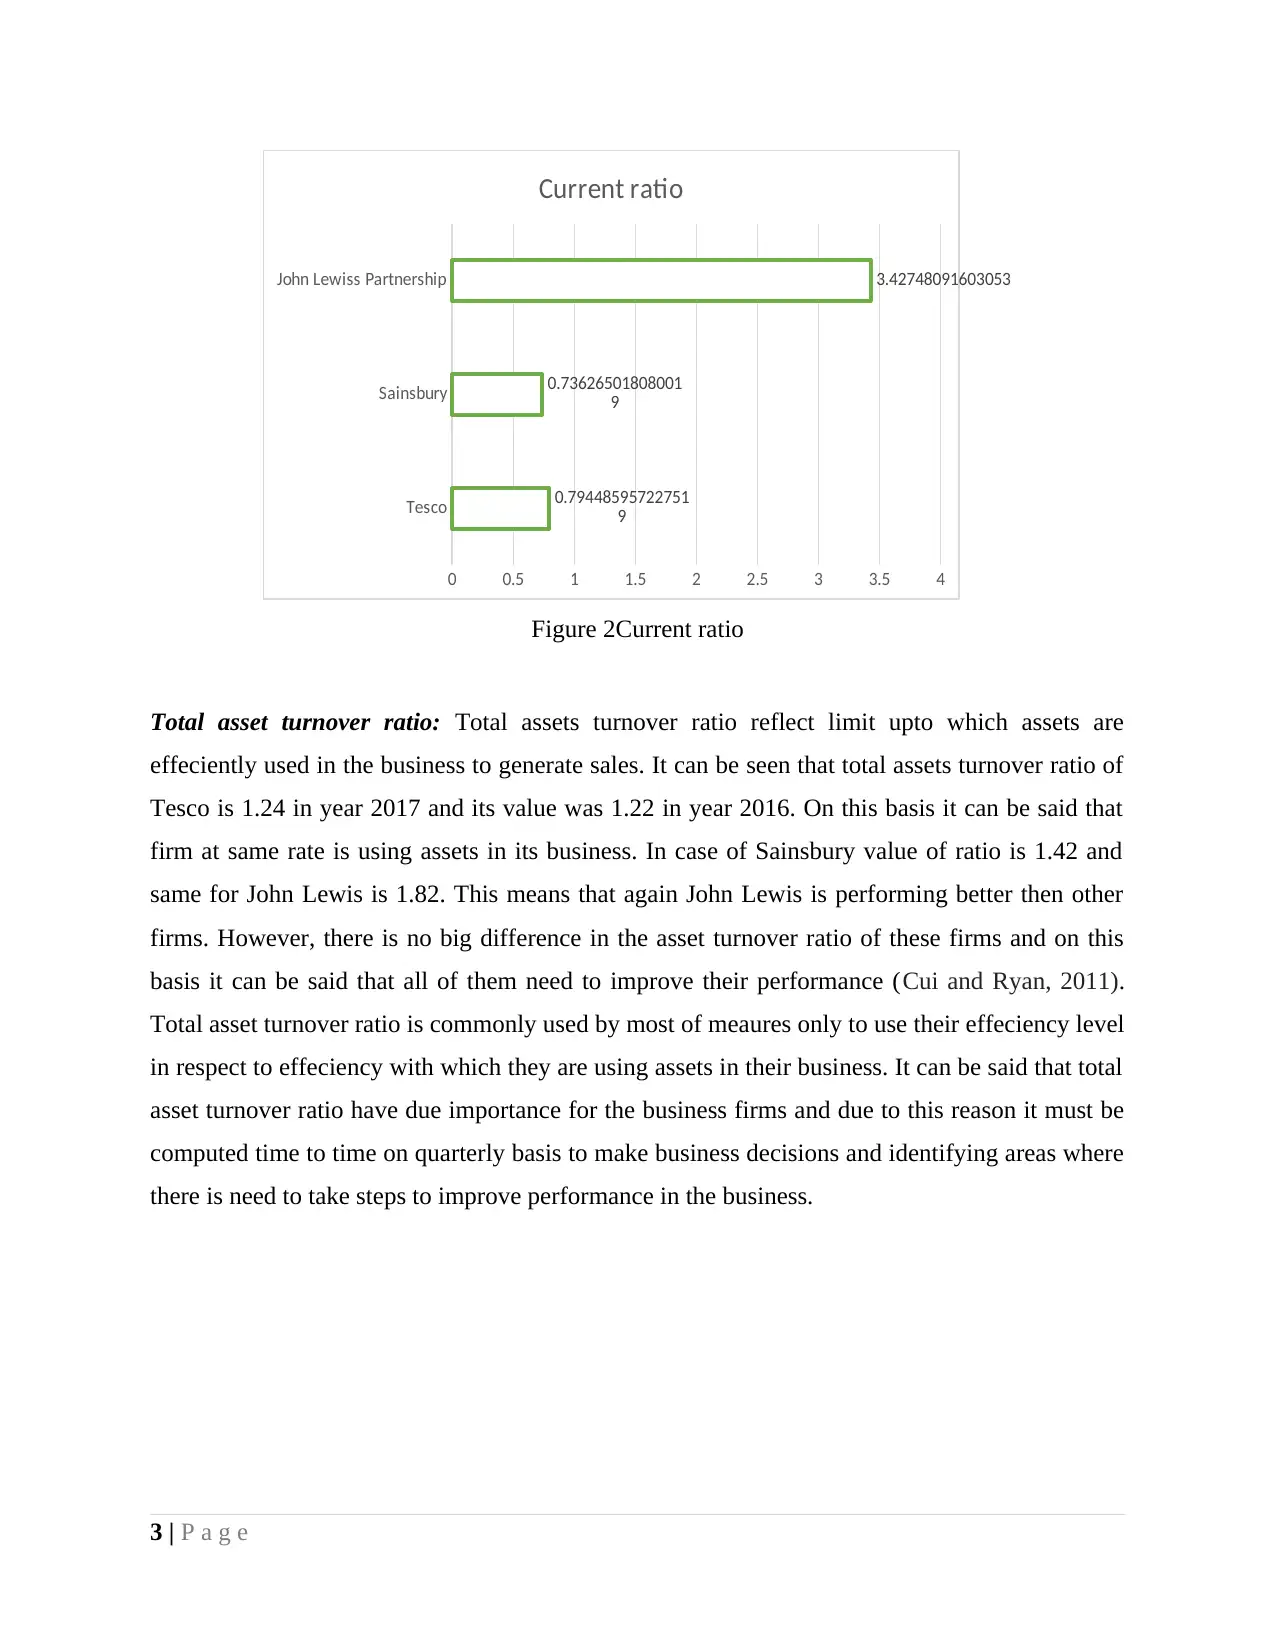
Current ratio: Current ratio reflect the proportion of current assets to current liability. It help
managers in measuring liquidity condition of the company. It can be observed that current ratio
of Tesco is year 2017 was 0.79 and in year 2016 value of same ratio was 0.82. This clearly
reflect that liquidity position of company decline sharply and firm is not able to pay all its
current liability of time. Ideal current ratio value is 2:1 and this means that current ratio must be
just double of current liability. In case ratio value is less then 1 then this means that firm does not
have sufficient amount to pay current asset (Pettke and et.al., 2012). Current ratio value for
Sainsbury is 0.73 and same for John Lewiss is 3.24. This means that John Lewiss is able to pay
all its liabilities on time by making use of current assets. Currently, current assets are three times
more then current liability. On this basis it can be said that firm is in good condition. However,
this always does not mean that everything is okay in the firm. This is because higher current ratio
can be obtained in because cash sufficiently is not used in the business. Tesco need to improve
its performance and it must try to increase ratio value to at least 1. In this regard it will need to
earn more profit in its business.
2 | P a g e
-0.50%
0.00%
0.50%
1.00%
1.50%
2.00%
2.50%
3.00%
3.50%
-0.07%
1.44%
3.10%
Net profit ratio
Figure 1Net profit ratio
Current ratio: Current ratio reflect the proportion of current assets to current liability. It help
managers in measuring liquidity condition of the company. It can be observed that current ratio
of Tesco is year 2017 was 0.79 and in year 2016 value of same ratio was 0.82. This clearly
reflect that liquidity position of company decline sharply and firm is not able to pay all its
current liability of time. Ideal current ratio value is 2:1 and this means that current ratio must be
just double of current liability. In case ratio value is less then 1 then this means that firm does not
have sufficient amount to pay current asset (Pettke and et.al., 2012). Current ratio value for
Sainsbury is 0.73 and same for John Lewiss is 3.24. This means that John Lewiss is able to pay
all its liabilities on time by making use of current assets. Currently, current assets are three times
more then current liability. On this basis it can be said that firm is in good condition. However,
this always does not mean that everything is okay in the firm. This is because higher current ratio
can be obtained in because cash sufficiently is not used in the business. Tesco need to improve
its performance and it must try to increase ratio value to at least 1. In this regard it will need to
earn more profit in its business.
2 | P a g e
Paraphrase This Document
Need a fresh take? Get an instant paraphrase of this document with our AI Paraphraser
Tesco
Sainsbury
John Lewiss Partnership
0 0.5 1 1.5 2 2.5 3 3.5 4
0.79448595722751
9
0.73626501808001
9
3.42748091603053
Current ratio
Figure 2Current ratio
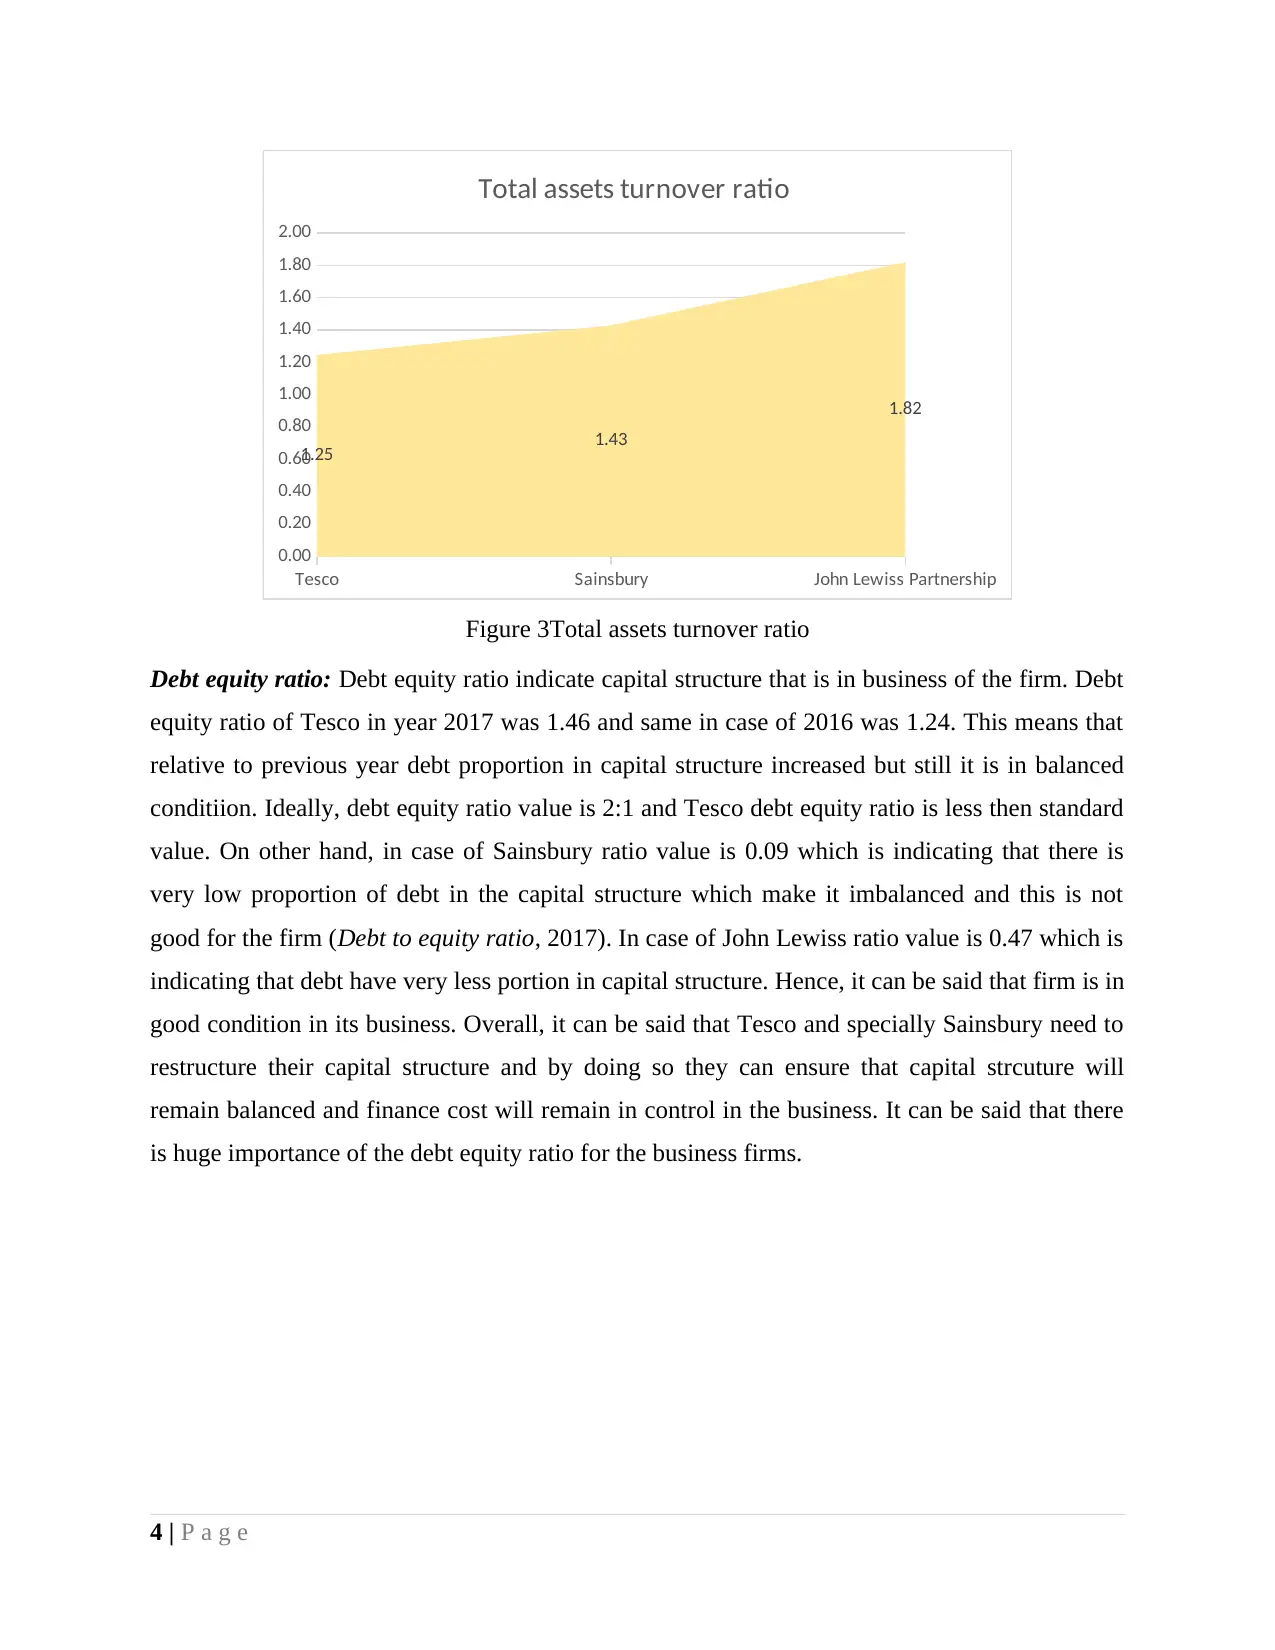
Total asset turnover ratio: Total assets turnover ratio reflect limit upto which assets are
effeciently used in the business to generate sales. It can be seen that total assets turnover ratio of
Tesco is 1.24 in year 2017 and its value was 1.22 in year 2016. On this basis it can be said that
firm at same rate is using assets in its business. In case of Sainsbury value of ratio is 1.42 and
same for John Lewis is 1.82. This means that again John Lewis is performing better then other
firms. However, there is no big difference in the asset turnover ratio of these firms and on this
basis it can be said that all of them need to improve their performance (Cui and Ryan, 2011).
Total asset turnover ratio is commonly used by most of meaures only to use their effeciency level
in respect to effeciency with which they are using assets in their business. It can be said that total
asset turnover ratio have due importance for the business firms and due to this reason it must be
computed time to time on quarterly basis to make business decisions and identifying areas where
there is need to take steps to improve performance in the business.
3 | P a g e
Sainsbury
John Lewiss Partnership
0 0.5 1 1.5 2 2.5 3 3.5 4
0.79448595722751
9
0.73626501808001
9
3.42748091603053
Current ratio
Figure 2Current ratio
Total asset turnover ratio: Total assets turnover ratio reflect limit upto which assets are
effeciently used in the business to generate sales. It can be seen that total assets turnover ratio of
Tesco is 1.24 in year 2017 and its value was 1.22 in year 2016. On this basis it can be said that
firm at same rate is using assets in its business. In case of Sainsbury value of ratio is 1.42 and
same for John Lewis is 1.82. This means that again John Lewis is performing better then other
firms. However, there is no big difference in the asset turnover ratio of these firms and on this
basis it can be said that all of them need to improve their performance (Cui and Ryan, 2011).
Total asset turnover ratio is commonly used by most of meaures only to use their effeciency level
in respect to effeciency with which they are using assets in their business. It can be said that total
asset turnover ratio have due importance for the business firms and due to this reason it must be
computed time to time on quarterly basis to make business decisions and identifying areas where
there is need to take steps to improve performance in the business.
3 | P a g e
Tesco Sainsbury John Lewiss Partnership
0.00
0.20
0.40
0.60
0.80
1.00
1.20
1.40
1.60
1.80
2.00
1.25 1.43
1.82
Total assets turnover ratio
Figure 3Total assets turnover ratio
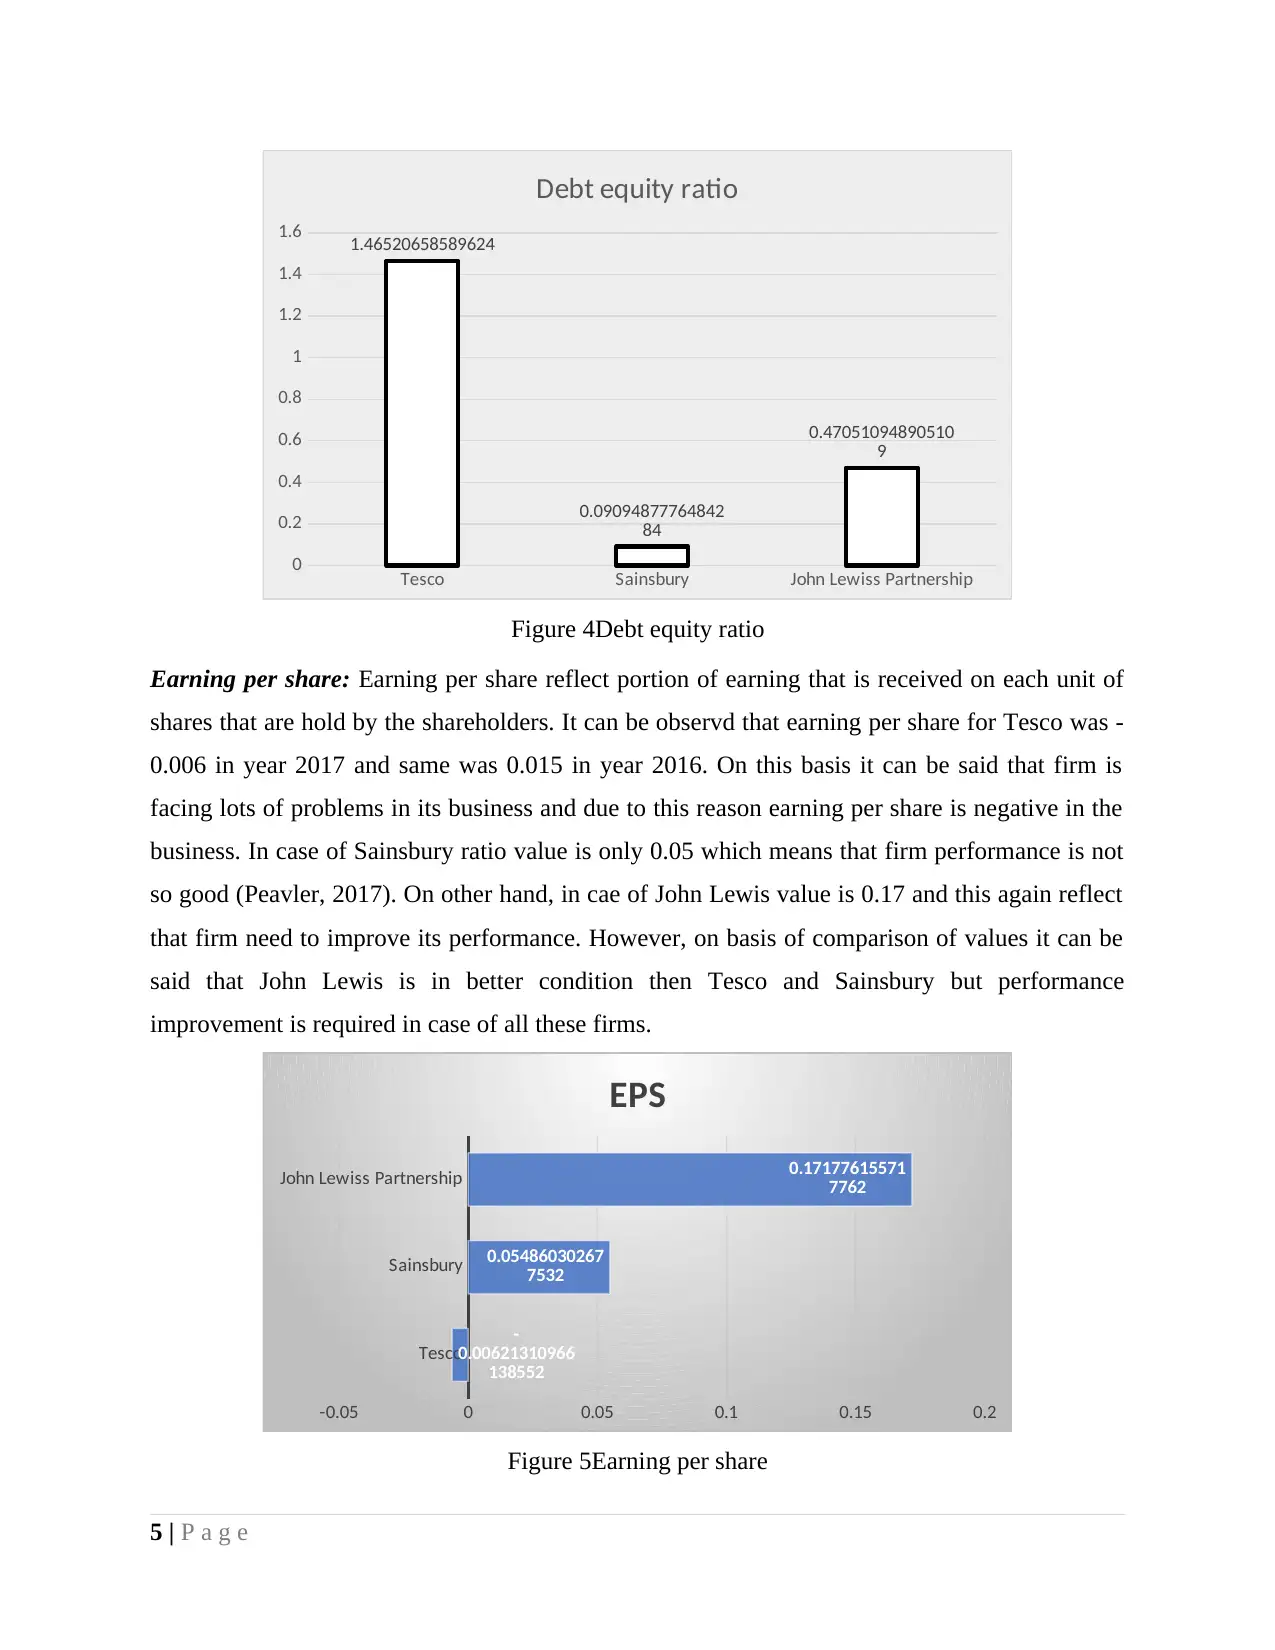
Debt equity ratio: Debt equity ratio indicate capital structure that is in business of the firm. Debt
equity ratio of Tesco in year 2017 was 1.46 and same in case of 2016 was 1.24. This means that
relative to previous year debt proportion in capital structure increased but still it is in balanced
conditiion. Ideally, debt equity ratio value is 2:1 and Tesco debt equity ratio is less then standard
value. On other hand, in case of Sainsbury ratio value is 0.09 which is indicating that there is
very low proportion of debt in the capital structure which make it imbalanced and this is not
good for the firm (Debt to equity ratio, 2017). In case of John Lewiss ratio value is 0.47 which is
indicating that debt have very less portion in capital structure. Hence, it can be said that firm is in
good condition in its business. Overall, it can be said that Tesco and specially Sainsbury need to
restructure their capital structure and by doing so they can ensure that capital strcuture will
remain balanced and finance cost will remain in control in the business. It can be said that there
is huge importance of the debt equity ratio for the business firms.
4 | P a g e
0.00
0.20
0.40
0.60
0.80
1.00
1.20
1.40
1.60
1.80
2.00
1.25 1.43
1.82
Total assets turnover ratio
Figure 3Total assets turnover ratio
Debt equity ratio: Debt equity ratio indicate capital structure that is in business of the firm. Debt
equity ratio of Tesco in year 2017 was 1.46 and same in case of 2016 was 1.24. This means that
relative to previous year debt proportion in capital structure increased but still it is in balanced
conditiion. Ideally, debt equity ratio value is 2:1 and Tesco debt equity ratio is less then standard
value. On other hand, in case of Sainsbury ratio value is 0.09 which is indicating that there is
very low proportion of debt in the capital structure which make it imbalanced and this is not
good for the firm (Debt to equity ratio, 2017). In case of John Lewiss ratio value is 0.47 which is
indicating that debt have very less portion in capital structure. Hence, it can be said that firm is in
good condition in its business. Overall, it can be said that Tesco and specially Sainsbury need to
restructure their capital structure and by doing so they can ensure that capital strcuture will
remain balanced and finance cost will remain in control in the business. It can be said that there
is huge importance of the debt equity ratio for the business firms.
4 | P a g e
⊘ This is a preview!⊘
Do you want full access?
Subscribe today to unlock all pages.
Trusted by 1+ million students worldwide
Tesco Sainsbury John Lewiss Partnership
0
0.2
0.4
0.6
0.8
1
1.2
1.4
1.6 1.46520658589624
0.09094877764842
84
0.47051094890510
9
Debt equity ratio
Figure 4Debt equity ratio
Earning per share: Earning per share reflect portion of earning that is received on each unit of
shares that are hold by the shareholders. It can be observd that earning per share for Tesco was -
0.006 in year 2017 and same was 0.015 in year 2016. On this basis it can be said that firm is
facing lots of problems in its business and due to this reason earning per share is negative in the
business. In case of Sainsbury ratio value is only 0.05 which means that firm performance is not
so good (Peavler, 2017). On other hand, in cae of John Lewis value is 0.17 and this again reflect
that firm need to improve its performance. However, on basis of comparison of values it can be
said that John Lewis is in better condition then Tesco and Sainsbury but performance
improvement is required in case of all these firms.
Tesco
Sainsbury
John Lewiss Partnership
-0.05 0 0.05 0.1 0.15 0.2
-
0.00621310966
138552
0.05486030267
7532
0.17177615571
7762
EPS
Figure 5Earning per share
5 | P a g e
Paraphrase This Document
Need a fresh take? Get an instant paraphrase of this document with our AI Paraphraser
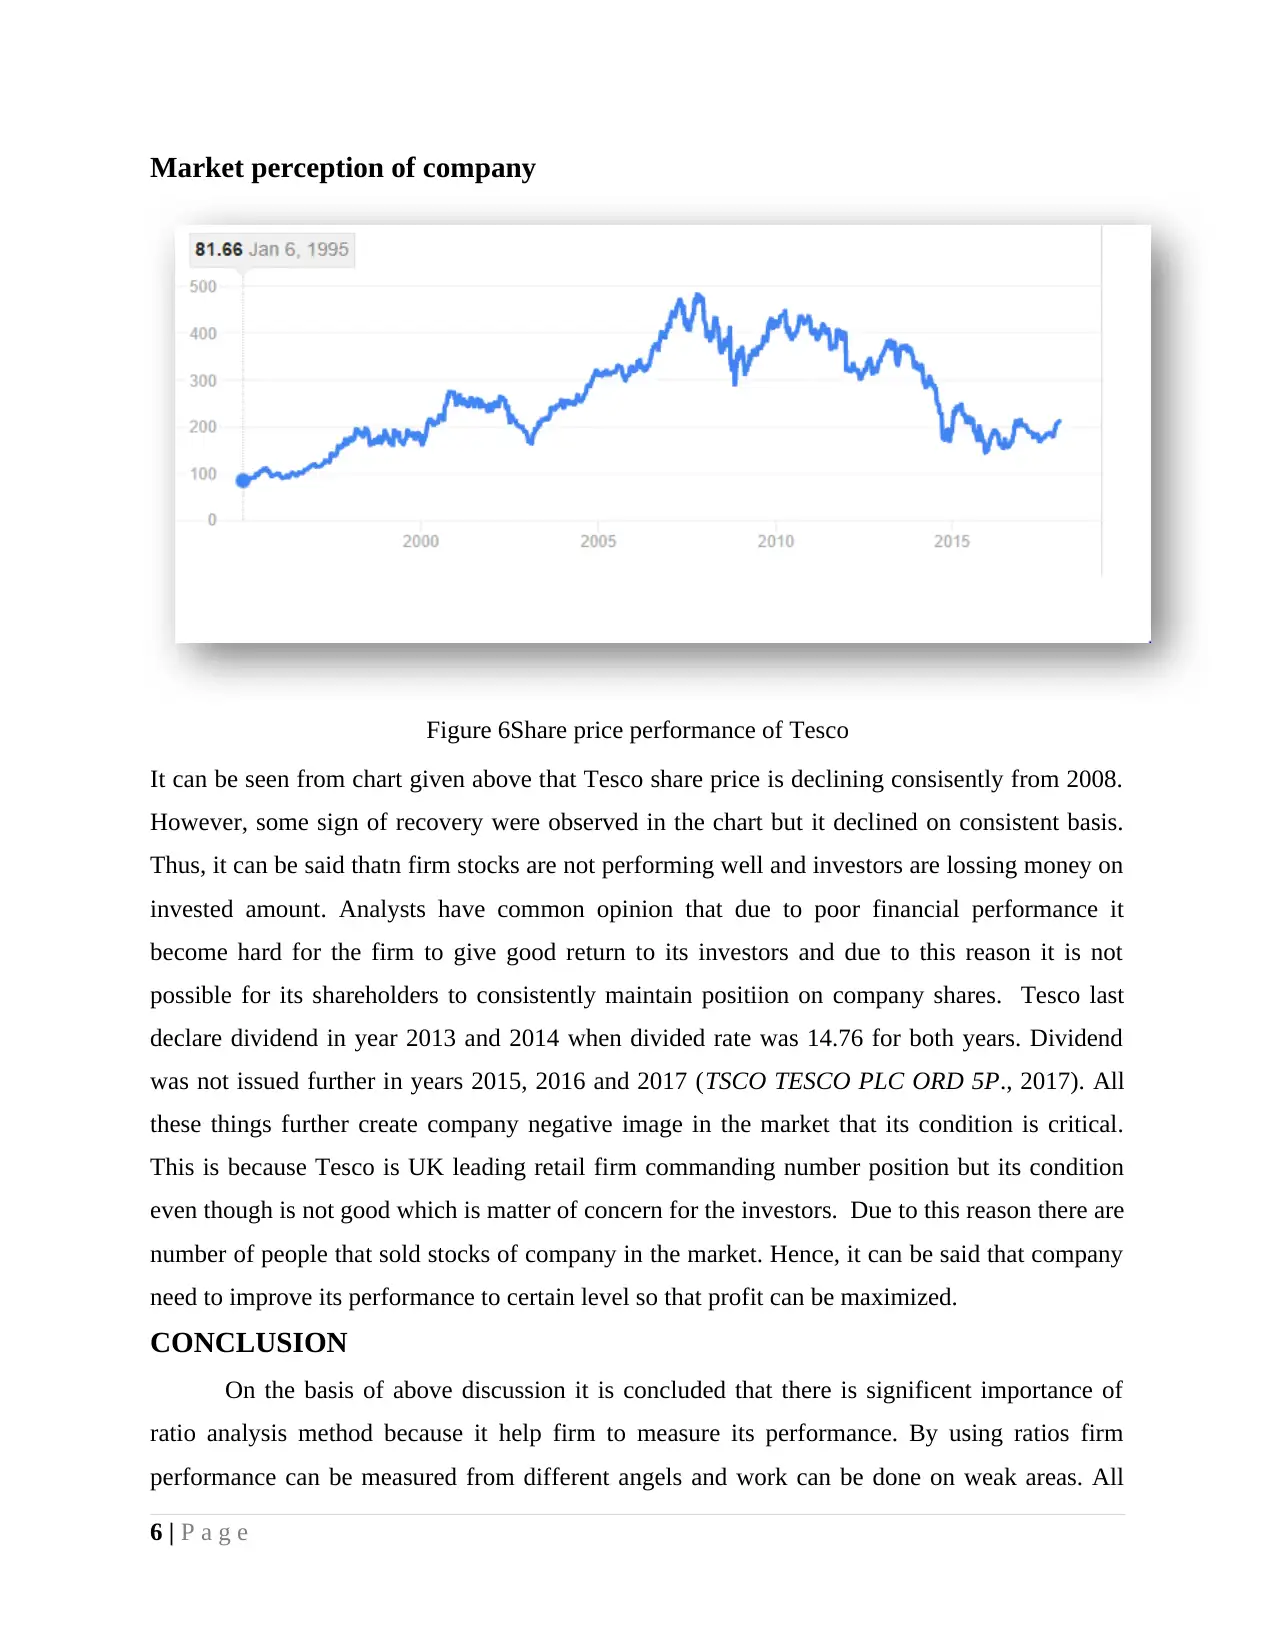
Market perception of company
Figure 6Share price performance of Tesco
It can be seen from chart given above that Tesco share price is declining consisently from 2008.
However, some sign of recovery were observed in the chart but it declined on consistent basis.
Thus, it can be said thatn firm stocks are not performing well and investors are lossing money on
invested amount. Analysts have common opinion that due to poor financial performance it
become hard for the firm to give good return to its investors and due to this reason it is not
possible for its shareholders to consistently maintain positiion on company shares. Tesco last
declare dividend in year 2013 and 2014 when divided rate was 14.76 for both years. Dividend
was not issued further in years 2015, 2016 and 2017 (TSCO TESCO PLC ORD 5P., 2017). All
these things further create company negative image in the market that its condition is critical.
This is because Tesco is UK leading retail firm commanding number position but its condition
even though is not good which is matter of concern for the investors. Due to this reason there are
number of people that sold stocks of company in the market. Hence, it can be said that company
need to improve its performance to certain level so that profit can be maximized.
CONCLUSION
On the basis of above discussion it is concluded that there is significent importance of
ratio analysis method because it help firm to measure its performance. By using ratios firm
performance can be measured from different angels and work can be done on weak areas. All
6 | P a g e
these things lead to improvement in performance of the firm. It is also concluded that firm must
time to time measure its performance and accordingly must make business decisions. By doing
so it can bring itself in good condition.
7 | P a g e
time to time measure its performance and accordingly must make business decisions. By doing
so it can bring itself in good condition.
7 | P a g e
⊘ This is a preview!⊘
Do you want full access?
Subscribe today to unlock all pages.
Trusted by 1+ million students worldwide
REFERENCES
Books and Journals
Cui, X. and Ryan, C., 2011. Perceptions of place, modernity and the impacts of tourism–
Differences among rural and urban residents of Ankang, China: A likelihood ratio
analysis. Tourism Management. 32(3). pp.604-615.
Drivelos, S.A. and Georgiou, C.A., 2012. Multi-element and multi-isotope-ratio analysis to
determine the geographical origin of foods in the European Union. TrAC Trends in
Analytical Chemistry. 40. pp.38-51.
Pettke, T. and et.al., 2012. Recent developments in element concentration and isotope ratio
analysis of individual fluid inclusions by laser ablation single and multiple collector ICP-
MS. Ore Geology Reviews. 44. pp.10-38.
Online
Debt to equity ratio, 2017. [Online]. Available through:<
https://www.accountingformanagement.org/debt-to-equity-ratio/>.
Peavler, 2017. [Online]. What is net profit margin ratio. Available through:<
https://www.thebalance.com/what-is-the-net-profit-margin-ratio-393204>.
TSCO TESCO PLC ORD 5P., 2017. [Online]. Available through:<
https://www.londonstockexchange.com/exchange/prices-and-markets/stocks/summary/
company-summary/GB0008847096GBGBXSET1.html>.
8 | P a g e
1 out of 10
Related Documents


Your All-in-One AI-Powered Toolkit for Academic Success.
+13062052269
info@desklib.com
Available 24*7 on WhatsApp / Email
![[object Object]](/_next/static/media/star-bottom.7253800d.svg)
Unlock your academic potential
Copyright © 2020–2026 A2Z Services. All Rights Reserved. Developed and managed by ZUCOL.