Strategic Financial Management Report: Tesco PLC 2018-2019
VerifiedAdded on 2022/12/19
|15
|3290
|447
Report
AI Summary
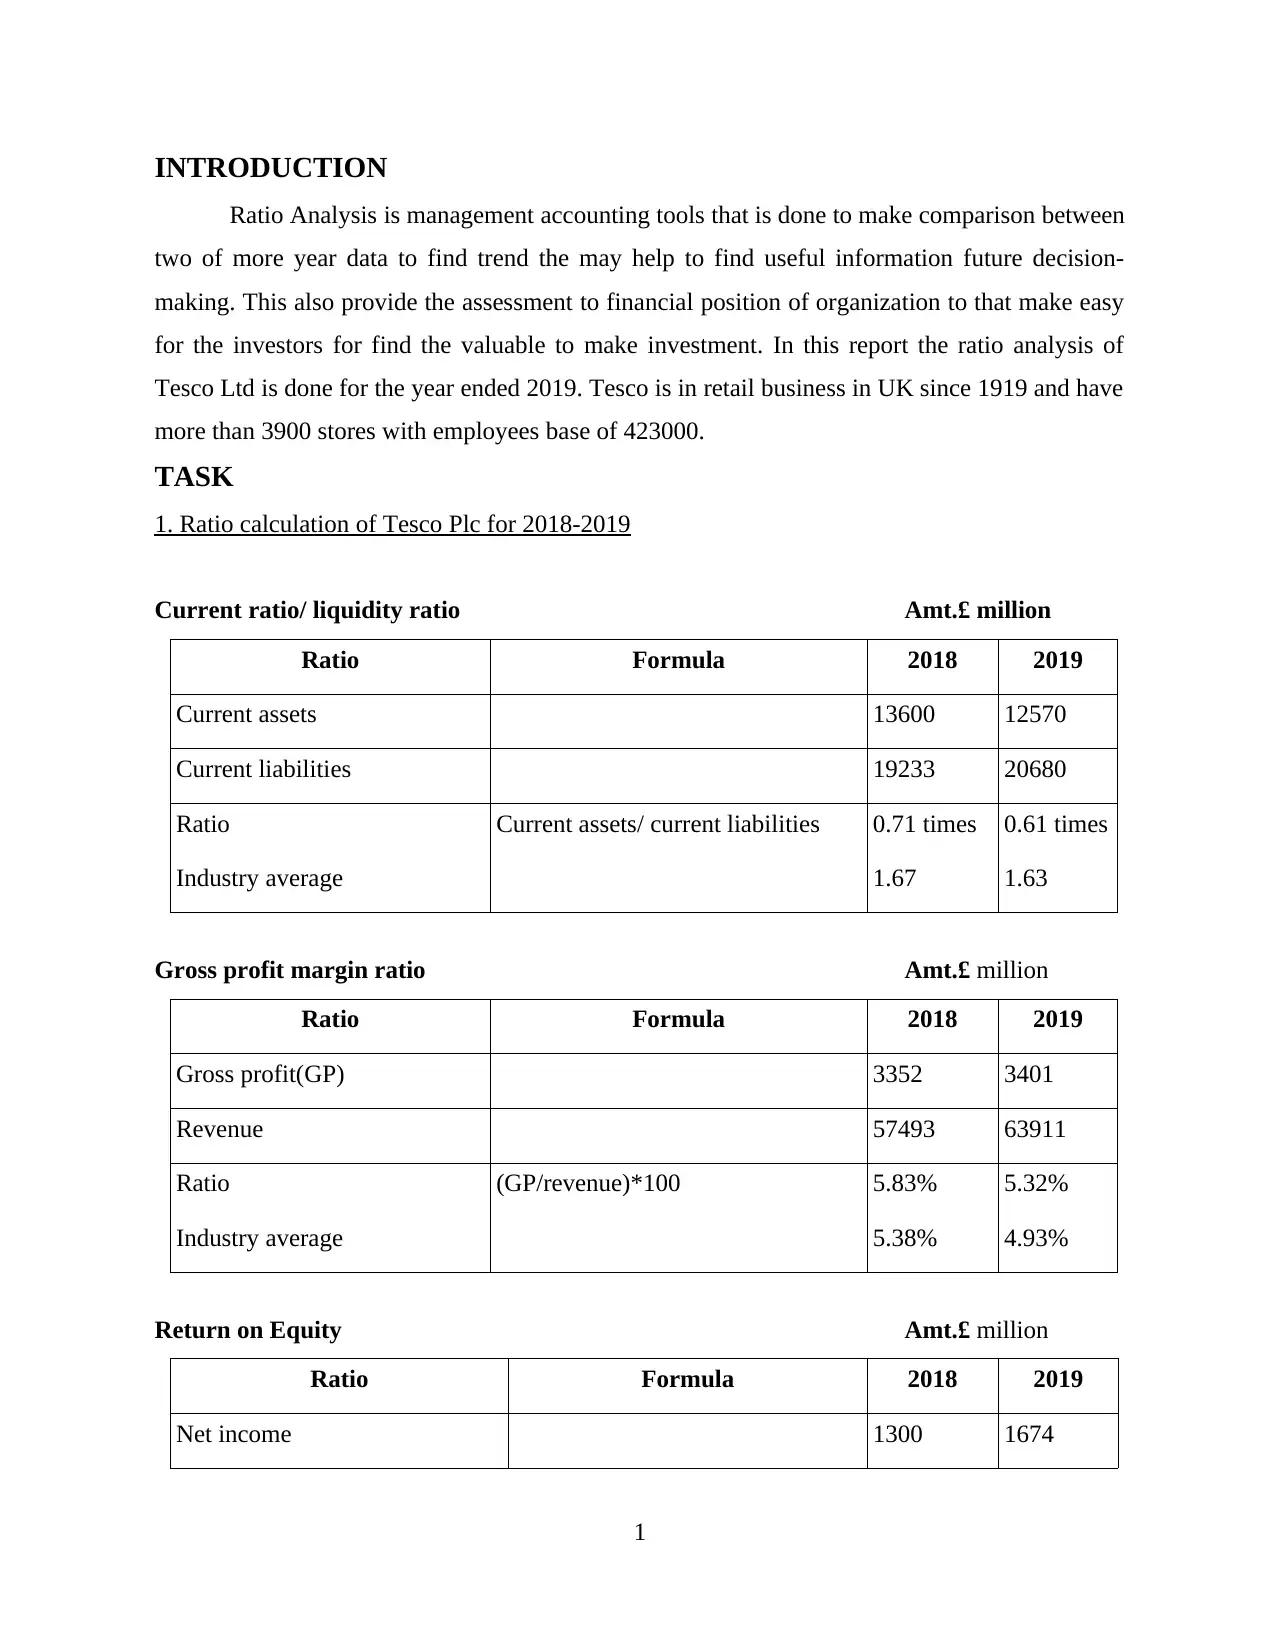
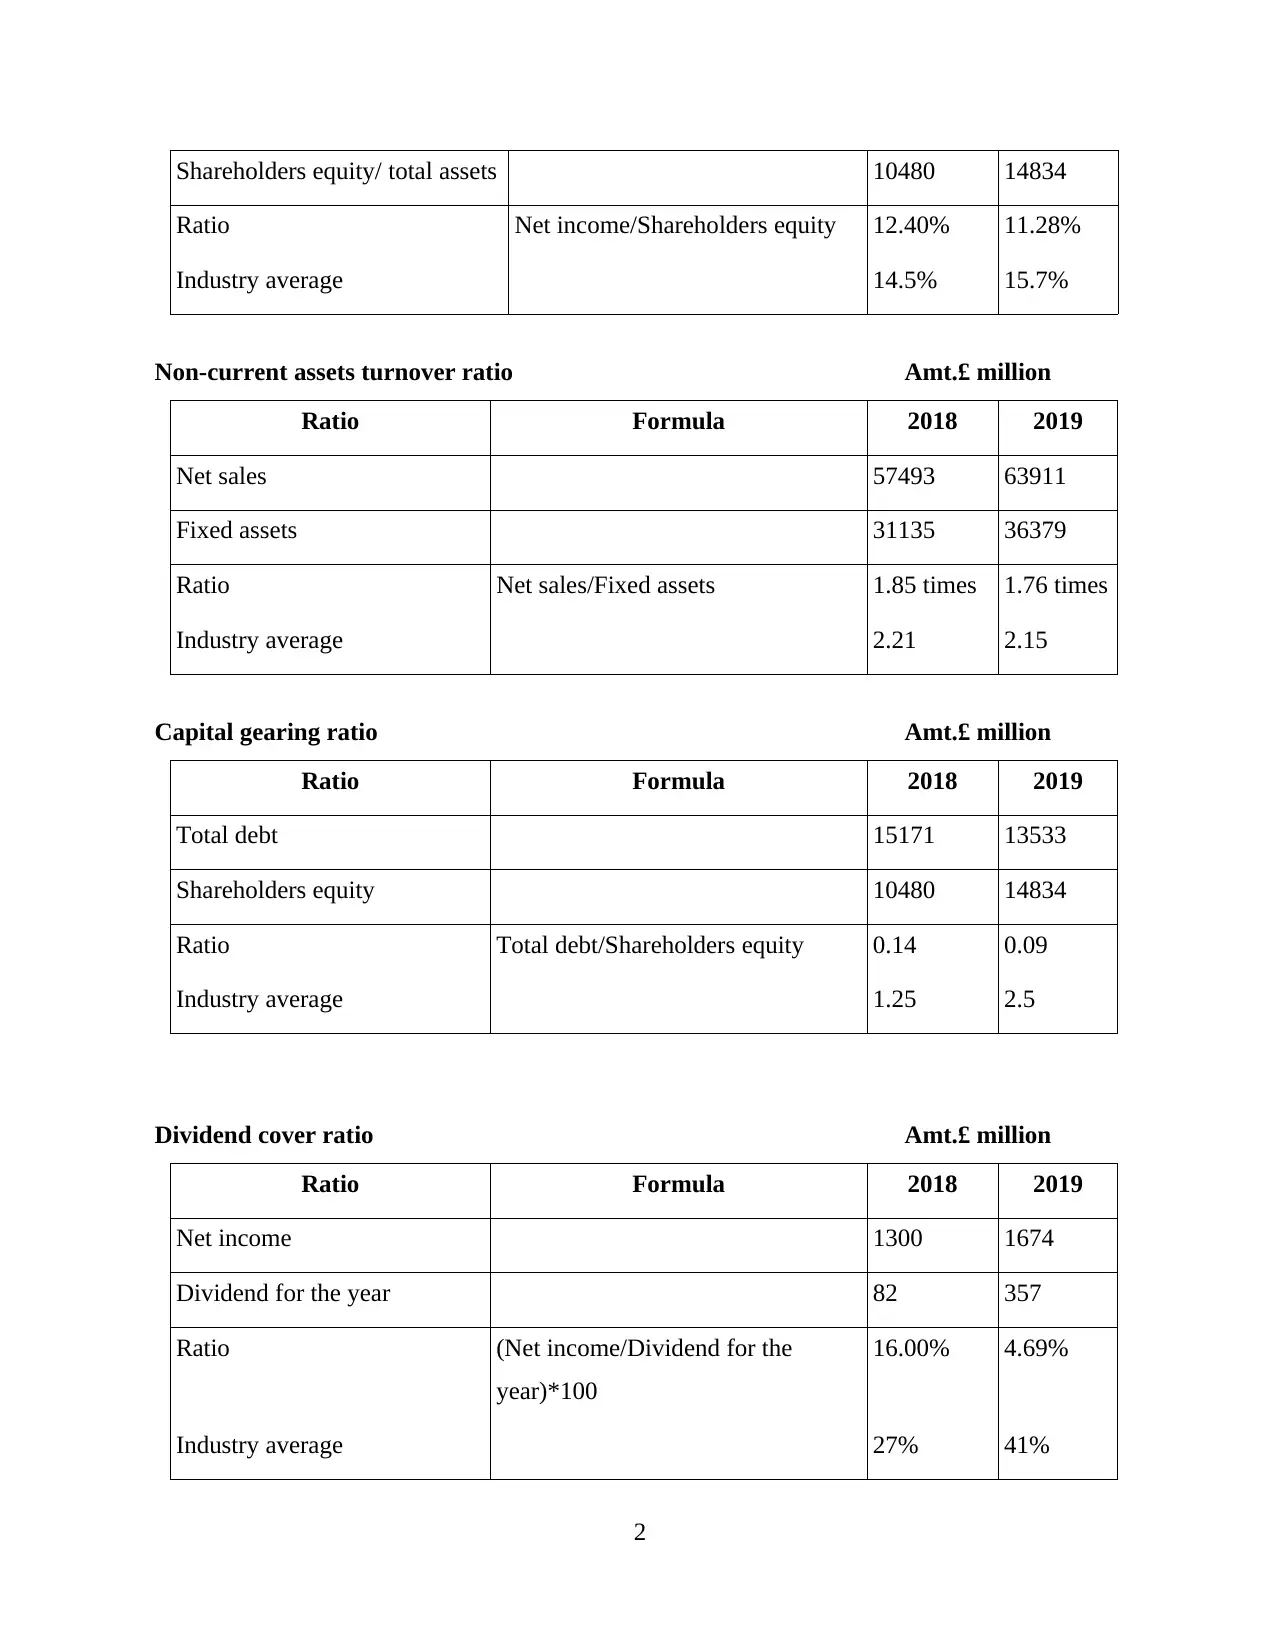
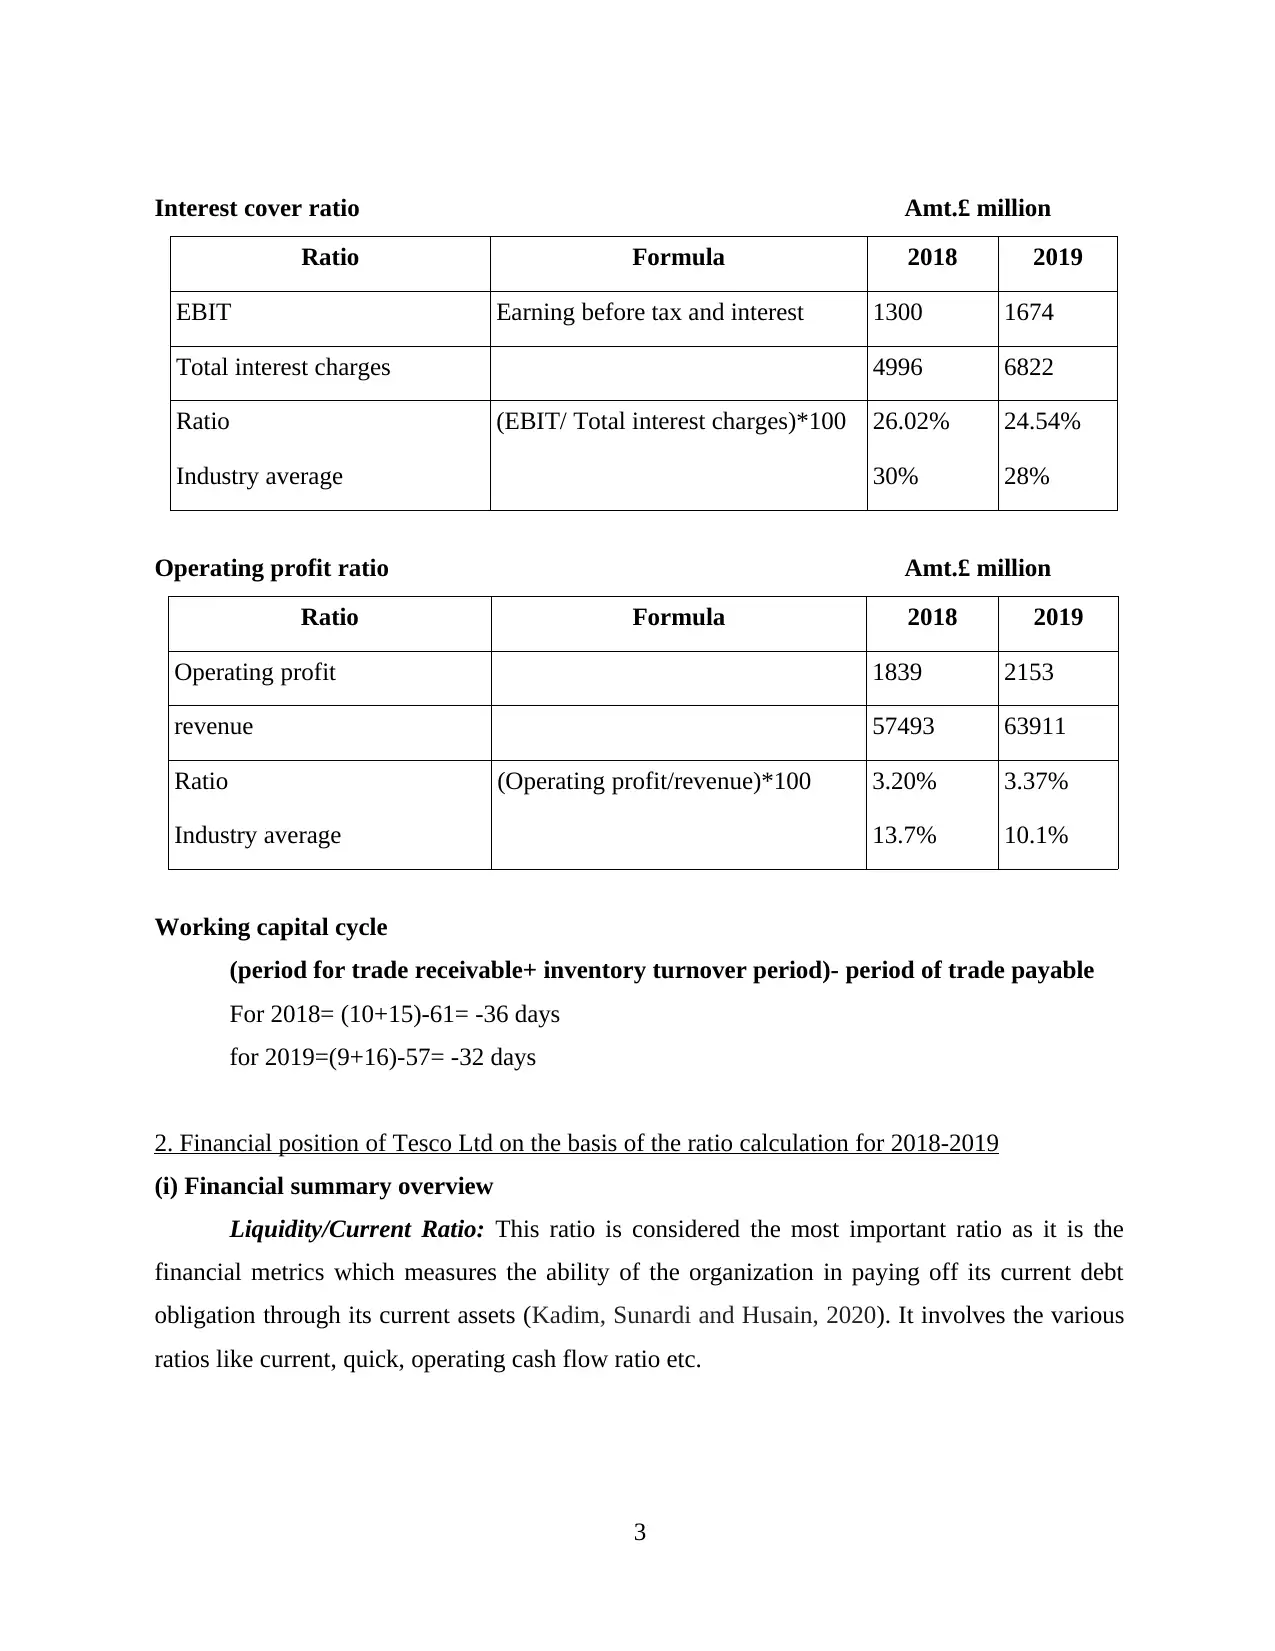
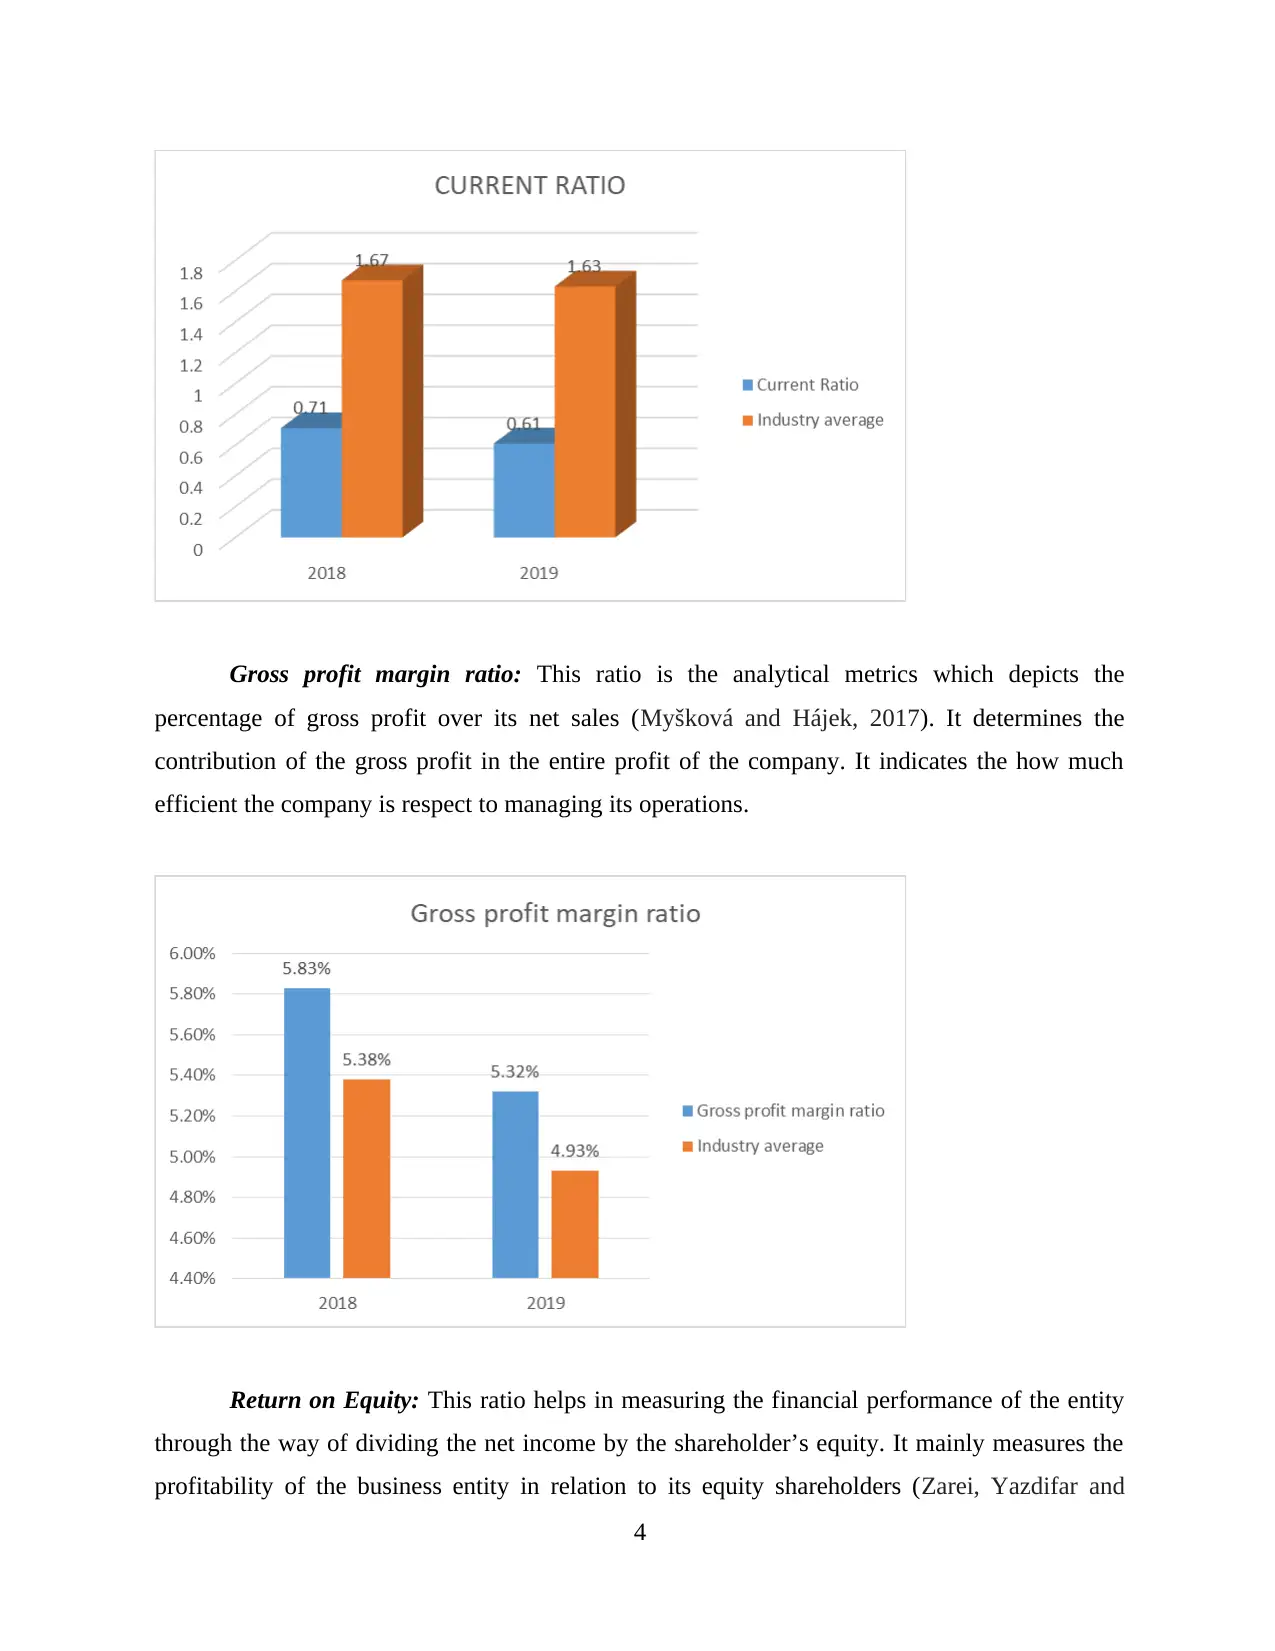
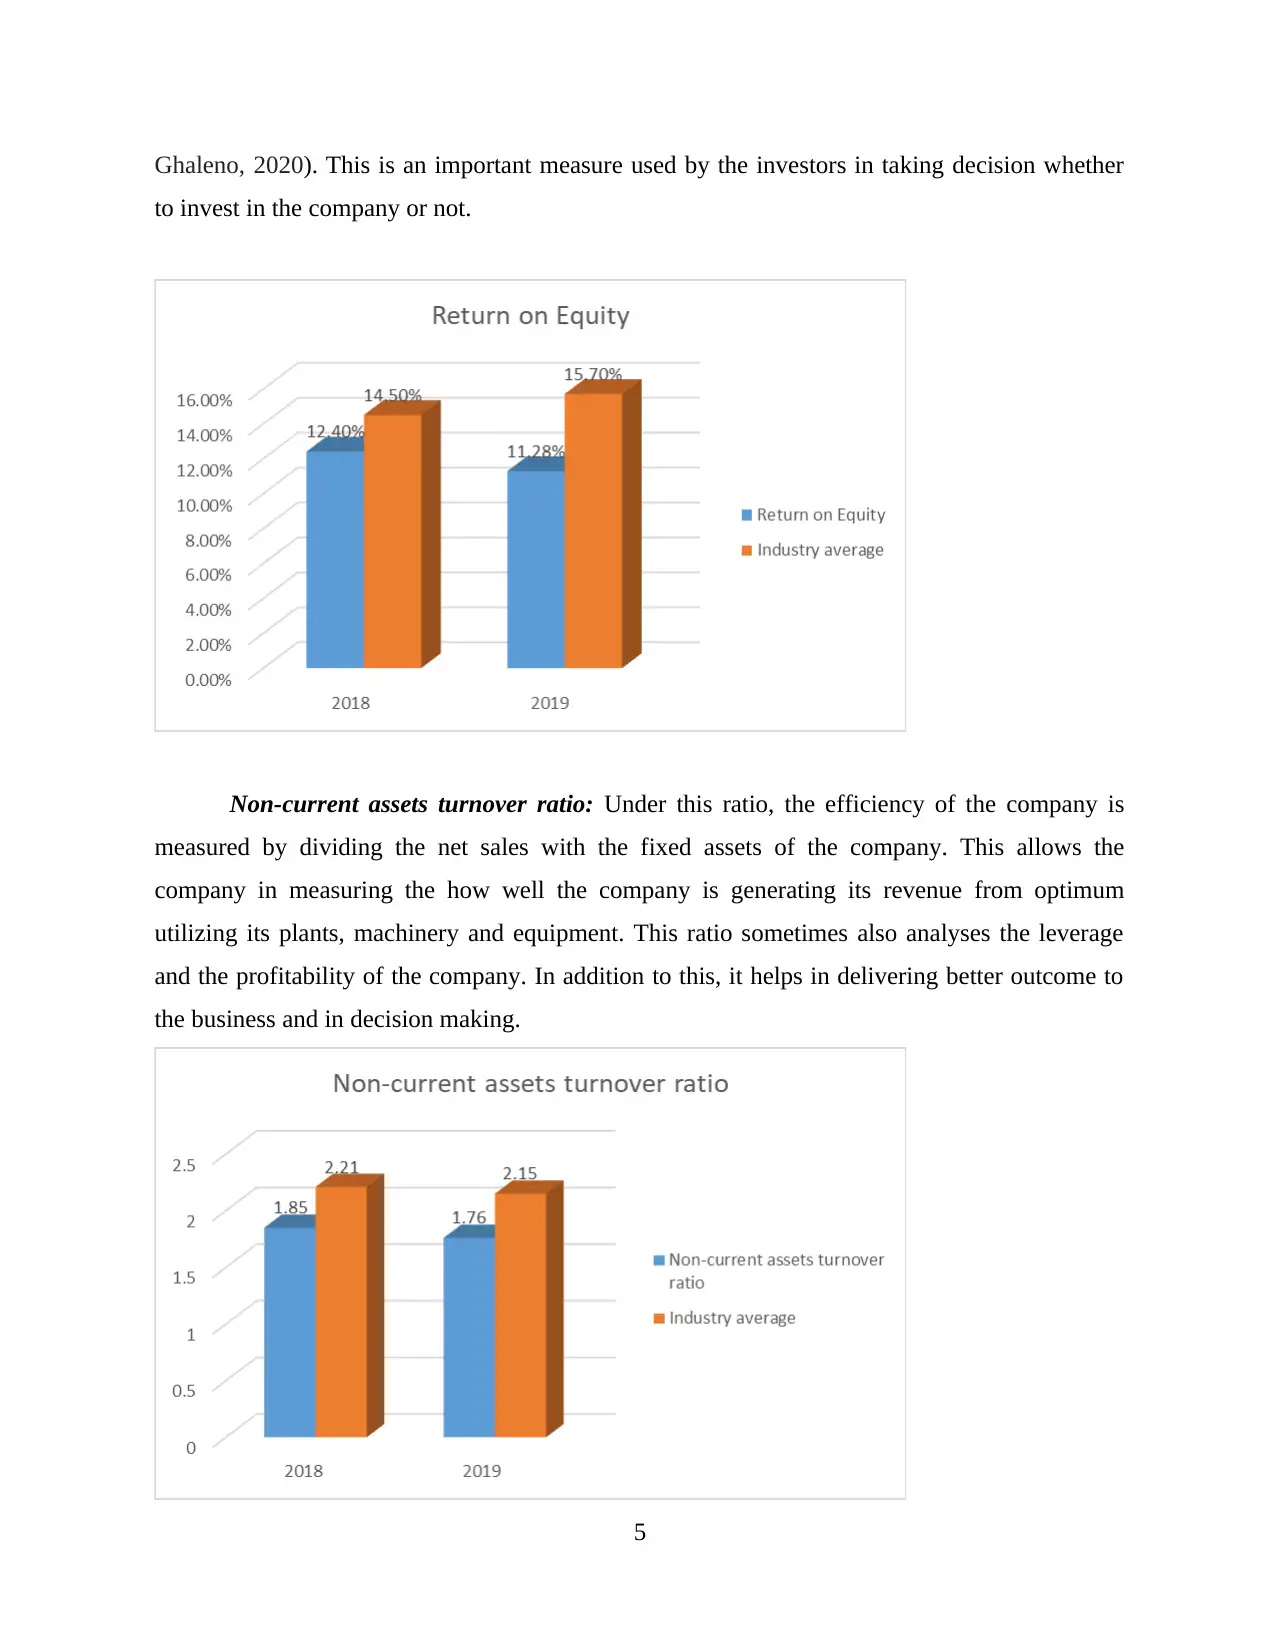
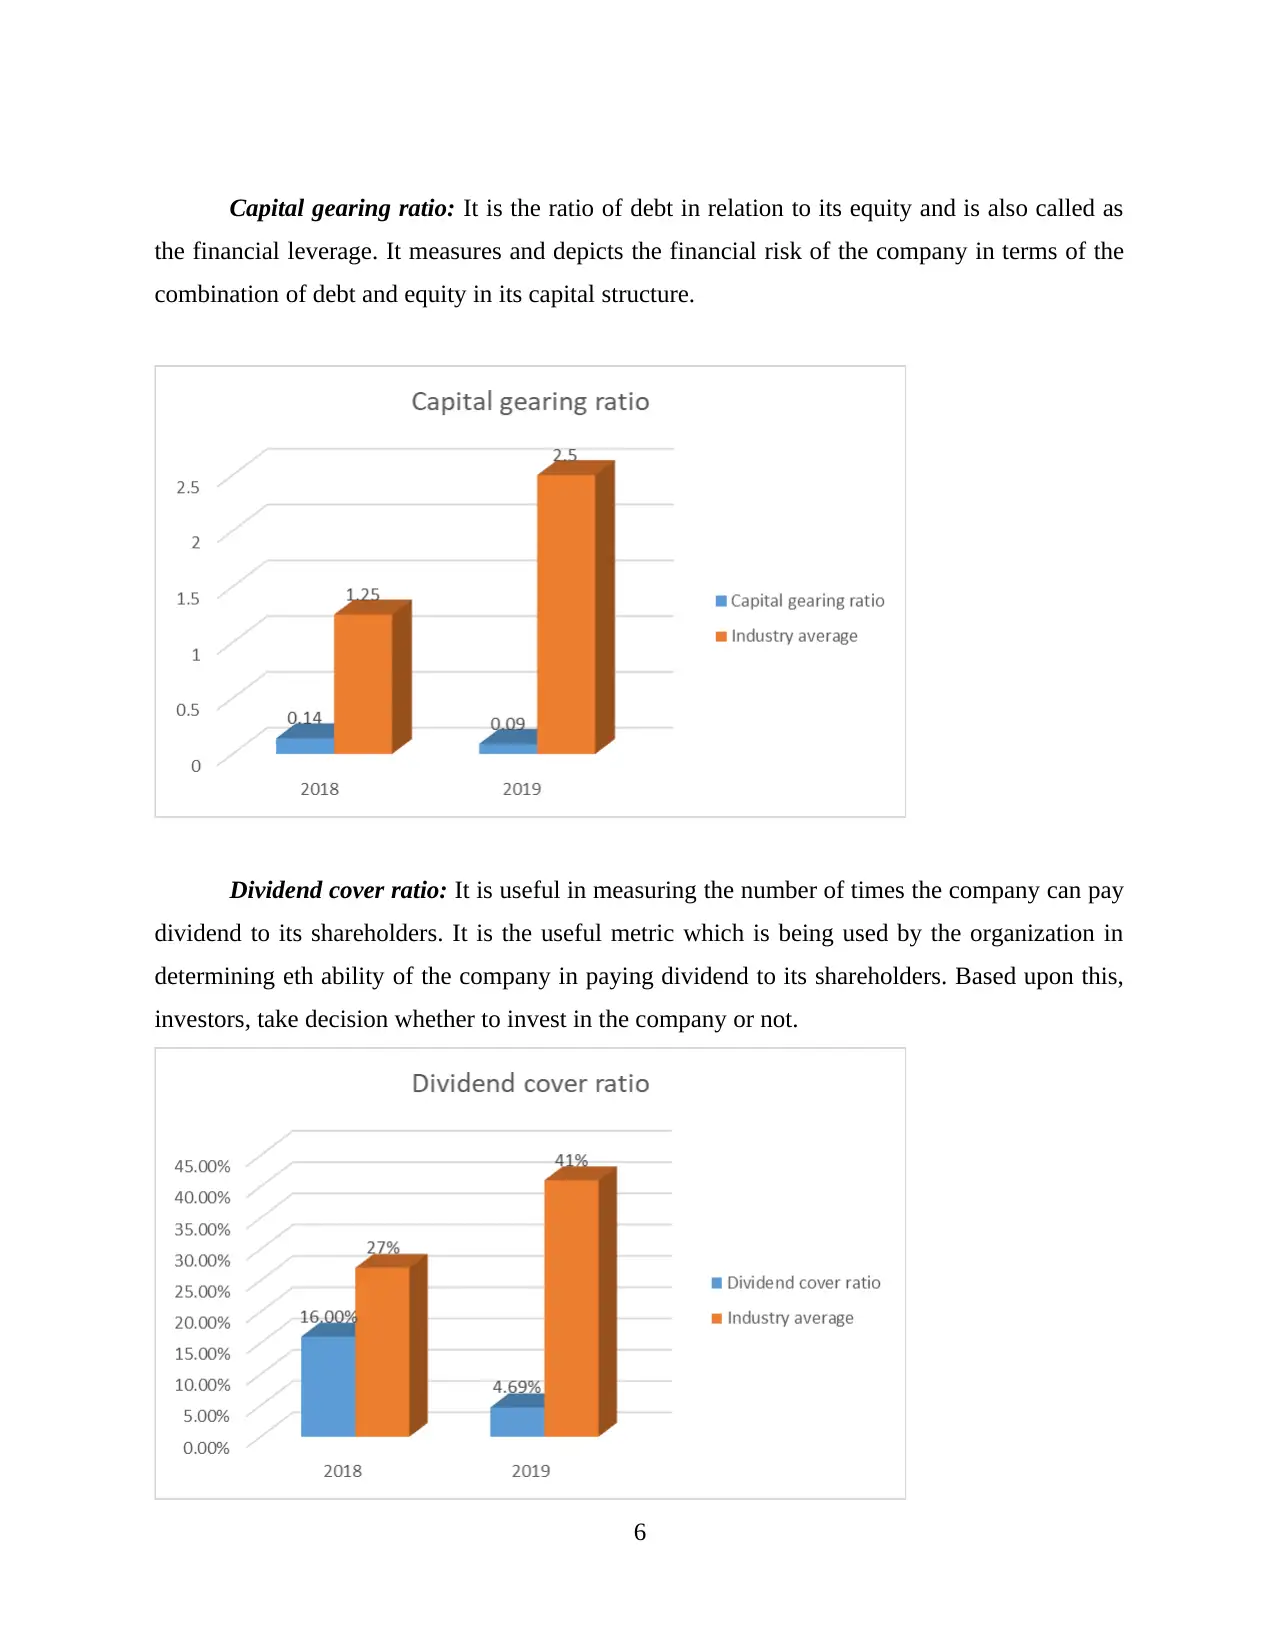
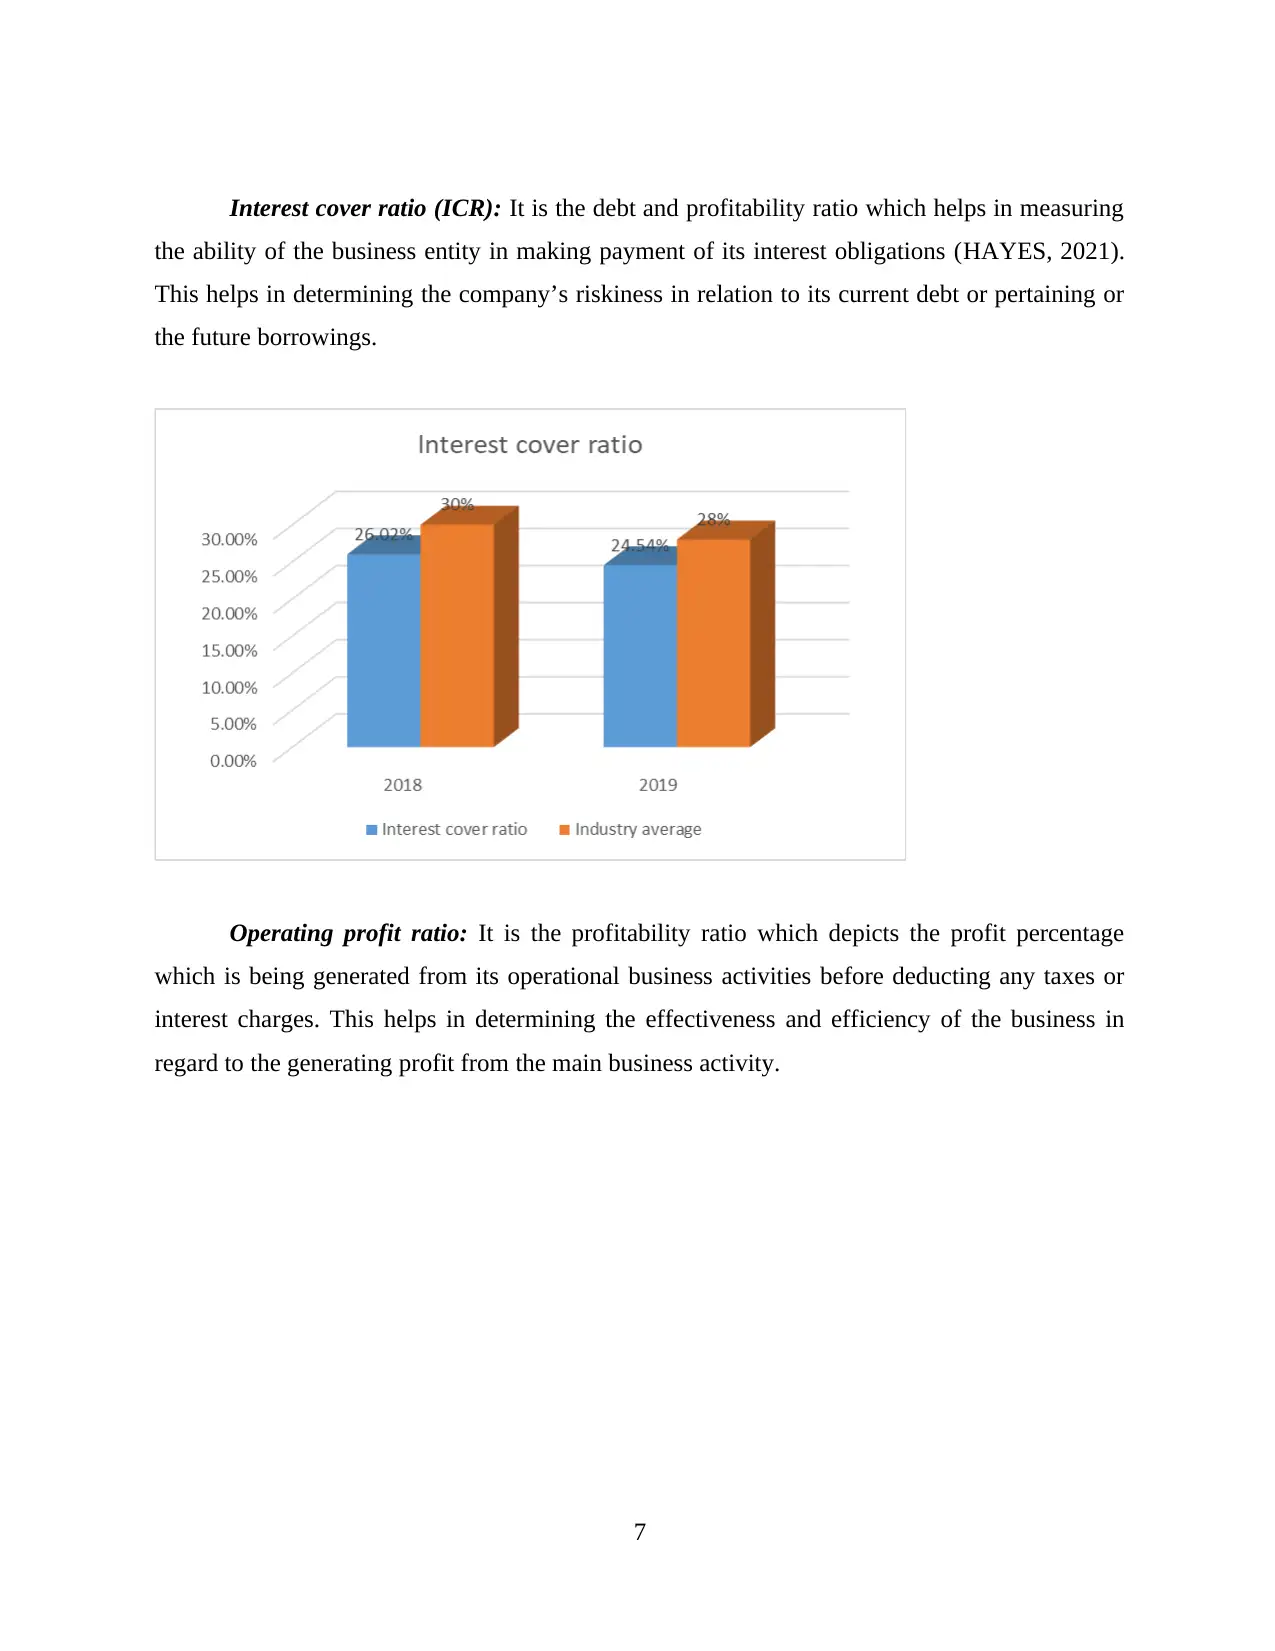
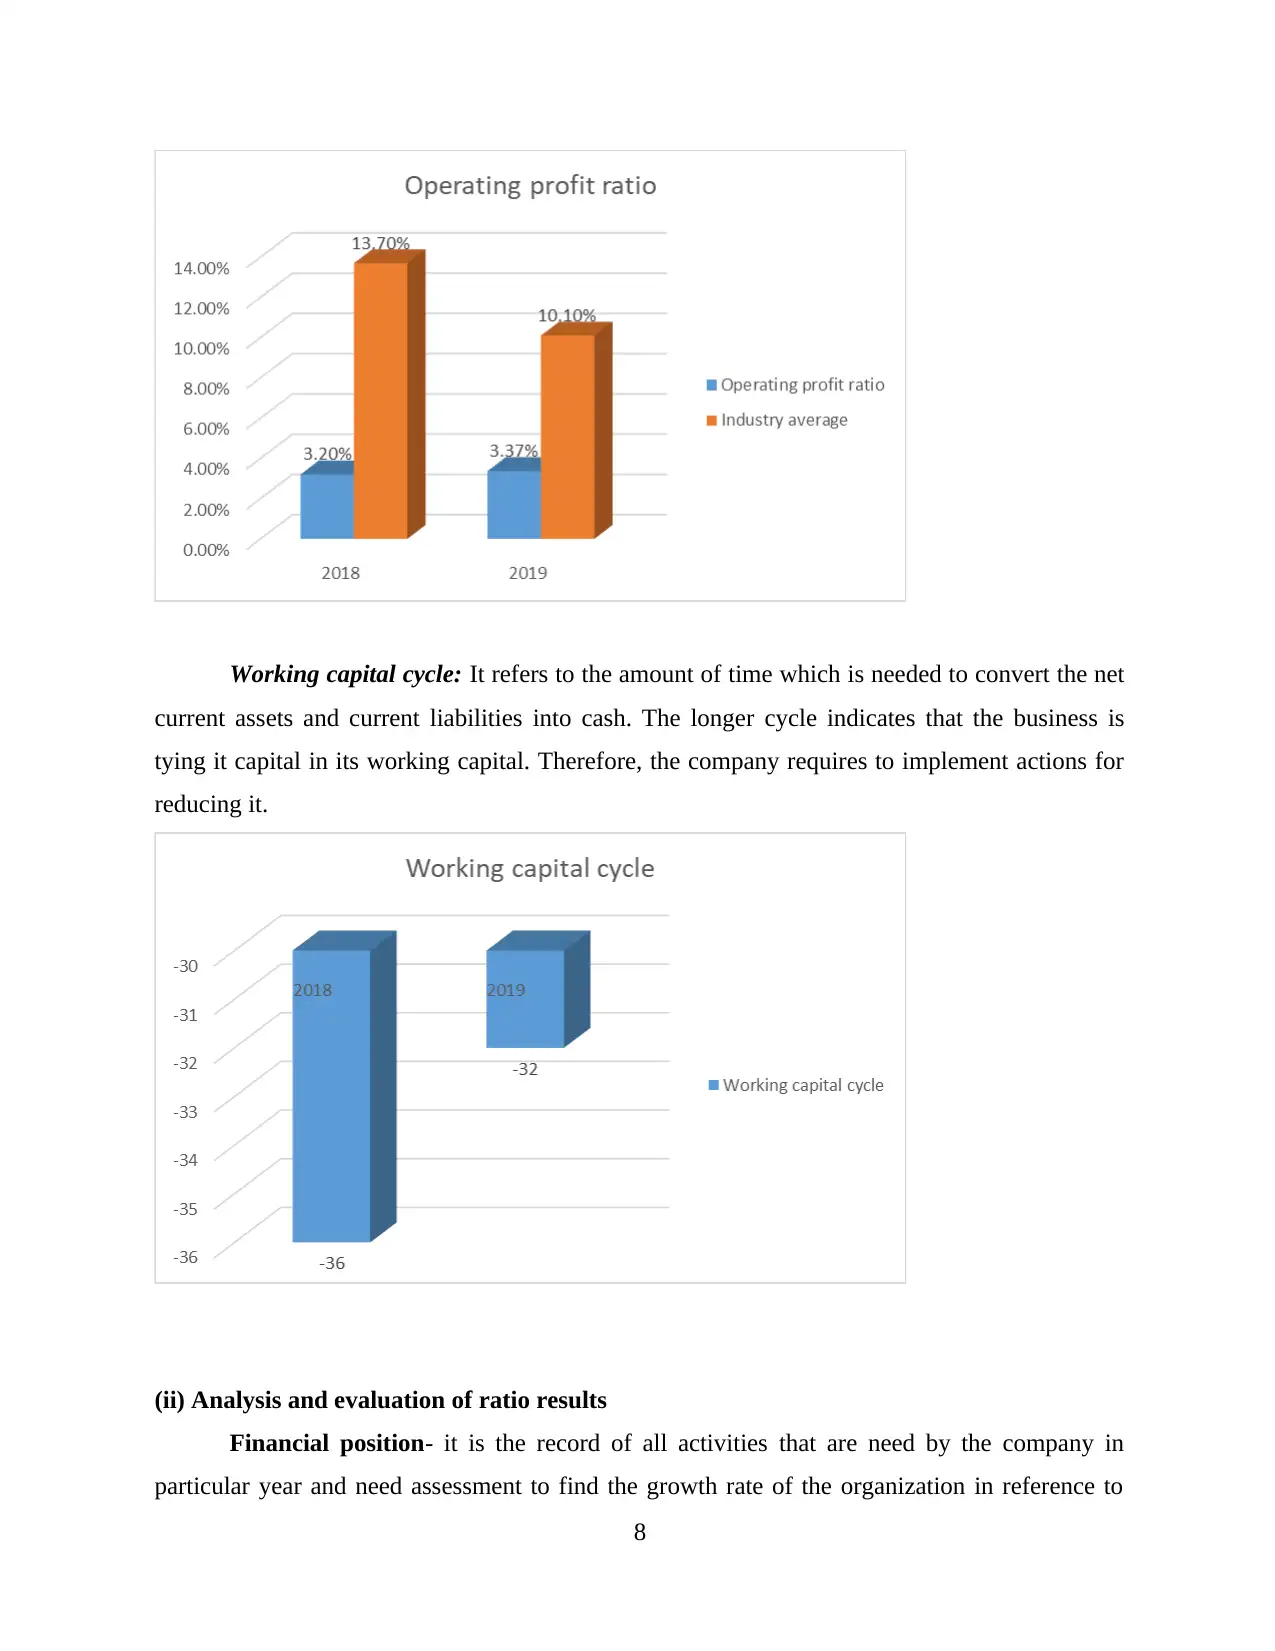
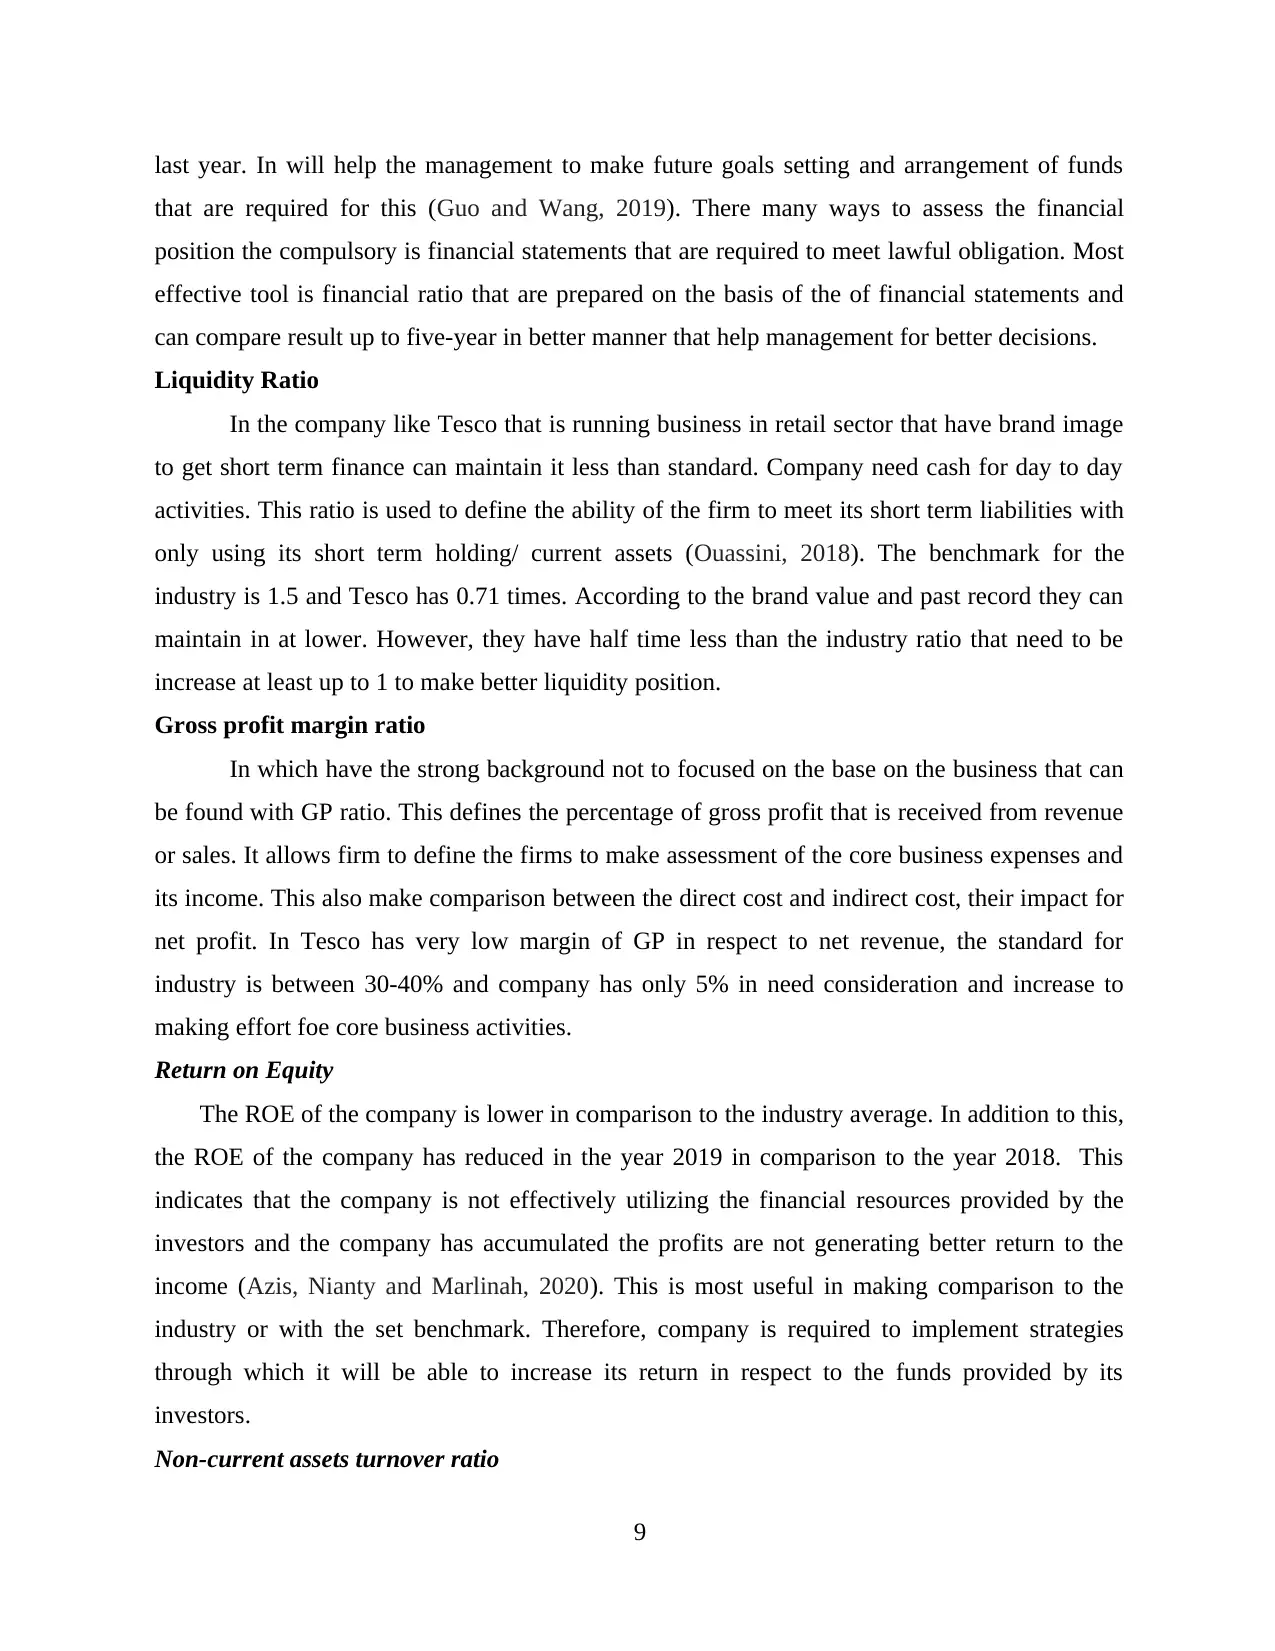
This report presents a strategic financial management analysis of Tesco PLC, focusing on the financial years 2018 and 2019. The analysis employs a variety of financial ratios, including current ratio, gross profit margin, return on equity, non-current assets turnover ratio, capital gearing ratio, dividend cover ratio, interest cover ratio, operating profit ratio, and working capital cycle. The report calculates and interprets these ratios, comparing them to industry averages and assessing Tesco's financial position, liquidity, profitability, and solvency. The findings highlight Tesco's strengths and weaknesses, offering insights into its operational efficiency, financial risk, and ability to meet its financial obligations. The report concludes with an overview of Tesco's financial health and provides recommendations for improvement. This report provides a comprehensive overview of Tesco's financial standing during the specified period, offering valuable insights into its performance and financial stability, supported by relevant calculations and comparisons.

STRATEGIC
FINANCIAL
MANAGEMENT
FINANCIAL
MANAGEMENT
Paraphrase This Document
Need a fresh take? Get an instant paraphrase of this document with our AI Paraphraser

TABLE OF CONTENTS
INTRODUCTION...........................................................................................................................1
TASK...............................................................................................................................................1
1. Ratio calculation of Tesco Plc for 2018-2019.........................................................................1
2. Financial position of Tesco Ltd on the basis of the ratio calculation for 2018-2019..............3
CONCLUSION..............................................................................................................................12
REFERENCES..............................................................................................................................13

INTRODUCTION
Ratio Analysis is management accounting tools that is done to make comparison between
two of more year data to find trend the may help to find useful information future decision-
making. This also provide the assessment to financial position of organization to that make easy
for the investors for find the valuable to make investment. In this report the ratio analysis of
Tesco Ltd is done for the year ended 2019. Tesco is in retail business in UK since 1919 and have
more than 3900 stores with employees base of 423000.
TASK
1. Ratio calculation of Tesco Plc for 2018-2019
Current ratio/ liquidity ratio Amt.£ million
Ratio Formula 2018 2019
Current assets 13600 12570
Current liabilities 19233 20680
Ratio Current assets/ current liabilities 0.71 times 0.61 times
Industry average 1.67 1.63
Gross profit margin ratio Amt.£ million
Ratio Formula 2018 2019
Gross profit(GP) 3352 3401
Revenue 57493 63911
Ratio (GP/revenue)*100 5.83% 5.32%
Industry average 5.38% 4.93%
Return on Equity Amt.£ million
Ratio Formula 2018 2019
Net income 1300 1674
1
⊘ This is a preview!⊘
Do you want full access?
Subscribe today to unlock all pages.

Trusted by 1+ million students worldwide

Shareholders equity/ total assets 10480 14834
Ratio Net income/Shareholders equity 12.40% 11.28%
Industry average 14.5% 15.7%
Non-current assets turnover ratio Amt.£ million
Ratio Formula 2018 2019
Net sales 57493 63911
Fixed assets 31135 36379
Ratio Net sales/Fixed assets 1.85 times 1.76 times
Industry average 2.21 2.15
Capital gearing ratio Amt.£ million
Ratio Formula 2018 2019
Total debt 15171 13533
Shareholders equity 10480 14834
Ratio Total debt/Shareholders equity 0.14 0.09
Industry average 1.25 2.5
Dividend cover ratio Amt.£ million
Ratio Formula 2018 2019
Net income 1300 1674
Dividend for the year 82 357
Ratio (Net income/Dividend for the
year)*100
16.00% 4.69%
Industry average 27% 41%
2
Paraphrase This Document
Need a fresh take? Get an instant paraphrase of this document with our AI Paraphraser

Interest cover ratio Amt.£ million
Ratio Formula 2018 2019
EBIT Earning before tax and interest 1300 1674
Total interest charges 4996 6822
Ratio (EBIT/ Total interest charges)*100 26.02% 24.54%
Industry average 30% 28%
Operating profit ratio Amt.£ million
Ratio Formula 2018 2019
Operating profit 1839 2153
revenue 57493 63911
Ratio (Operating profit/revenue)*100 3.20% 3.37%
Industry average 13.7% 10.1%
Working capital cycle
(period for trade receivable+ inventory turnover period)- period of trade payable
For 2018= (10+15)-61= -36 days
for 2019=(9+16)-57= -32 days
2. Financial position of Tesco Ltd on the basis of the ratio calculation for 2018-2019
(i) Financial summary overview
Liquidity/Current Ratio: This ratio is considered the most important ratio as it is the
financial metrics which measures the ability of the organization in paying off its current debt
obligation through its current assets (Kadim, Sunardi and Husain, 2020). It involves the various
ratios like current, quick, operating cash flow ratio etc.
3
Ratio Formula 2018 2019
EBIT Earning before tax and interest 1300 1674
Total interest charges 4996 6822
Ratio (EBIT/ Total interest charges)*100 26.02% 24.54%
Industry average 30% 28%
Operating profit ratio Amt.£ million
Ratio Formula 2018 2019
Operating profit 1839 2153
revenue 57493 63911
Ratio (Operating profit/revenue)*100 3.20% 3.37%
Industry average 13.7% 10.1%
Working capital cycle
(period for trade receivable+ inventory turnover period)- period of trade payable
For 2018= (10+15)-61= -36 days
for 2019=(9+16)-57= -32 days
2. Financial position of Tesco Ltd on the basis of the ratio calculation for 2018-2019
(i) Financial summary overview
Liquidity/Current Ratio: This ratio is considered the most important ratio as it is the
financial metrics which measures the ability of the organization in paying off its current debt
obligation through its current assets (Kadim, Sunardi and Husain, 2020). It involves the various
ratios like current, quick, operating cash flow ratio etc.
3

Gross profit margin ratio: This ratio is the analytical metrics which depicts the
percentage of gross profit over its net sales (Myšková and Hájek, 2017). It determines the
contribution of the gross profit in the entire profit of the company. It indicates the how much
efficient the company is respect to managing its operations.
Return on Equity: This ratio helps in measuring the financial performance of the entity
through the way of dividing the net income by the shareholder’s equity. It mainly measures the
profitability of the business entity in relation to its equity shareholders (Zarei, Yazdifar and
4
⊘ This is a preview!⊘
Do you want full access?
Subscribe today to unlock all pages.

Trusted by 1+ million students worldwide

Ghaleno, 2020). This is an important measure used by the investors in taking decision whether
to invest in the company or not.
Non-current assets turnover ratio: Under this ratio, the efficiency of the company is
measured by dividing the net sales with the fixed assets of the company. This allows the
company in measuring the how well the company is generating its revenue from optimum
utilizing its plants, machinery and equipment. This ratio sometimes also analyses the leverage
and the profitability of the company. In addition to this, it helps in delivering better outcome to
the business and in decision making.
5
Paraphrase This Document
Need a fresh take? Get an instant paraphrase of this document with our AI Paraphraser

Capital gearing ratio: It is the ratio of debt in relation to its equity and is also called as
the financial leverage. It measures and depicts the financial risk of the company in terms of the
combination of debt and equity in its capital structure.
Dividend cover ratio: It is useful in measuring the number of times the company can pay
dividend to its shareholders. It is the useful metric which is being used by the organization in
determining eth ability of the company in paying dividend to its shareholders. Based upon this,
investors, take decision whether to invest in the company or not.
6

Interest cover ratio (ICR): It is the debt and profitability ratio which helps in measuring
the ability of the business entity in making payment of its interest obligations (HAYES, 2021).
This helps in determining the company’s riskiness in relation to its current debt or pertaining or
the future borrowings.
Operating profit ratio: It is the profitability ratio which depicts the profit percentage
which is being generated from its operational business activities before deducting any taxes or
interest charges. This helps in determining the effectiveness and efficiency of the business in
regard to the generating profit from the main business activity.
7
⊘ This is a preview!⊘
Do you want full access?
Subscribe today to unlock all pages.

Trusted by 1+ million students worldwide

Working capital cycle: It refers to the amount of time which is needed to convert the net
current assets and current liabilities into cash. The longer cycle indicates that the business is
tying it capital in its working capital. Therefore, the company requires to implement actions for
reducing it.
(ii) Analysis and evaluation of ratio results
Financial position- it is the record of all activities that are need by the company in
particular year and need assessment to find the growth rate of the organization in reference to
8
Paraphrase This Document
Need a fresh take? Get an instant paraphrase of this document with our AI Paraphraser

last year. In will help the management to make future goals setting and arrangement of funds
that are required for this (Guo and Wang, 2019). There many ways to assess the financial
position the compulsory is financial statements that are required to meet lawful obligation. Most
effective tool is financial ratio that are prepared on the basis of the of financial statements and
can compare result up to five-year in better manner that help management for better decisions.
Liquidity Ratio
In the company like Tesco that is running business in retail sector that have brand image
to get short term finance can maintain it less than standard. Company need cash for day to day
activities. This ratio is used to define the ability of the firm to meet its short term liabilities with
only using its short term holding/ current assets (Ouassini, 2018). The benchmark for the
industry is 1.5 and Tesco has 0.71 times. According to the brand value and past record they can
maintain in at lower. However, they have half time less than the industry ratio that need to be
increase at least up to 1 to make better liquidity position.
Gross profit margin ratio
In which have the strong background not to focused on the base on the business that can
be found with GP ratio. This defines the percentage of gross profit that is received from revenue
or sales. It allows firm to define the firms to make assessment of the core business expenses and
its income. This also make comparison between the direct cost and indirect cost, their impact for
net profit. In Tesco has very low margin of GP in respect to net revenue, the standard for
industry is between 30-40% and company has only 5% in need consideration and increase to
making effort foe core business activities.
Return on Equity
The ROE of the company is lower in comparison to the industry average. In addition to this,
the ROE of the company has reduced in the year 2019 in comparison to the year 2018. This
indicates that the company is not effectively utilizing the financial resources provided by the
investors and the company has accumulated the profits are not generating better return to the
income (Azis, Nianty and Marlinah, 2020). This is most useful in making comparison to the
industry or with the set benchmark. Therefore, company is required to implement strategies
through which it will be able to increase its return in respect to the funds provided by its
investors.
Non-current assets turnover ratio
9

It accounts for the effective utilization of the fixed assets of the company in respect to
generating revenue for the company. It is preferred to have higher ratio which means that the
company is effectively making use of its assets. In respect to Tesco, the Non-current assets
turnover ratio low but there is no major deviation with the industry average. In the year 2018, it
was 1.85 times while in the year 2019 it was 1.76 times. Therefore, there is no major variation in
the figures of two years. The company requires take corrective steps and regularly monitor its
operational activities which will help in determining whether the company is optimum utilizing
it production capacity pertaining to generating higher revenue.
Capital gearing ratio
This ratio measures the capital structure of the organization along with its financial
strength and is considered very important for the investors both actual and potential. The capital
gearing ratio of Tesco is favorable as it is very low which is highly desired. This indicates that
the company is taken less debt in comparison to its equity which results into less financial
burden over the functioning of the business (Sayari and Mugan, 2017). This ratio is even lower
than the industry ratio which means that the company is performing effectively and making right
funding decisions. In order to further improve the situation, it is better for the company to covert
its loans into shares by negotiating with the lenders. In addition to this, the company can
implement steps for increasing the speed of its accounts receivable collection, in addition to this,
reduce current inventory levels or by extending the days of accounts payable payments. All
these strategies will help in retaining ach for longer term.
Dividend cover ratio
The dividend coverage ratio Tesco was 0.26 in 2018 while it was 0.25 in the year 2019.
This ratio indicates that the company is having poor and deteriorating profitability pertaining to
the future and this also indicate that the company is unable to sustain its current level of
dividend payout ratios. Therefore, it is a point of concern for Tesco as it clearly highlights its
inability to pay dividend to its shareholders. Thus, corrective measures are required to be
implemented pertaining to increasing the profits of the company which can be mainly possible
through the way of reducing cost and increase in revenue.
Interest cover ratio (ICR)
The ICR is little tricky as it is mainly depends upon how much risk the creditors or
investors are willing to take. If the value is less than 1 this conveys that the company is not
10
⊘ This is a preview!⊘
Do you want full access?
Subscribe today to unlock all pages.

Trusted by 1+ million students worldwide
1 out of 15
Related Documents
Your All-in-One AI-Powered Toolkit for Academic Success.
+13062052269
info@desklib.com
Available 24*7 on WhatsApp / Email
Unlock your academic potential
Copyright © 2020–2025 A2Z Services. All Rights Reserved. Developed and managed by ZUCOL.


