Financial Analysis: Tesco Liquidity, Investment Appraisal, and LMU PLC
VerifiedAdded on 2020/02/05
|8
|985
|57
Report
AI Summary
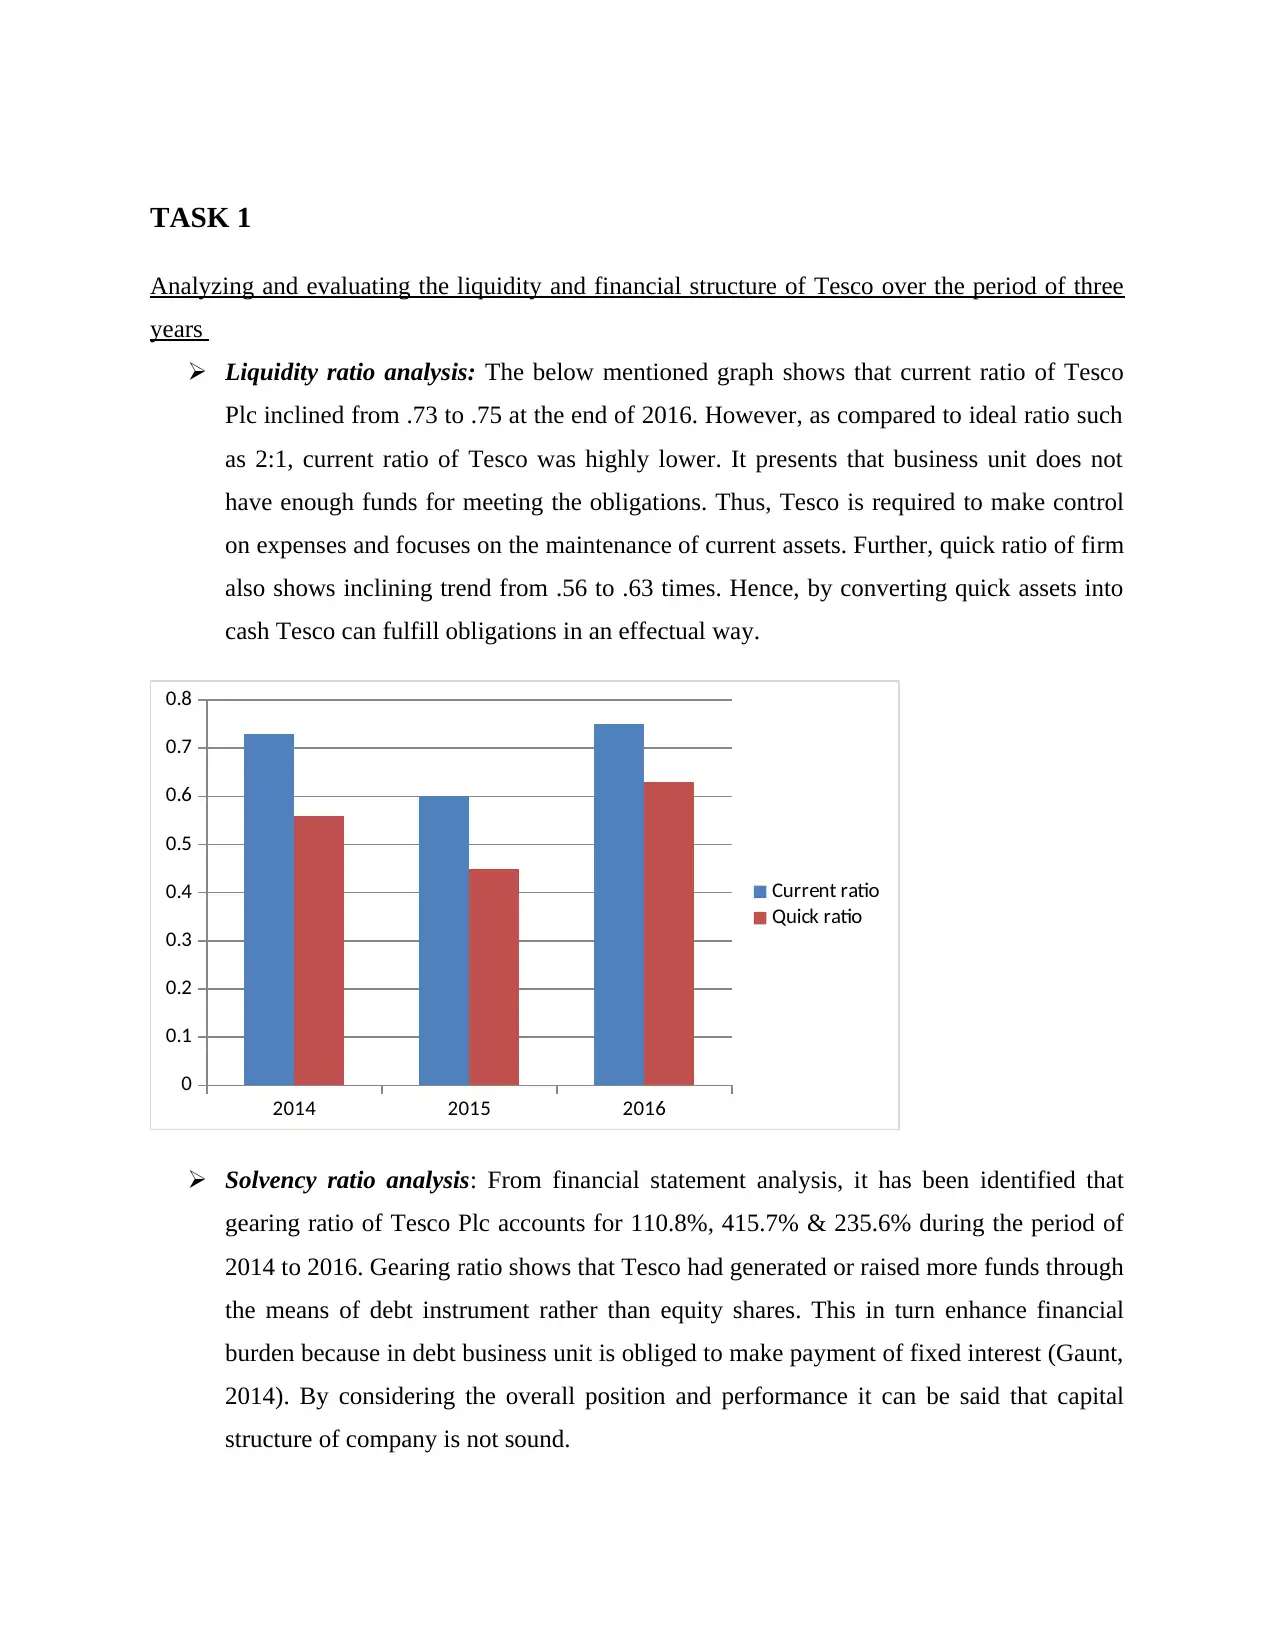
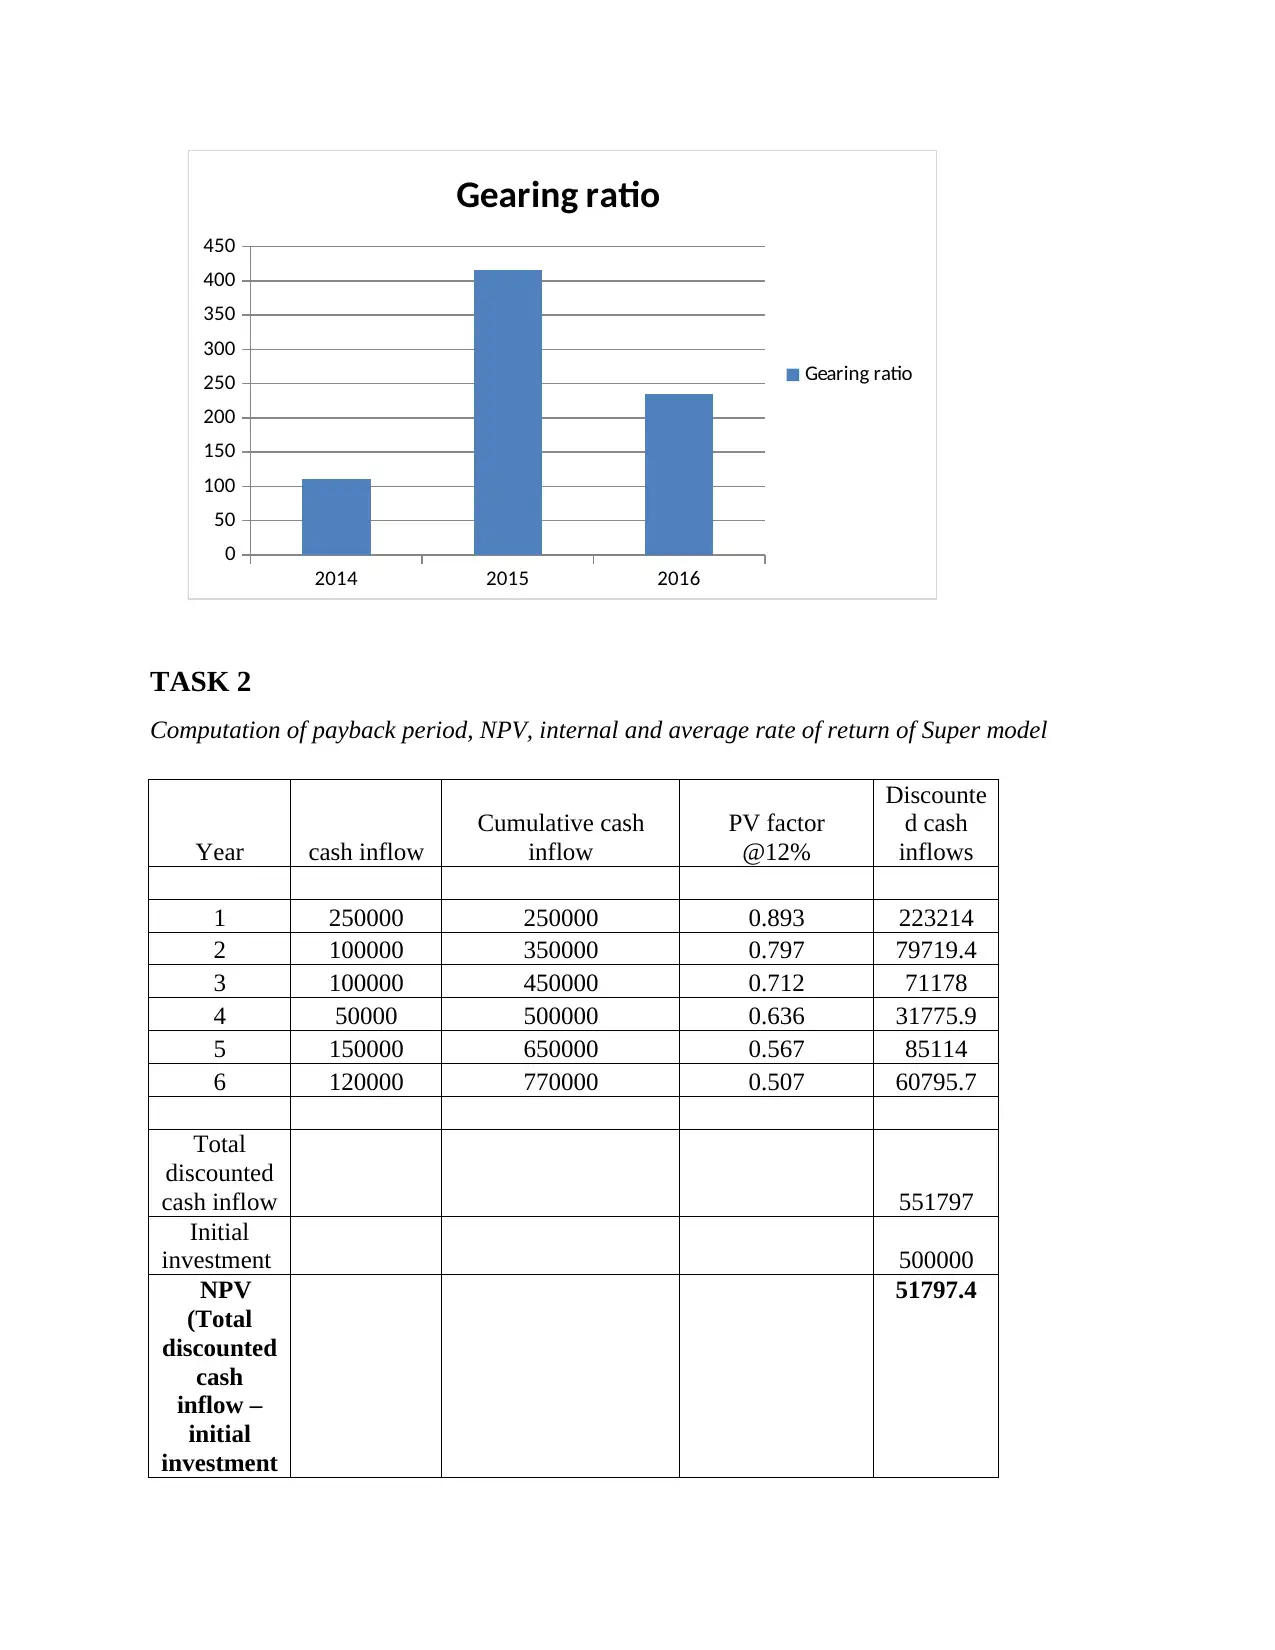
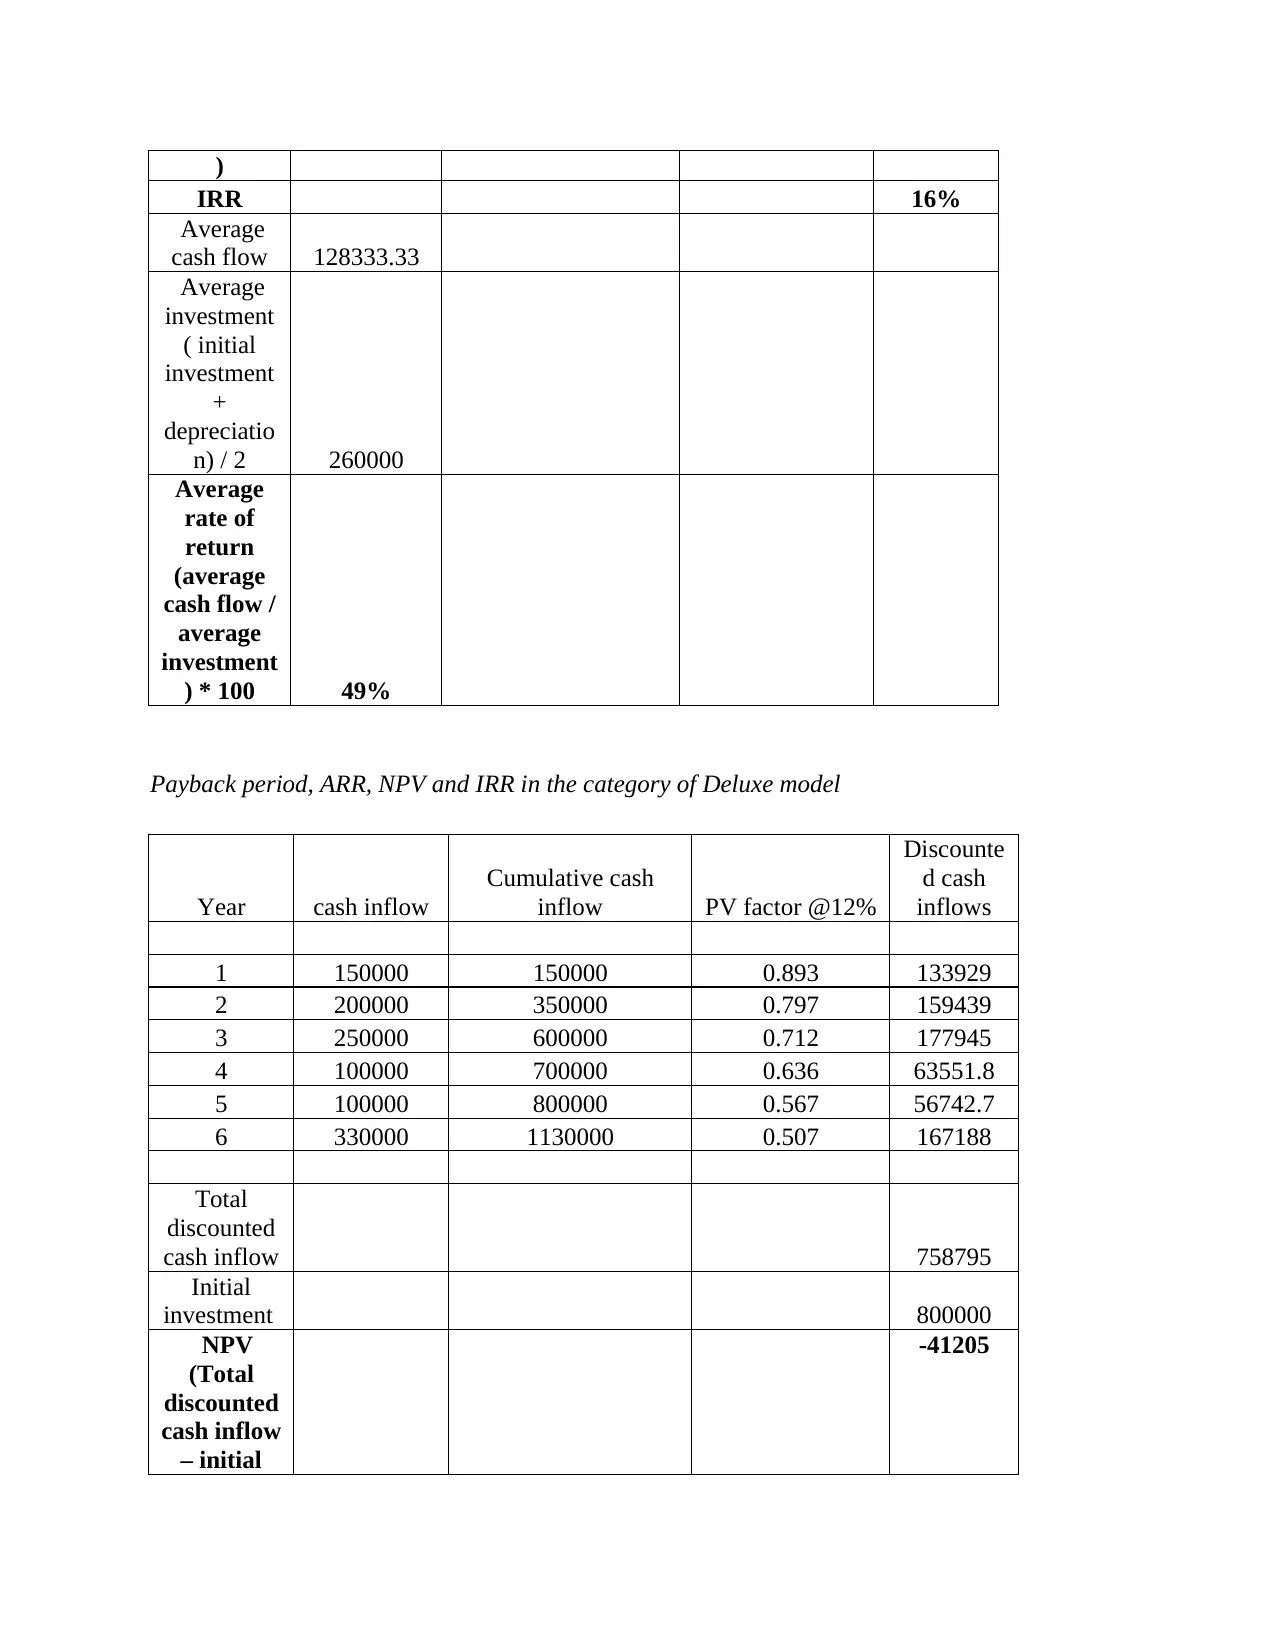
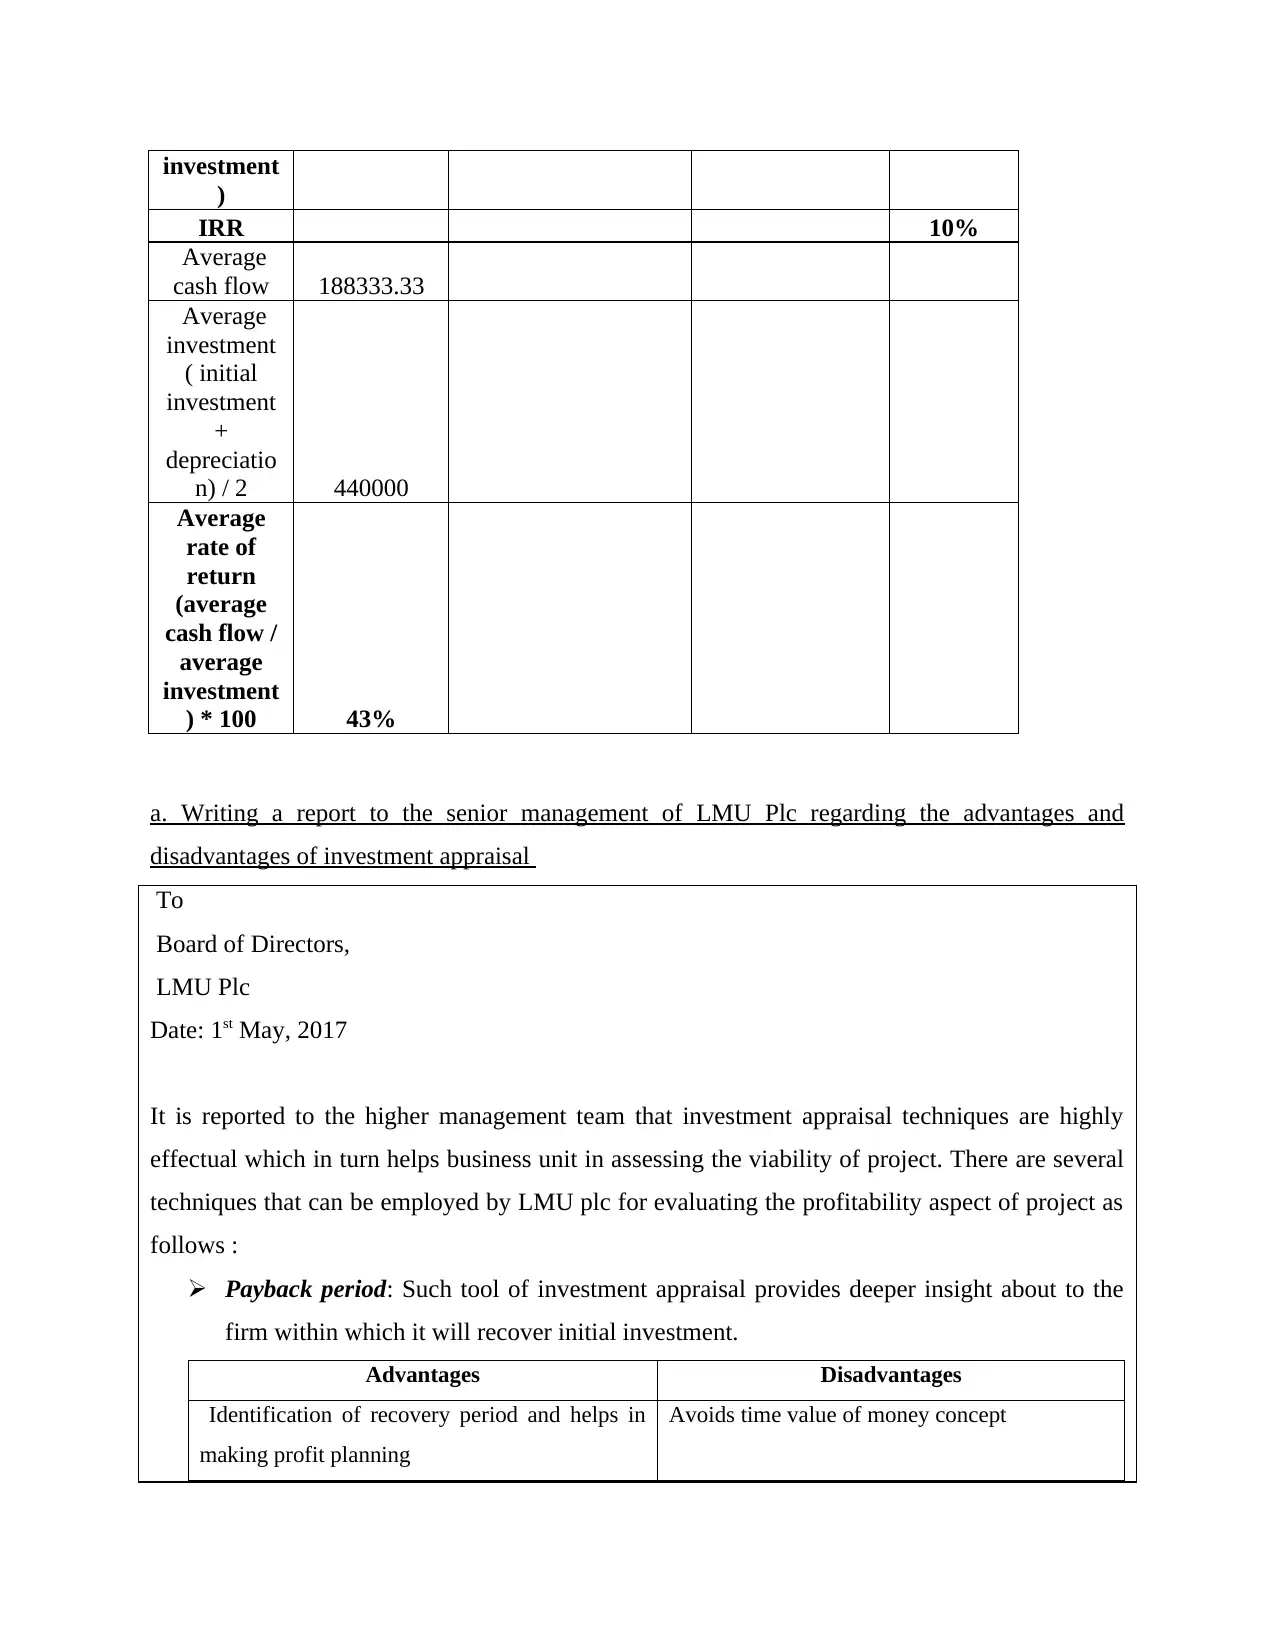
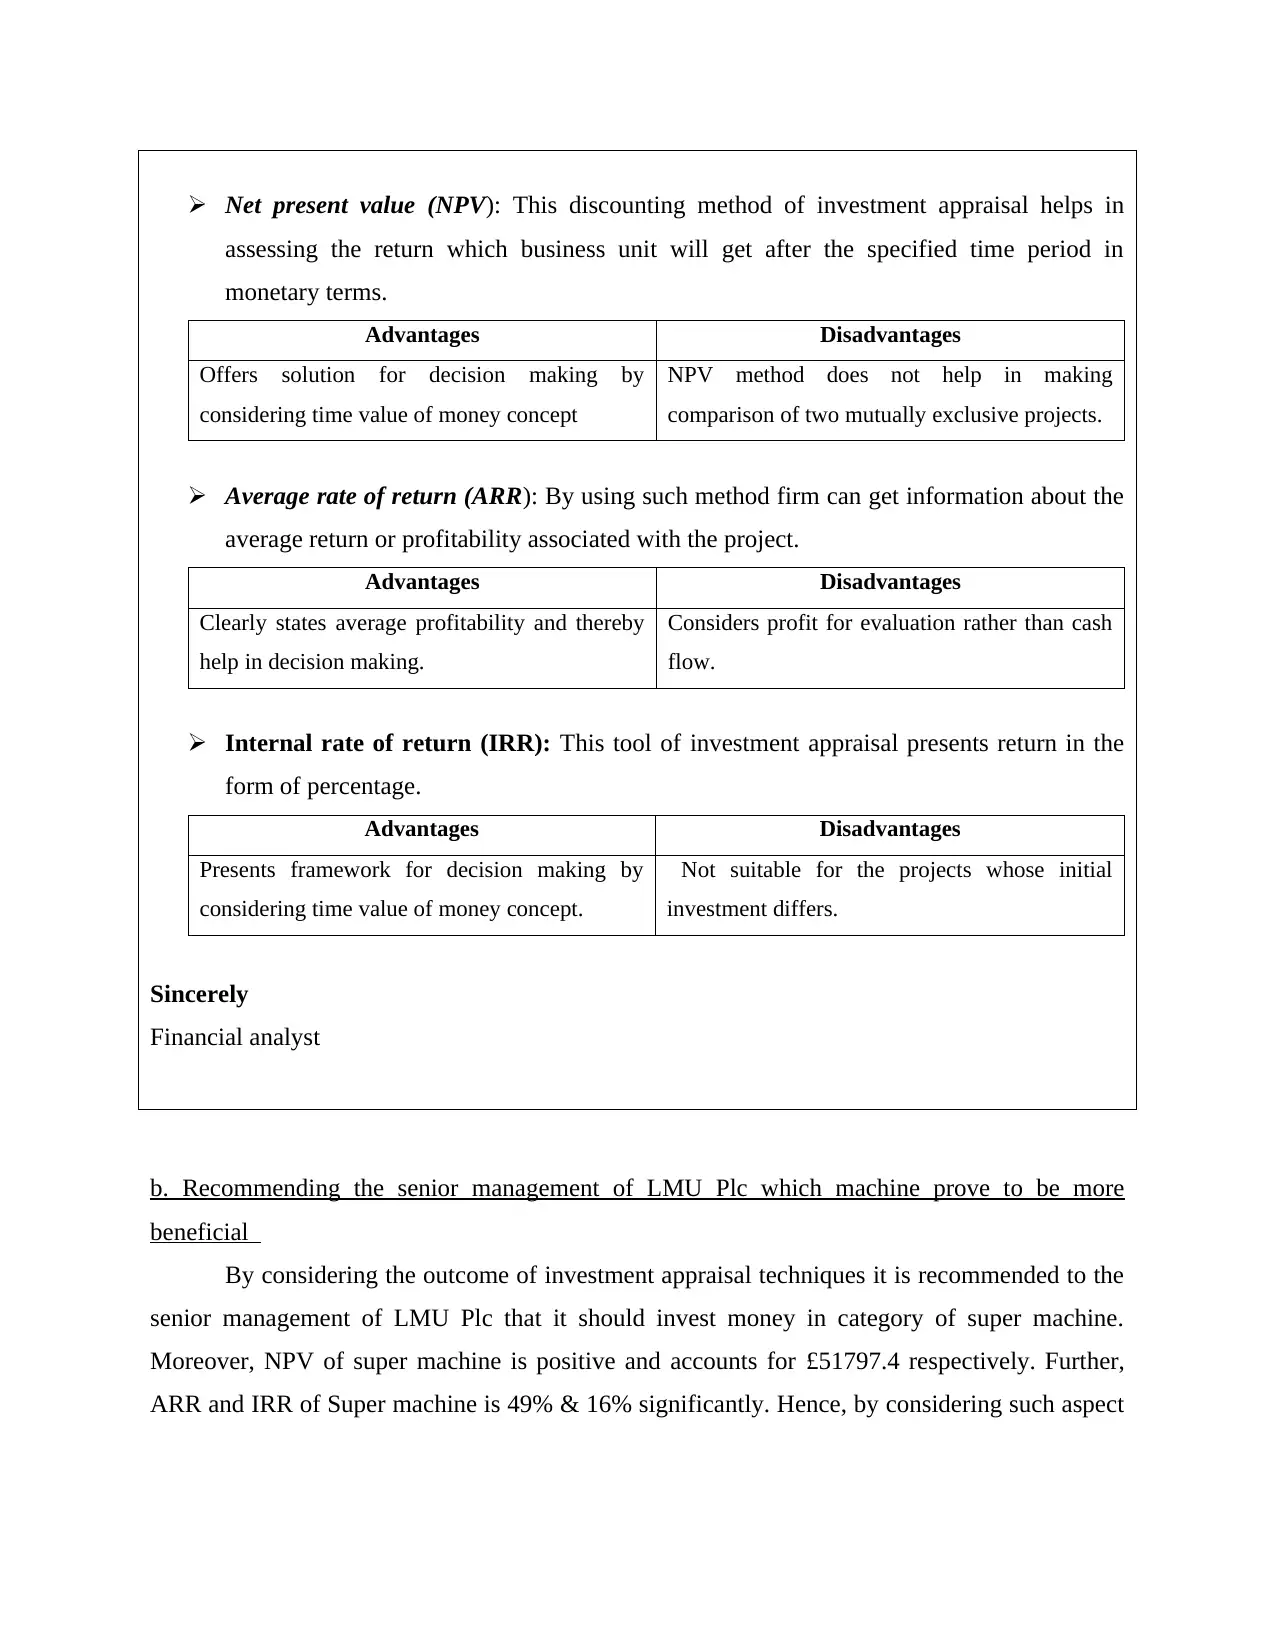
This report provides a detailed financial analysis of Tesco's performance over a three-year period, focusing on liquidity and solvency ratios. It evaluates Tesco's financial structure, highlighting the company's current and quick ratios, as well as its gearing ratio, to assess its ability to meet short-term obligations and manage its debt. The report also delves into investment appraisal techniques, including payback period, net present value (NPV), internal rate of return (IRR), and average rate of return (ARR), applied to two machine models (Super and Deluxe). It includes a report to LMU PLC's senior management, discussing the advantages and disadvantages of each appraisal method and recommending the 'Super' machine based on its superior financial metrics (positive NPV, higher IRR, and ARR). The analysis is supported by financial data, calculations, and references to relevant accounting and finance literature.

Management and Finance
Paraphrase This Document
Need a fresh take? Get an instant paraphrase of this document with our AI Paraphraser

Table of Contents
TASK 1............................................................................................................................................3
Analyzing and evaluating the liquidity and financial structure of Tesco over the period of three
years.............................................................................................................................................3
TASK 2............................................................................................................................................4
a. Writing a report to the senior management of LMU Plc regarding the advantages and
disadvantages of investment appraisal.........................................................................................6
b. Recommending the senior management of LMU Plc which machine prove to be more
beneficial......................................................................................................................................7
CONCLUSION................................................................................................................................7

TASK 1
Analyzing and evaluating the liquidity and financial structure of Tesco over the period of three
years
Liquidity ratio analysis: The below mentioned graph shows that current ratio of Tesco
Plc inclined from .73 to .75 at the end of 2016. However, as compared to ideal ratio such
as 2:1, current ratio of Tesco was highly lower. It presents that business unit does not
have enough funds for meeting the obligations. Thus, Tesco is required to make control
on expenses and focuses on the maintenance of current assets. Further, quick ratio of firm
also shows inclining trend from .56 to .63 times. Hence, by converting quick assets into
cash Tesco can fulfill obligations in an effectual way.
2014 2015 2016
0
0.1
0.2
0.3
0.4
0.5
0.6
0.7
0.8
Current ratio
Quick ratio
Solvency ratio analysis: From financial statement analysis, it has been identified that
gearing ratio of Tesco Plc accounts for 110.8%, 415.7% & 235.6% during the period of
2014 to 2016. Gearing ratio shows that Tesco had generated or raised more funds through
the means of debt instrument rather than equity shares. This in turn enhance financial
burden because in debt business unit is obliged to make payment of fixed interest (Gaunt,
2014). By considering the overall position and performance it can be said that capital
structure of company is not sound.
⊘ This is a preview!⊘
Do you want full access?
Subscribe today to unlock all pages.

Trusted by 1+ million students worldwide

2014 2015 2016
0
50
100
150
200
250
300
350
400
450
Gearing ratio
Gearing ratio
TASK 2
Computation of payback period, NPV, internal and average rate of return of Super model
Year cash inflow
Cumulative cash
inflow
PV factor
@12%
Discounte
d cash
inflows
1 250000 250000 0.893 223214
2 100000 350000 0.797 79719.4
3 100000 450000 0.712 71178
4 50000 500000 0.636 31775.9
5 150000 650000 0.567 85114
6 120000 770000 0.507 60795.7
Total
discounted
cash inflow 551797
Initial
investment 500000
NPV
(Total
discounted
cash
inflow –
initial
investment
51797.4
Paraphrase This Document
Need a fresh take? Get an instant paraphrase of this document with our AI Paraphraser

)
IRR 16%
Average
cash flow 128333.33
Average
investment
( initial
investment
+
depreciatio
n) / 2 260000
Average
rate of
return
(average
cash flow /
average
investment
) * 100 49%
Payback period, ARR, NPV and IRR in the category of Deluxe model
Year cash inflow
Cumulative cash
inflow PV factor @12%
Discounte
d cash
inflows
1 150000 150000 0.893 133929
2 200000 350000 0.797 159439
3 250000 600000 0.712 177945
4 100000 700000 0.636 63551.8
5 100000 800000 0.567 56742.7
6 330000 1130000 0.507 167188
Total
discounted
cash inflow 758795
Initial
investment 800000
NPV
(Total
discounted
cash inflow
– initial
-41205

investment
)
IRR 10%
Average
cash flow 188333.33
Average
investment
( initial
investment
+
depreciatio
n) / 2 440000
Average
rate of
return
(average
cash flow /
average
investment
) * 100 43%
a. Writing a report to the senior management of LMU Plc regarding the advantages and
disadvantages of investment appraisal
To
Board of Directors,
LMU Plc
Date: 1st May, 2017
It is reported to the higher management team that investment appraisal techniques are highly
effectual which in turn helps business unit in assessing the viability of project. There are several
techniques that can be employed by LMU plc for evaluating the profitability aspect of project as
follows :
Payback period: Such tool of investment appraisal provides deeper insight about to the
firm within which it will recover initial investment.
Advantages Disadvantages
Identification of recovery period and helps in
making profit planning
Avoids time value of money concept
⊘ This is a preview!⊘
Do you want full access?
Subscribe today to unlock all pages.

Trusted by 1+ million students worldwide

Net present value (NPV): This discounting method of investment appraisal helps in
assessing the return which business unit will get after the specified time period in
monetary terms.
Advantages Disadvantages
Offers solution for decision making by
considering time value of money concept
NPV method does not help in making
comparison of two mutually exclusive projects.
Average rate of return (ARR): By using such method firm can get information about the
average return or profitability associated with the project.
Advantages Disadvantages
Clearly states average profitability and thereby
help in decision making.
Considers profit for evaluation rather than cash
flow.
Internal rate of return (IRR): This tool of investment appraisal presents return in the
form of percentage.
Advantages Disadvantages
Presents framework for decision making by
considering time value of money concept.
Not suitable for the projects whose initial
investment differs.
Sincerely
Financial analyst
b. Recommending the senior management of LMU Plc which machine prove to be more
beneficial
By considering the outcome of investment appraisal techniques it is recommended to the
senior management of LMU Plc that it should invest money in category of super machine.
Moreover, NPV of super machine is positive and accounts for £51797.4 respectively. Further,
ARR and IRR of Super machine is 49% & 16% significantly. Hence, by considering such aspect
Paraphrase This Document
Need a fresh take? Get an instant paraphrase of this document with our AI Paraphraser

it can be stated that machine of super category will offer higher return to LMU Plc as compared
to other proposal (Shortall and et.al., 2016).
1 out of 8
Related Documents
Your All-in-One AI-Powered Toolkit for Academic Success.
+13062052269
info@desklib.com
Available 24*7 on WhatsApp / Email
Unlock your academic potential
Copyright © 2020–2025 A2Z Services. All Rights Reserved. Developed and managed by ZUCOL.


