Financial Analysis Report: Comparing Tesco and M&S Plc Performance
VerifiedAdded on 2020/07/22
|9
|1328
|38
Report
AI Summary
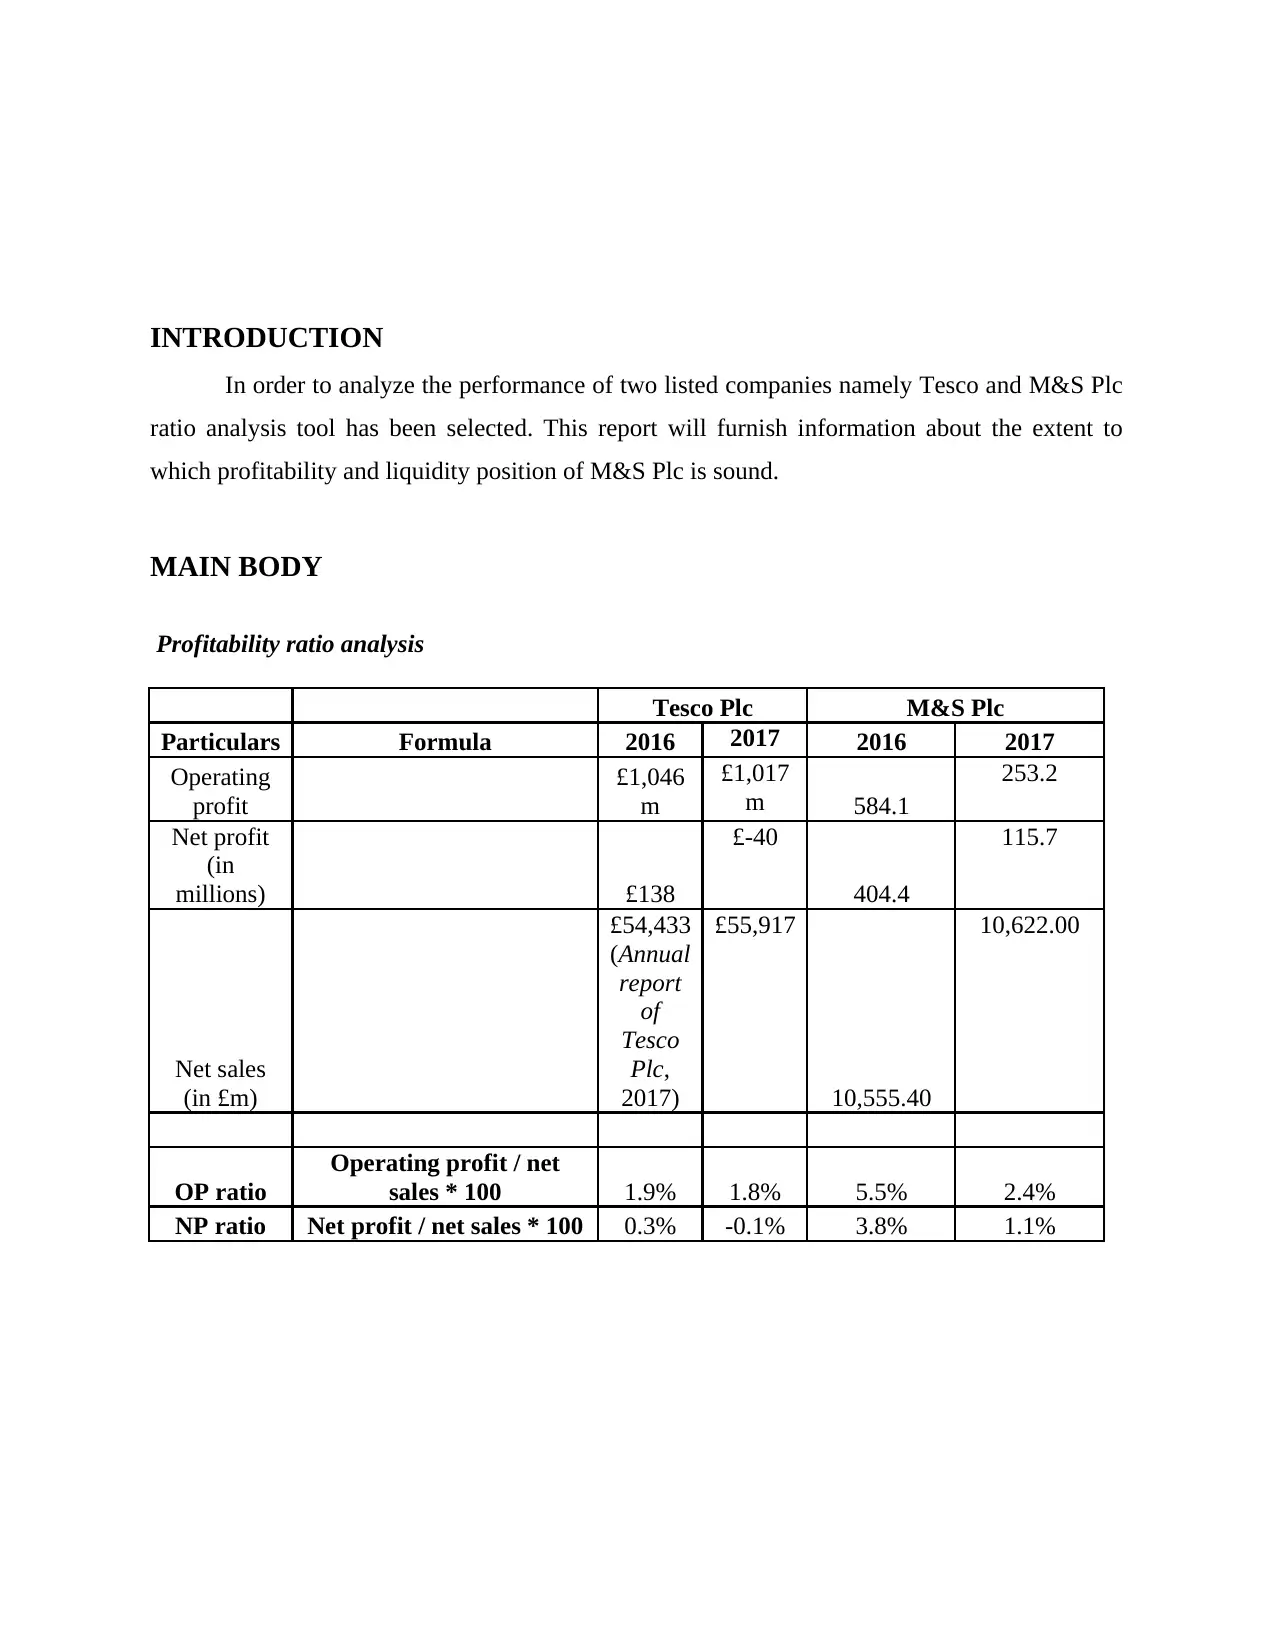
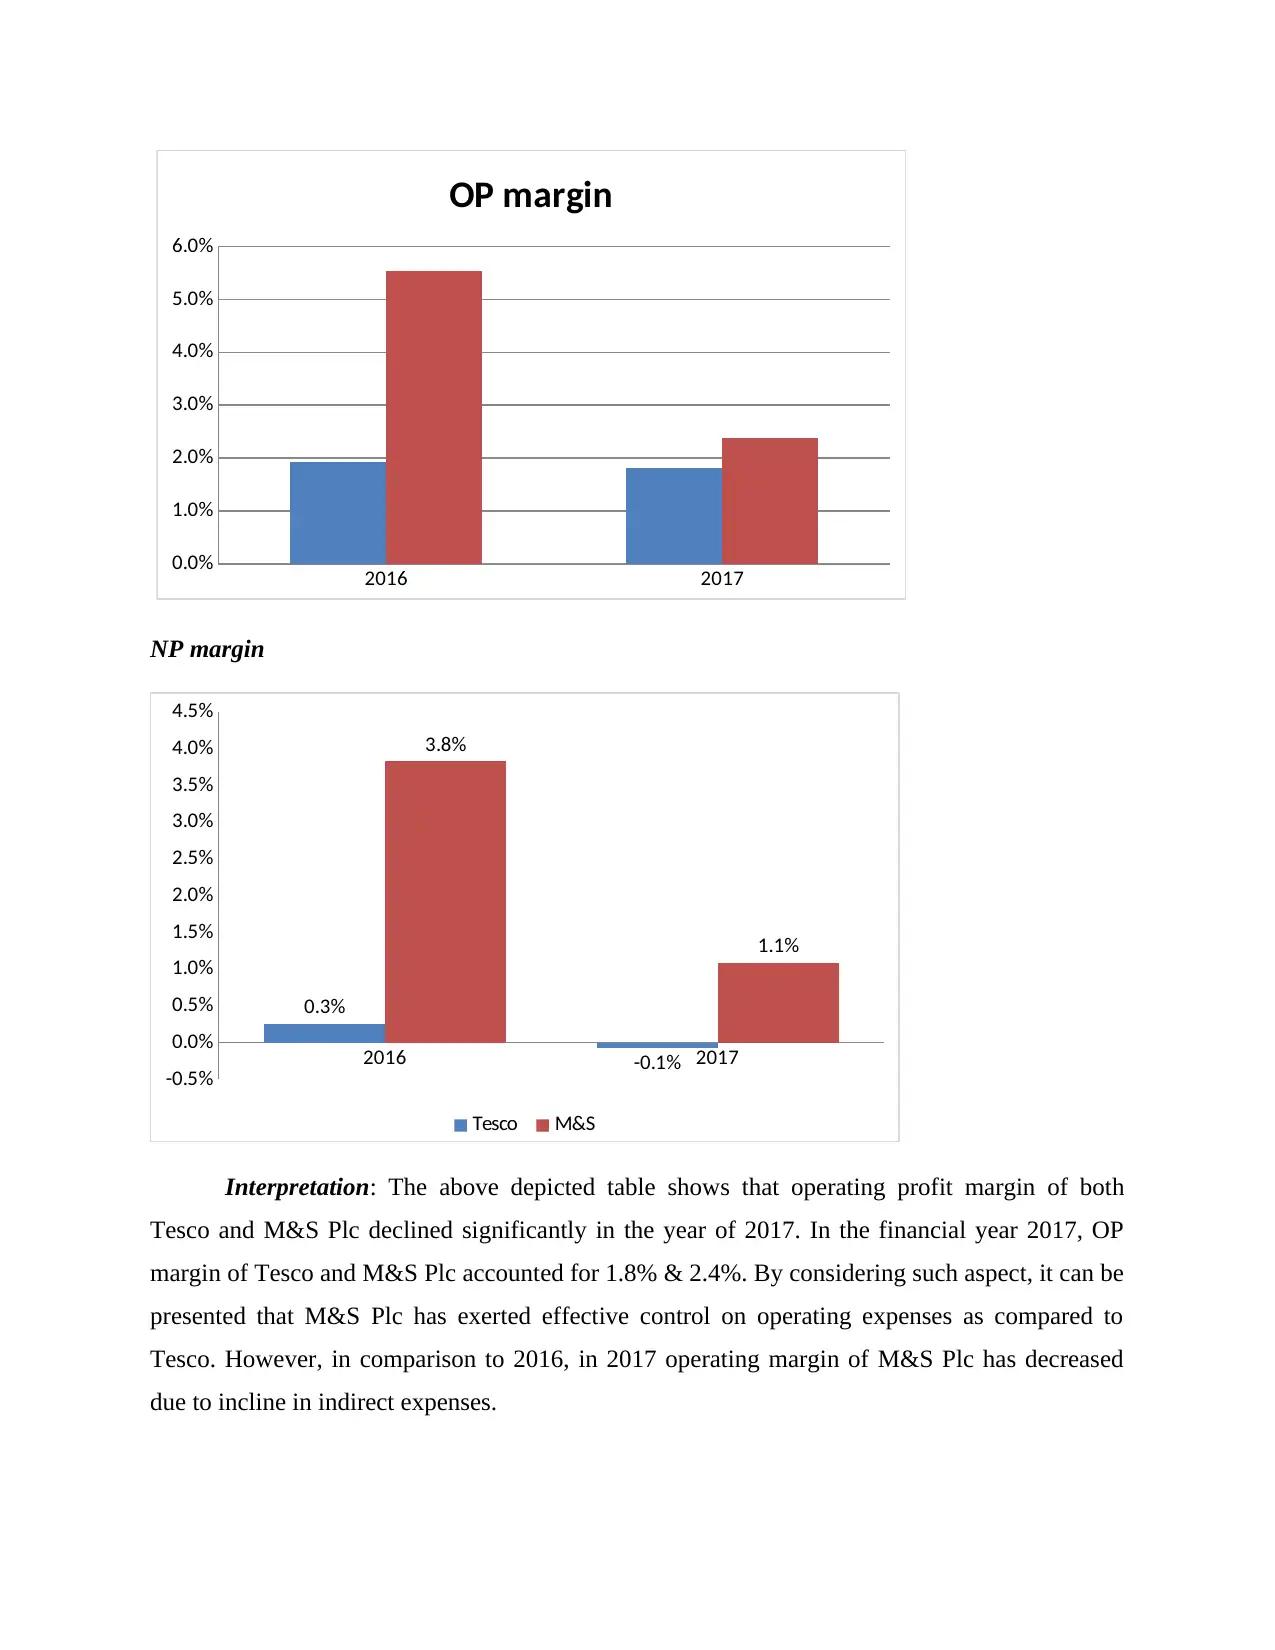
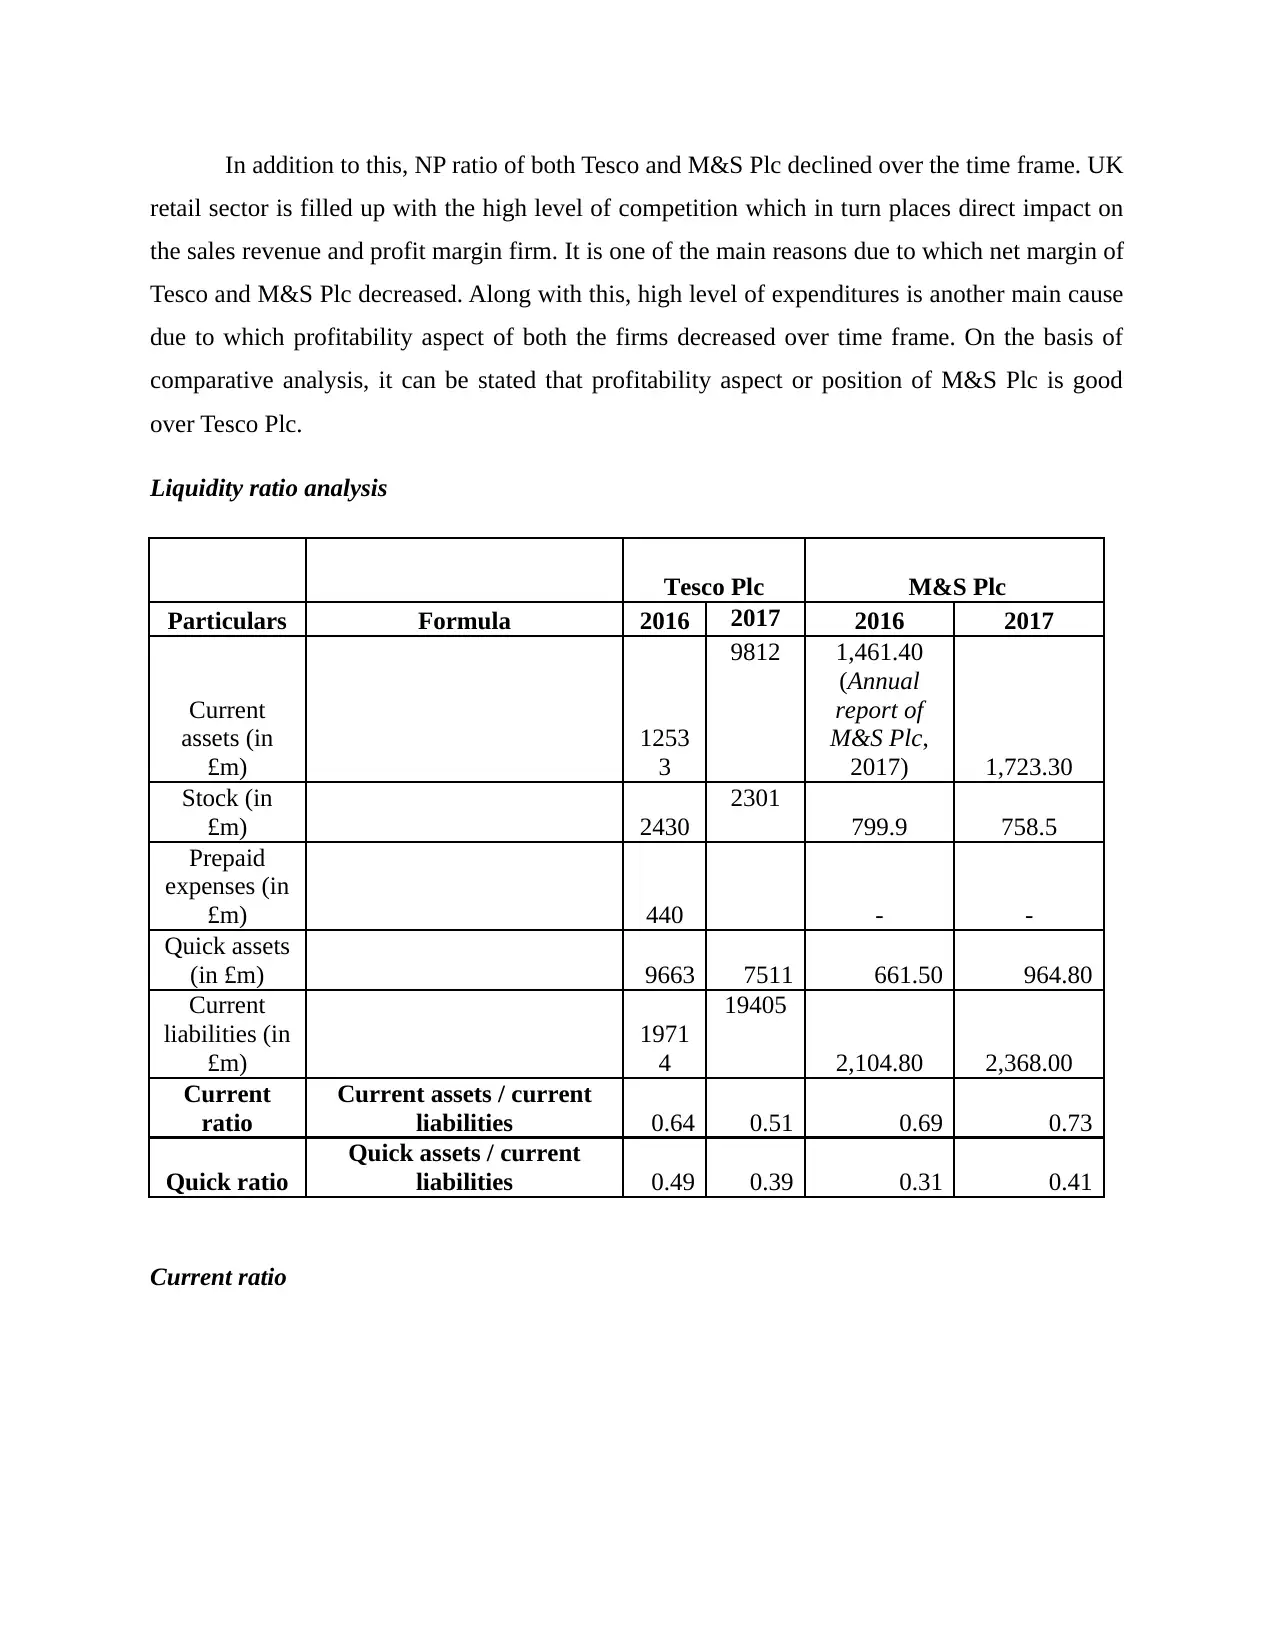
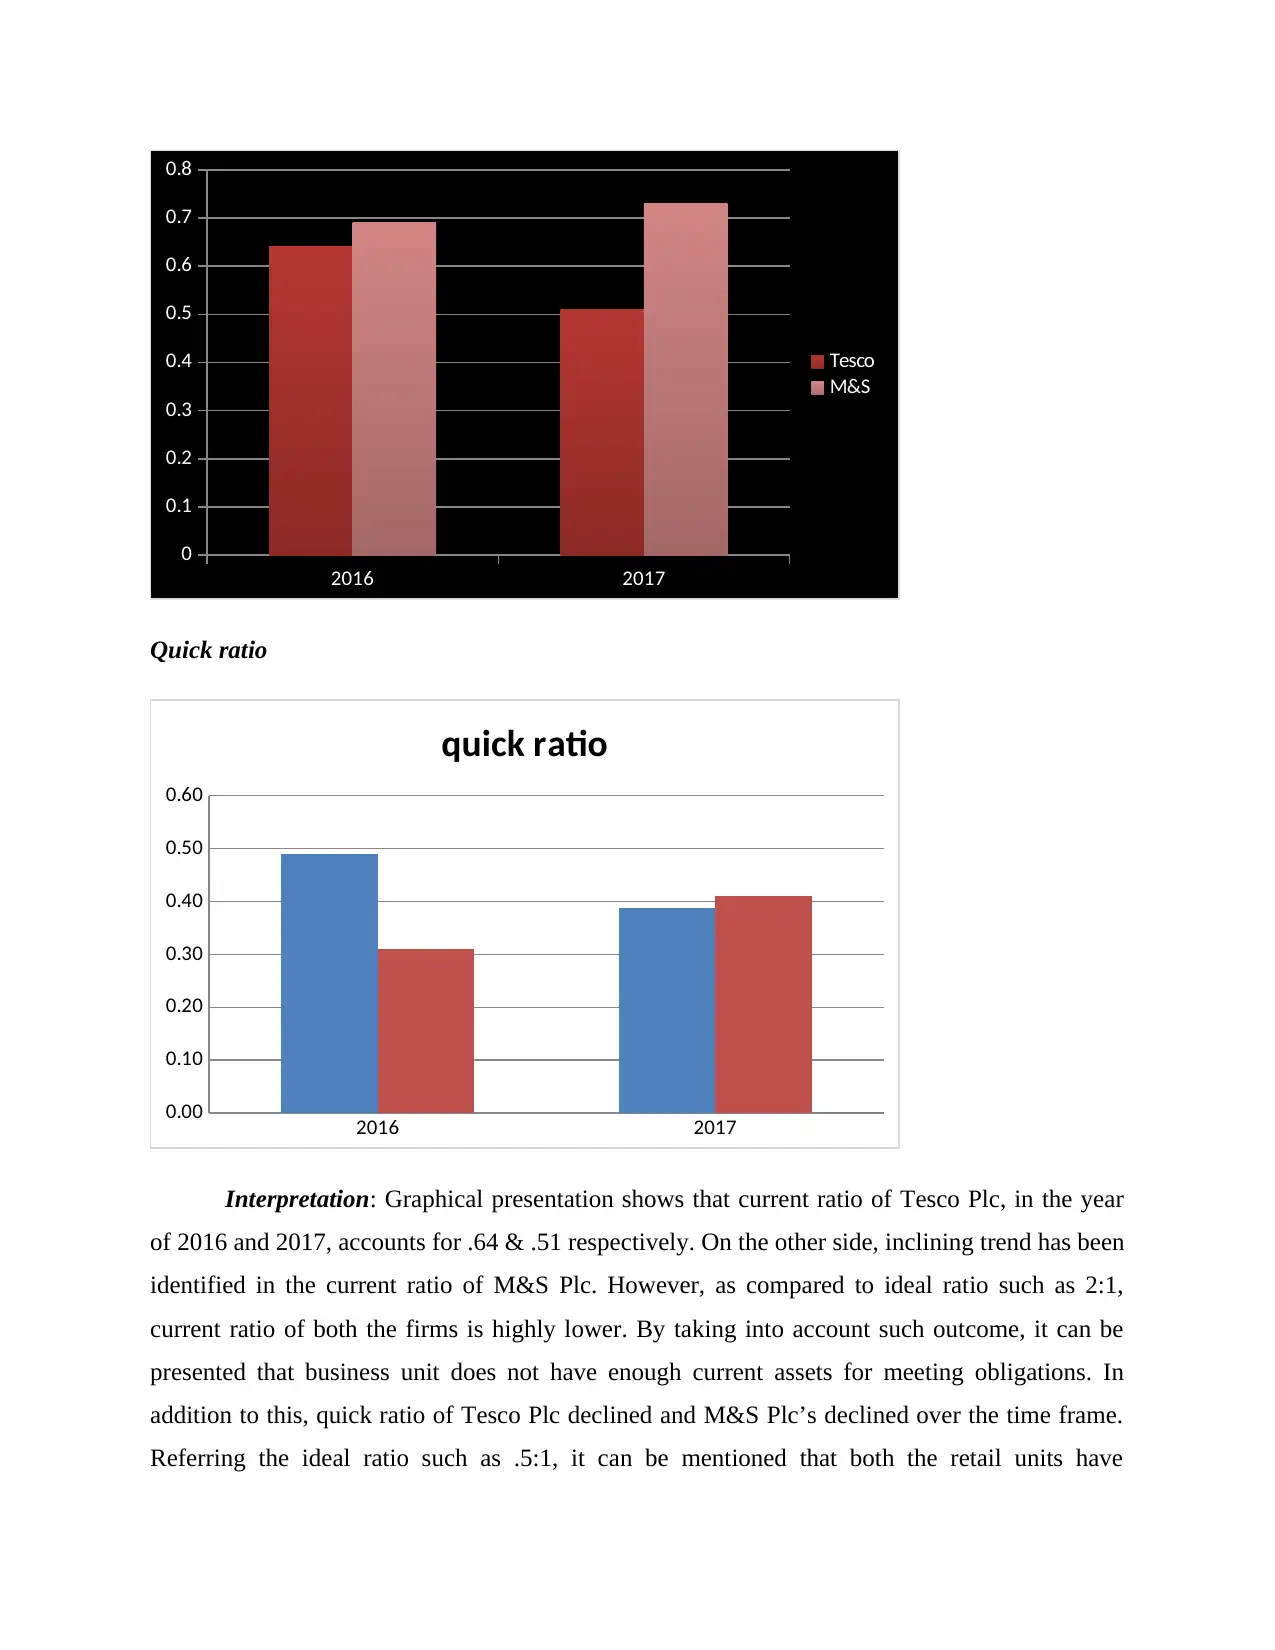
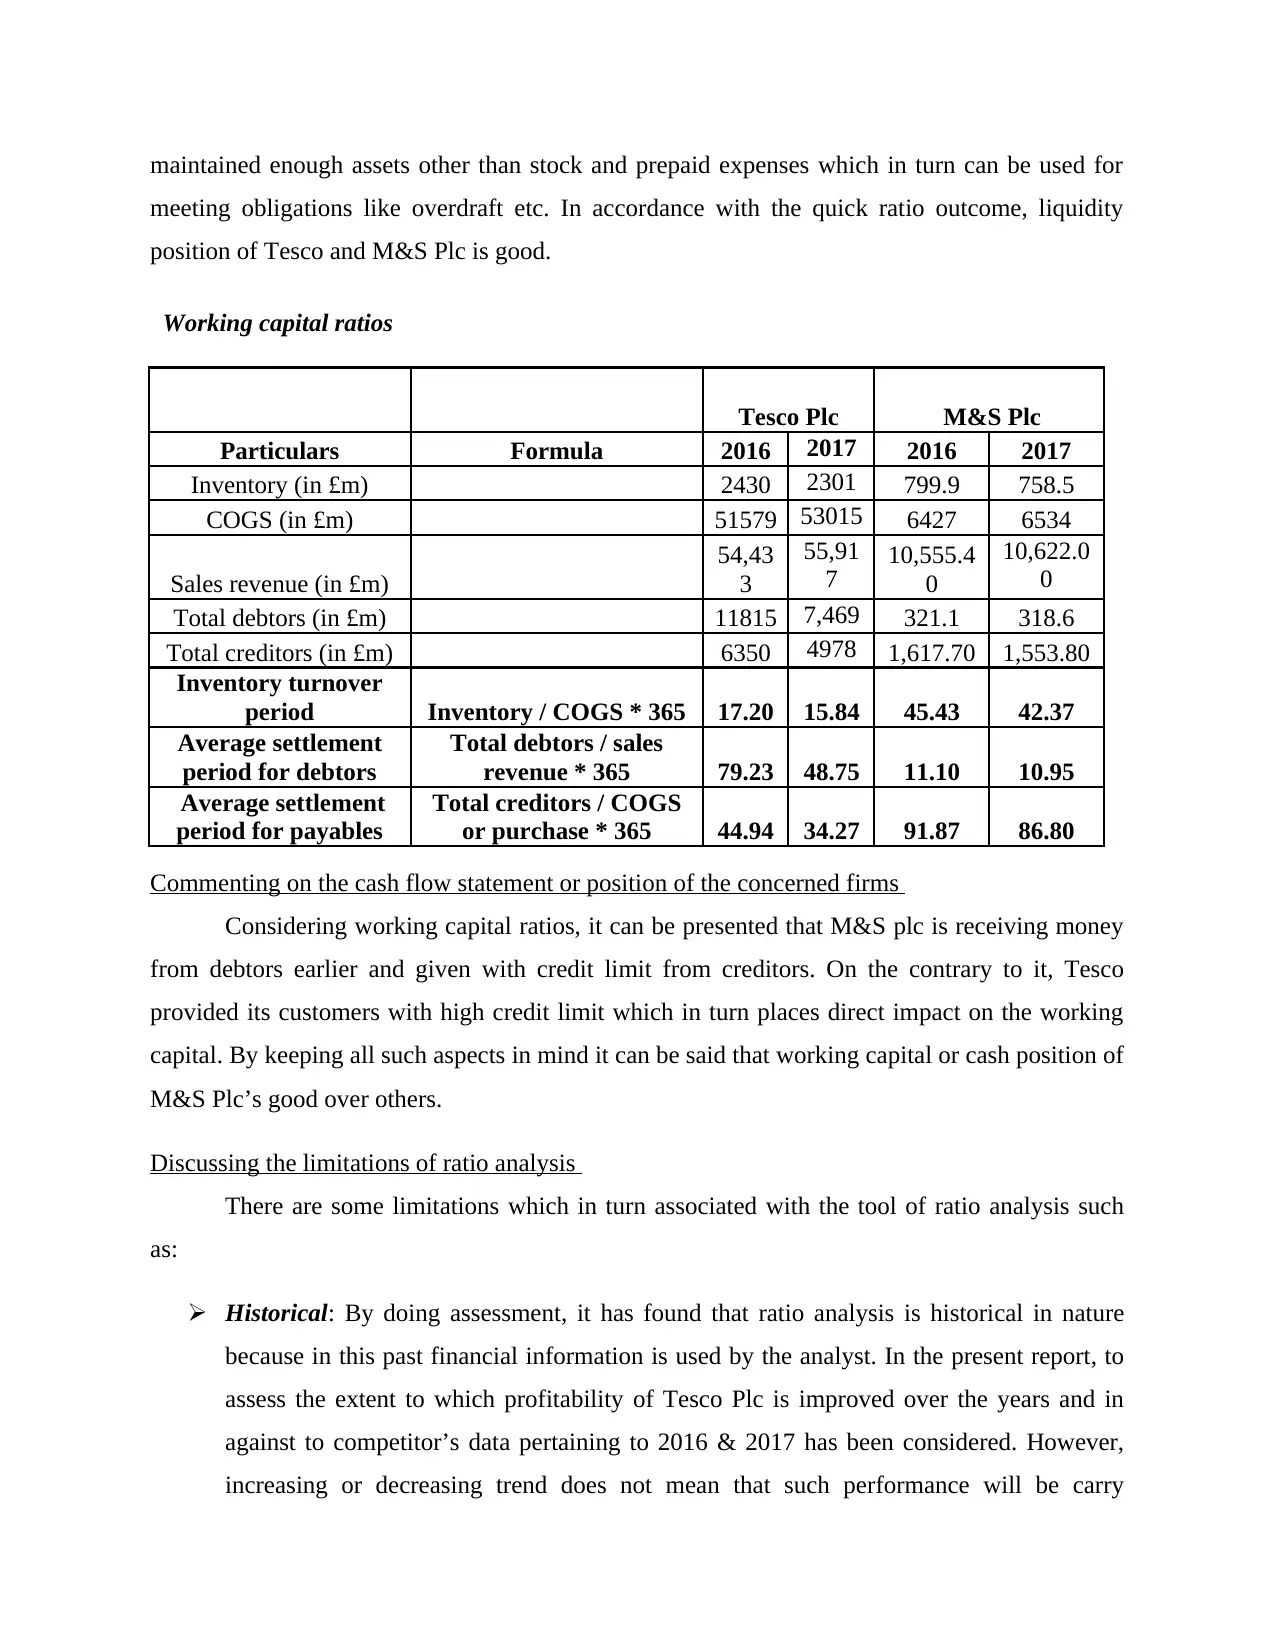
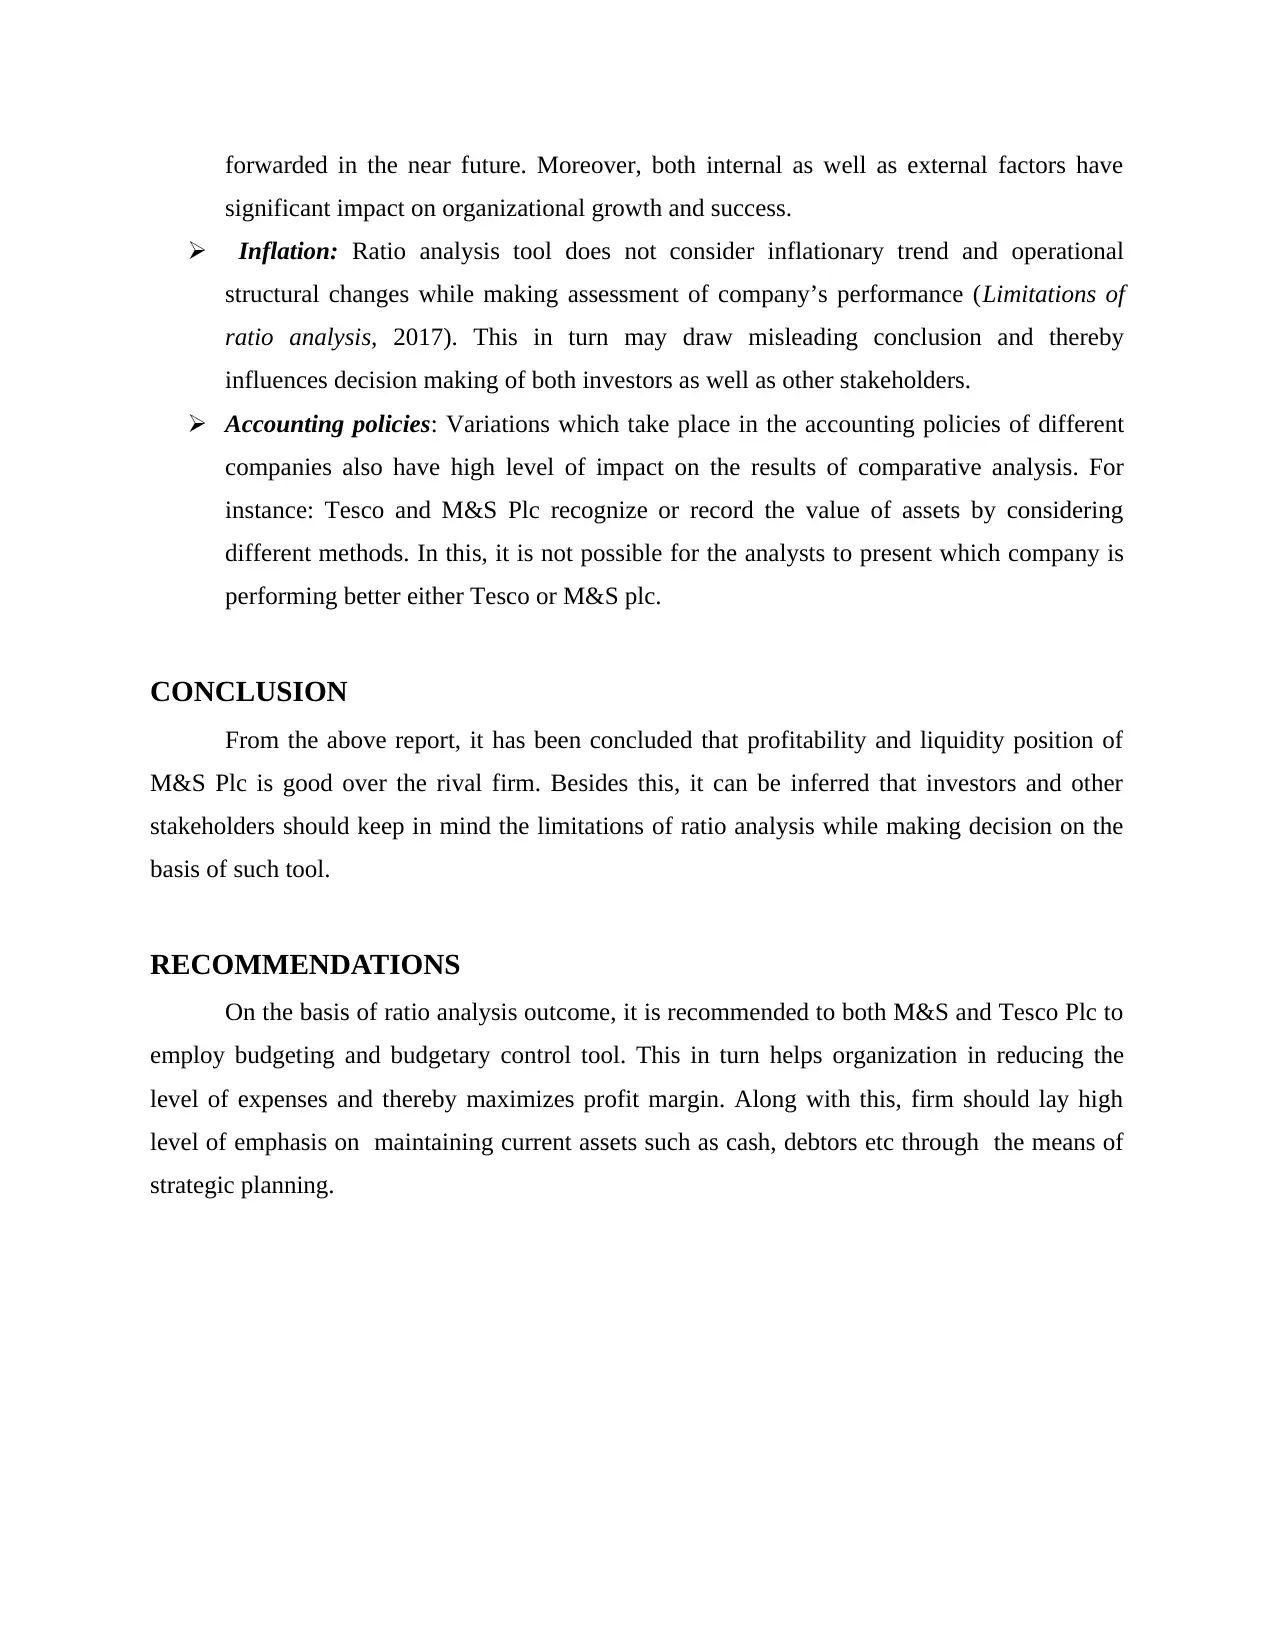
This report provides a detailed financial analysis of Tesco and M&S Plc, two prominent UK companies, using ratio analysis to assess their performance. The analysis covers profitability, liquidity, and working capital ratios for the years 2016 and 2017, comparing the two companies across various metrics. Key ratios such as operating profit margin, net profit margin, current ratio, quick ratio, inventory turnover, and debtor/creditor settlement periods are examined. The report interprets the financial data, highlighting the strengths and weaknesses of each company, and discusses the limitations of ratio analysis. The conclusion states that M&S Plc had a better profitability and liquidity position compared to Tesco Plc. The report also offers recommendations for both companies, such as employing budgeting and budgetary control, and strategic planning for maintaining current assets. Finally, the report includes a list of references used for the analysis.

Analysis of a set of two UK Companies Report and Accounts
Paraphrase This Document
Need a fresh take? Get an instant paraphrase of this document with our AI Paraphraser

TABLE OF CONTENTS
INTRODUCTION...........................................................................................................................1
MAIN BODY..................................................................................................................................1
Commenting on the cash flow statement or position of the concerned firms.............................5
Discussing the limitations of ratio analysis.................................................................................5
CONCLUSION................................................................................................................................6
RECOMMENDATIONS.................................................................................................................6
REFERENCES................................................................................................................................7

INTRODUCTION
In order to analyze the performance of two listed companies namely Tesco and M&S Plc
ratio analysis tool has been selected. This report will furnish information about the extent to
which profitability and liquidity position of M&S Plc is sound.
MAIN BODY
Profitability ratio analysis
Tesco Plc M&S Plc
Particulars Formula 2016 2017 2016 2017
Operating
profit
£1,046
m
£1,017
m 584.1
253.2
Net profit
(in
millions) £138
£-40
404.4
115.7
Net sales
(in £m)
£54,433
(Annual
report
of
Tesco
Plc,
2017)
£55,917
10,555.40
10,622.00
OP ratio
Operating profit / net
sales * 100 1.9% 1.8% 5.5% 2.4%
NP ratio Net profit / net sales * 100 0.3% -0.1% 3.8% 1.1%
⊘ This is a preview!⊘
Do you want full access?
Subscribe today to unlock all pages.

Trusted by 1+ million students worldwide

2016 2017
0.0%
1.0%
2.0%
3.0%
4.0%
5.0%
6.0%
OP margin
NP margin
2016 2017
-0.5%
0.0%
0.5%
1.0%
1.5%
2.0%
2.5%
3.0%
3.5%
4.0%
4.5%
0.3%
-0.1%
3.8%
1.1%
Tesco M&S
Interpretation: The above depicted table shows that operating profit margin of both
Tesco and M&S Plc declined significantly in the year of 2017. In the financial year 2017, OP
margin of Tesco and M&S Plc accounted for 1.8% & 2.4%. By considering such aspect, it can be
presented that M&S Plc has exerted effective control on operating expenses as compared to
Tesco. However, in comparison to 2016, in 2017 operating margin of M&S Plc has decreased
due to incline in indirect expenses.
0.0%
1.0%
2.0%
3.0%
4.0%
5.0%
6.0%
OP margin
NP margin
2016 2017
-0.5%
0.0%
0.5%
1.0%
1.5%
2.0%
2.5%
3.0%
3.5%
4.0%
4.5%
0.3%
-0.1%
3.8%
1.1%
Tesco M&S
Interpretation: The above depicted table shows that operating profit margin of both
Tesco and M&S Plc declined significantly in the year of 2017. In the financial year 2017, OP
margin of Tesco and M&S Plc accounted for 1.8% & 2.4%. By considering such aspect, it can be
presented that M&S Plc has exerted effective control on operating expenses as compared to
Tesco. However, in comparison to 2016, in 2017 operating margin of M&S Plc has decreased
due to incline in indirect expenses.
Paraphrase This Document
Need a fresh take? Get an instant paraphrase of this document with our AI Paraphraser

In addition to this, NP ratio of both Tesco and M&S Plc declined over the time frame. UK
retail sector is filled up with the high level of competition which in turn places direct impact on
the sales revenue and profit margin firm. It is one of the main reasons due to which net margin of
Tesco and M&S Plc decreased. Along with this, high level of expenditures is another main cause
due to which profitability aspect of both the firms decreased over time frame. On the basis of
comparative analysis, it can be stated that profitability aspect or position of M&S Plc is good
over Tesco Plc.
Liquidity ratio analysis
Tesco Plc M&S Plc
Particulars Formula 2016 2017 2016 2017
Current
assets (in
£m)
1253
3
9812 1,461.40
(Annual
report of
M&S Plc,
2017) 1,723.30
Stock (in
£m) 2430
2301
799.9 758.5
Prepaid
expenses (in
£m) 440 - -
Quick assets
(in £m) 9663 7511 661.50 964.80
Current
liabilities (in
£m)
1971
4
19405
2,104.80 2,368.00
Current
ratio
Current assets / current
liabilities 0.64 0.51 0.69 0.73
Quick ratio
Quick assets / current
liabilities 0.49 0.39 0.31 0.41
Current ratio

2016 2017
0
0.1
0.2
0.3
0.4
0.5
0.6
0.7
0.8
Tesco
M&S
Quick ratio
2016 2017
0.00
0.10
0.20
0.30
0.40
0.50
0.60
quick ratio
Interpretation: Graphical presentation shows that current ratio of Tesco Plc, in the year
of 2016 and 2017, accounts for .64 & .51 respectively. On the other side, inclining trend has been
identified in the current ratio of M&S Plc. However, as compared to ideal ratio such as 2:1,
current ratio of both the firms is highly lower. By taking into account such outcome, it can be
presented that business unit does not have enough current assets for meeting obligations. In
addition to this, quick ratio of Tesco Plc declined and M&S Plc’s declined over the time frame.
Referring the ideal ratio such as .5:1, it can be mentioned that both the retail units have
⊘ This is a preview!⊘
Do you want full access?
Subscribe today to unlock all pages.

Trusted by 1+ million students worldwide

maintained enough assets other than stock and prepaid expenses which in turn can be used for
meeting obligations like overdraft etc. In accordance with the quick ratio outcome, liquidity
position of Tesco and M&S Plc is good.
Working capital ratios
Tesco Plc M&S Plc
Particulars Formula 2016 2017 2016 2017
Inventory (in £m) 2430 2301 799.9 758.5
COGS (in £m) 51579 53015 6427 6534
Sales revenue (in £m)
54,43
3
55,91
7 10,555.4
0
10,622.0
0
Total debtors (in £m) 11815 7,469 321.1 318.6
Total creditors (in £m) 6350 4978 1,617.70 1,553.80
Inventory turnover
period Inventory / COGS * 365 17.20 15.84 45.43 42.37
Average settlement
period for debtors
Total debtors / sales
revenue * 365 79.23 48.75 11.10 10.95
Average settlement
period for payables
Total creditors / COGS
or purchase * 365 44.94 34.27 91.87 86.80
Commenting on the cash flow statement or position of the concerned firms
Considering working capital ratios, it can be presented that M&S plc is receiving money
from debtors earlier and given with credit limit from creditors. On the contrary to it, Tesco
provided its customers with high credit limit which in turn places direct impact on the working
capital. By keeping all such aspects in mind it can be said that working capital or cash position of
M&S Plc’s good over others.
Discussing the limitations of ratio analysis
There are some limitations which in turn associated with the tool of ratio analysis such
as:
Historical: By doing assessment, it has found that ratio analysis is historical in nature
because in this past financial information is used by the analyst. In the present report, to
assess the extent to which profitability of Tesco Plc is improved over the years and in
against to competitor’s data pertaining to 2016 & 2017 has been considered. However,
increasing or decreasing trend does not mean that such performance will be carry
Paraphrase This Document
Need a fresh take? Get an instant paraphrase of this document with our AI Paraphraser

forwarded in the near future. Moreover, both internal as well as external factors have
significant impact on organizational growth and success.
Inflation: Ratio analysis tool does not consider inflationary trend and operational
structural changes while making assessment of company’s performance (Limitations of
ratio analysis, 2017). This in turn may draw misleading conclusion and thereby
influences decision making of both investors as well as other stakeholders.
Accounting policies: Variations which take place in the accounting policies of different
companies also have high level of impact on the results of comparative analysis. For
instance: Tesco and M&S Plc recognize or record the value of assets by considering
different methods. In this, it is not possible for the analysts to present which company is
performing better either Tesco or M&S plc.
CONCLUSION
From the above report, it has been concluded that profitability and liquidity position of
M&S Plc is good over the rival firm. Besides this, it can be inferred that investors and other
stakeholders should keep in mind the limitations of ratio analysis while making decision on the
basis of such tool.
RECOMMENDATIONS
On the basis of ratio analysis outcome, it is recommended to both M&S and Tesco Plc to
employ budgeting and budgetary control tool. This in turn helps organization in reducing the
level of expenses and thereby maximizes profit margin. Along with this, firm should lay high
level of emphasis on maintaining current assets such as cash, debtors etc through the means of
strategic planning.

REFERENCES
Online.
Annual report of M&S Plc. 2017. [Pdf]. Available through: <
https://corporate.marksandspencer.com/investors/9d6dacd542ca4c9c8cc79b00d7c00cf0>.
Annual report of Tesco Plc. 2017. [Pdf]. Available through:
https://www.tescoplc.com/media/392373/68336_tesco_ar_digital_interactive_250417.pdf.
Limitations of ratio analysis. 2017. [Online]. Available through: <
https://www.accountingtools.com/articles/what-are-the-limitations-of-ratio-analysis.html>.
⊘ This is a preview!⊘
Do you want full access?
Subscribe today to unlock all pages.

Trusted by 1+ million students worldwide
1 out of 9
Related Documents

Your All-in-One AI-Powered Toolkit for Academic Success.
+13062052269
info@desklib.com
Available 24*7 on WhatsApp / Email
Unlock your academic potential
Copyright © 2020–2025 A2Z Services. All Rights Reserved. Developed and managed by ZUCOL.